Ask a few futures traders about a CPI morning and the same story comes back. The open is jumpy. The first move often gets taken back, and the real direction can wait until the dust settles. Ask about the last session of a quarter and a different story comes back, built around the closing auction. Traders carry these pictures around in their heads. Most never get to check them against the record.
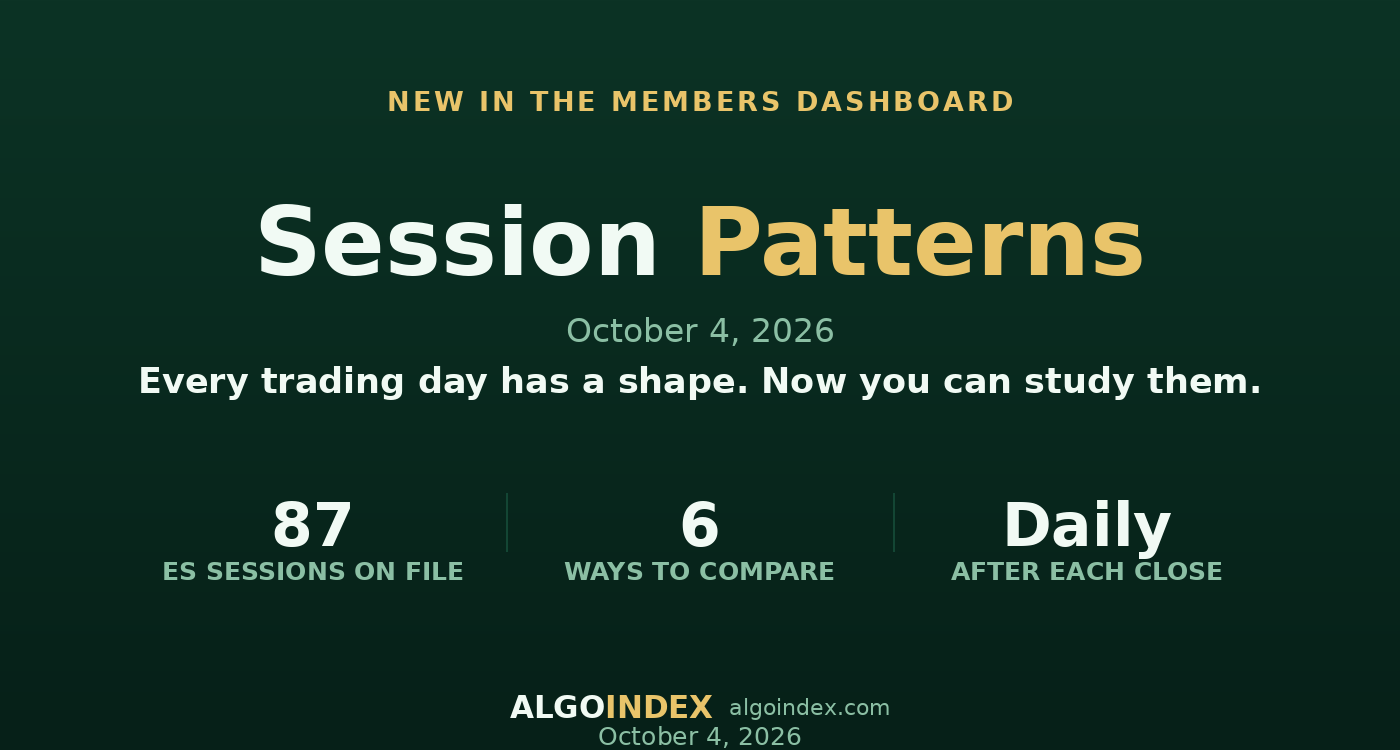
That is the idea behind Session Patterns, a new page in the AlgoIndex members dashboard. It takes every ES session on file, labels each one by the kind of day it was, and lets members put similar days side by side.
What a "day type" means here
A day type is a plain label for what made a session different. Some come from the calendar: an inflation release, a jobs report, a Fed decision, a monthly or quarterly expiration, a month end or quarter end. Others come from how the day traded: a trend from the open, a wide range, a narrow one. One session can carry several labels at once. That overlap is often where the interesting comparisons live.
The page currently holds 87 ES sessions, from June 1 through October 2, 2026, and adds the newest one after each close. When this article went out, the session ringed as newest on the map was Friday, October 2, a payrolls day that traded two-sided.
Six ways to look at the same question
Session strata. A calendar where each past session is shaded by how far it traveled, marked by its shape and outlined by its day type. Upcoming sessions appear dashed, with the labels the calendar already gives them. Selecting any day opens its description, which is written from the market data itself: the range, where the high and low came, and where the close sat inside the range.
Day-type constellation. A small network of how the labels connect. Clicking a type narrows the whole page to the sessions that carry it.
Pattern playback. This is the part most members will open first. Once a day type is chosen, its sessions that have an intraday path on file are drawn from the open, one line per day, with the median path running through them once more than two have a path. On play, the picture builds from the opening bell to the close. Within a few seconds it shows whether a type tends to make its move early, late or not at all, and how much the individual days disagree.
Analog finder. The member describes the session ahead: its date, the volatility backdrop, where the prior day closed in its range and how wide that range was. The finder scores past sessions on those inputs and on the day types they share, then lays the closest matches over each other.
Imbalance seismograph. The closing imbalances on file, lined up, with quarter-end sessions set apart for comparison.
Road ahead. The sessions coming up that already carry a day type, so the dates worth preparing for are visible weeks ahead.
The rule behind every number
One rule runs through the whole page. Every number on it has a named source, and the page is checked against that source after each refresh. If a value is missing or has not been confirmed, the page says "not on file" and gives the date of the last good value. It does not guess. It does not carry yesterday's number forward, and it does not drop in a default. An empty box means empty.
What it is not
Session Patterns shows how past sessions behaved. It does not predict the next one, and it is not a trade signal. Two days with the same labels can and do finish in different places; the playback makes that spread easy to see, which is part of the point. It is built for preparation: for questioning assumptions about a type of day, and for knowing which dates on the calendar deserve extra attention.
Where to find it
Session Patterns sits in the members dashboard, next to the market briefing, and it is included with every paid membership. A good first session with the page is to run the playback on the day type of the next data release on the calendar, then run the analog finder for the same date and check whether the closest matches agree with the playback.
A tour of each view is on the Session Patterns feature page. New to AlgoIndex? What to expect as a member and the dashboard walkthrough show the rest of the membership. For another look at how ES sessions behave around a known reference point, the expected move break rate study covers that question.
Sources and methodology
Session record. The figures in this article were read from the Session Patterns members data as published after the October 2, 2026 close and recounted on October 4, 2026: 87 ES regular sessions from June 1 through October 2, 2026, which is every NYSE trading day in that window.
Highs, lows and closes. A session's high and low are the highest high and the lowest low of the ES one-minute bars from 9:31 AM to 4:00 PM ET in the AlgoIndex bar archive. The close is the close of the bar ending at 4:00 PM ET. A nightly reconciliation check compares the published values with that archive and holds back the update when the two disagree.
How a session traded. The labels "trended up", "trended down" and "traded two-sided" come from one fixed rule applied to those prices. The rule looks at where the close sat inside the day's range and, when the session's initial balance (the high and low set early in the day) is on file, at how far the full range stretched beyond it. A close in the top quarter of the range counts as trended up and a close in the bottom quarter counts as trended down, except that on a day with the initial balance on file the full range must also be at least one and a quarter times the initial balance. A close in the top or bottom quarter on a day that did not stretch that far counts as two-sided. For every session on file today, any close in the middle half of the range also counts as two-sided. Most sessions on file do not have the initial balance recorded, and for those the close location alone decides the label.
Calendar labels. Release days are taken from the published schedules of the Bureau of Labor Statistics (jobs report, CPI, PPI), the Bureau of Economic Analysis (PCE inflation, GDP) and the Federal Reserve (rate decisions). Expirations, month ends and quarter ends follow the standard exchange calendar, with NYSE holidays removed.
Intraday paths. The playback lines are percent moves from the 9:30 AM ET open, built from five-minute bars of the S&P 500 index ETF (SPY) supplied by a licensed market data feed. They show the shape of each session rather than ES point values.
Closing imbalances. Readings come from the closing auction imbalance figures recorded in the AlgoIndex daily session logs. Readings from before June come from market reviews and are marked on the page as lower confidence.
Missing values. A value without a confirmed source appears as "not on file". Nothing is estimated or carried forward.
Past market behavior is not a guarantee or reliable indicator of future results. Trading futures and options involves substantial risk. Nothing in this article is investment advice.