
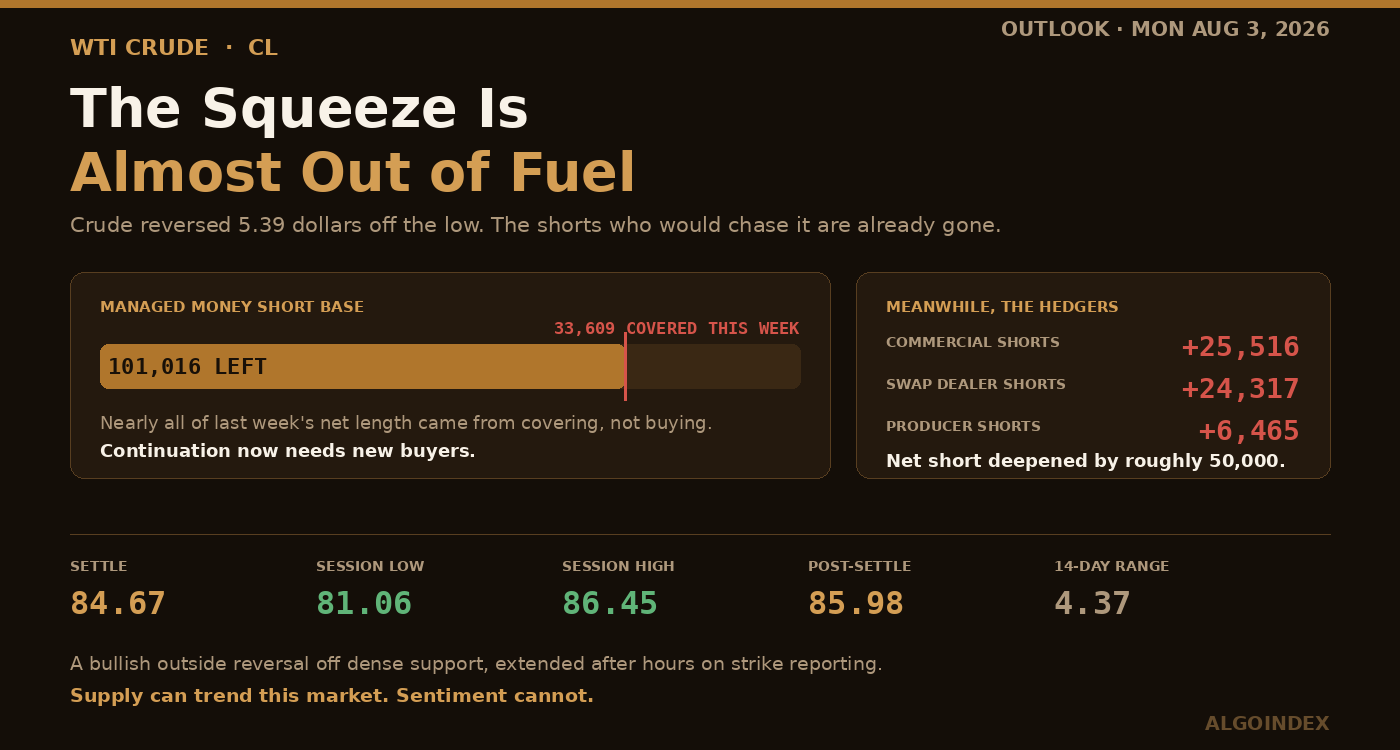
Crude added 1.29 percent Friday and the settlement badly undersells the day. Sold down to 81.06 first. Then a 5.39-dollar reversal up to 86.45. Then, after the bell, a re-bid on reports that strikes against Iranian energy infrastructure are being readied. The catch shows up in the positioning file: the shorts who might have chased this have largely been forced out already.
A reversal that began where it should have
Early tone ran negative. The open sat a third of a dollar over Thursday's close, and price sold from there without interruption down to 81.06.
Where that low landed is the point. Fractionally under the second computed support. Fractionally over an 18-day crossing. Right on the 13-week range midpoint retracement. The decline drove into a thicket of computed support and stopped dead.
Off that failure the contract turned and ran 5.39 dollars, printing 86.45. The high went cleanly past first computed resistance and tagged a second deviation intraday.
Turnover of 232,427 contracts came in under a twenty-day norm around 283,000, a modest caveat on conviction, and it is fair to add that the late headline arrived once most of the day's business had already gone through. Open interest near 266,000 is healthy for a contract expiring in three weeks.
Settling in the upper third but well short of the high, then re-bidding after hours on news, tells you which side had the information.
On the daily chart the shape is a bullish outside reversal: below Thursday's range, above Thursday's close. Patterns like that carry real weight when they appear at a retracement, and this one appeared at exactly that.
The squeeze has nearly spent itself
Here is what should shape Monday, and it comes out of the positioning report rather than the chart.
Across the week to July 28 managed money put on 6,490 longs and took off 33,609 shorts. Net length grew by something like 29,000 contracts, lifting the net long near 92,900. Read the composition, though, and the picture changes. Covering did nearly all of it. Very little came from anyone deciding to buy. Speculators had been positioned wrong for the July recovery and got run out of it.
Which leaves a simple arithmetic problem. Shorts now stand at 101,016 contracts. That source of buying is close to exhausted. Anything further has to come from real new length rather than from trapped positions unwinding.
Meanwhile the hedgers went the other direction with force. Commercials added 25,516 shorts and cut 24,705 longs, taking their net short about 50,000 contracts deeper across the week. Producers piled another 6,465 onto the short book. Swap dealers added 24,317. Selling that hard into strength is what these levels ought to produce, and it lays down a steady supply of overhead offer.
Combine a spent short base with intensifying hedging and you have a market capable of trending on actual lost supply, and poorly equipped to climb on mood.
Supply is deteriorating in several places at once
Physical flows are already impaired, both through the Strait and across the Red Sea. Drones have struck tankers bound for the Caspian consortium terminal, and the consortium only kept running Friday after weighing whether to stop indefinitely. That leaves a percent-scale slice of seaborne supply one decision short of halting.
Abqaiq has been hit again. No other single site concentrates as much oil processing anywhere on earth, and commentary circulating Friday made the case that this may still be underpriced. Saudi ports remain under Houthi blockade, and their leadership said Friday that any sign of Saudi escalation would draw something fiercer.
Onto all of that comes the reported preparation for strikes against Iranian power stations and refineries, which introduces something different in kind. Not disruption of transit, but production and processing capacity deliberately destroyed inside a major producer. It reaches price through two channels: what Iran can export, and what Iran might do to transit through the Strait in response.
Details of the reporting matter here. Power plants and refineries named. Israel notified and coordinating. No end point determined for the campaign. And this developed across a day carrying no fresh direct exchanges between Washington and Tehran, so what the market is pricing is anticipation, not an event.
The asymmetry that produces is severe. Strikes across the weekend and Monday gaps, with everything on the technical map above 87 reduced to a formality. A quiet weekend and part of the premium built into that after-hours rally comes back out on the Sunday evening reopen.
The products are telling a different story
Demand sits on the other side of this and it has gone quietly softer. Twenty-six percent in a month came out of supply risk. Nobody consumed their way there.
The sharpest cross-asset observation Friday was the split inside the complex itself. Crude up, gasoline down. Cracks compressed while the rally ran. Compression like that in a rising crude market means refiners are eating the input-cost increase instead of passing it on, which marks this as a supply-driven move rather than one led by demand.
Sustainable for the barrel. Fragile for the complex. Keep pushing crude up without the products joining and run economics deteriorate, at which point refiners want less crude. That is what naturally caps this sort of advance, and it makes the gasoline and diesel cracks the honesty check on any spike Monday delivers.
The curve is the other read worth having. A front month twenty-six percent above its monthly low on disruption ought to be pulling away from the back, tightening the prompt spread while backwardation steepens. Where that shape develops out of physical disruption rather than financial flow, it is the most dependable confirmation available, because it shows buyers paying up for barrels today instead of speculators bidding paper.
One more relative-strength note from Friday: the dollar firmed, which is a bearish input for energy, and crude rallied through it regardless. The Brent differential near 5.45 dollars runs normal-to-wide, which fits a market dominated by waterborne risk, since Brent expresses seaborne disruption more directly than the domestic benchmark does. July closed higher for equities on the back of technology, so nothing about Friday's crude bid was risk-off. It was supply.
Where Monday gets decided
Directly overhead the 9-day crossing and first computed resistance sit almost on the same number, and the after-hours quote is already through them, so Monday probably resolves that zone before cash even opens. First deviation resistance waits just above as the earliest statistical objection to more upside.
Friday's high is the first genuine structural barrier, with a second deviation a shade over it. Twenty-three cents separate them, and that pairing does one of two things: caps the continuation attempt, or once volume clears it, becomes where the next leg launches from. Above, second computed resistance arrives alongside the 70 percent stochastic threshold, third deviation immediately over. Call that shelf the most credible objective for an ordinary continuation day.
Extended resistance opens at the third computed level. Then a heavy zone collects a multi-average study stall, the 80 percent stochastic threshold and a 40-day crossing stall together. Any spike driven by strikes meets its first serious technical objection there. The monthly high and the annual high sit beyond.
Downward, the pivot shelf settles whether Monday continues or hands it back, gathering the pivot itself with a 13-week retracement and a fast-line stall. Below it the computed target and Thursday's close form what has to hold for the outside reversal to stay intact, with a crossover stall and a four-week retracement just underneath.
First computed support sits in the low 82s, tucked under a 9-day stall and beside the 5-day average. Trade into there and it becomes the earliest real evidence that the late bid was reaction rather than repositioning.
Then the critical band, and everything about it matters because the reversal began inside it. Friday's low, second computed support, a 13-week midpoint retracement, the 18-day crossing and first deviation support all sit together. Lose that and the reversal is void.
Under it, the 80 handle divides recovery from failure. Second deviation support, the momentum midpoint, a four-week retracement and a 61.8 percent retracement measured off the annual low all gather there, reinforced by a 20-day and a 50-day sitting practically on the same number. Beneath, calculated targets step down through a third deviation, third computed support, the 40-day crossing, and a 13-week retracement.
The trade
Long, and taken on a pullback rather than at the open. Friday delivered an outside reversal off dense support, the settlement cleared every major average, the directional reading is expanding with positive over negative, and after-hours extended it on credible supply reporting. Fast oscillators sit mid-range, so momentum has not yet become an argument against.
The zone runs 84.20 up to 84.60, taken where a pullback holds the shelf once ten o'clock data has landed, and it wants a confirmed reclaim if price dips beneath the pivot intraday. Stop at 83.40, under a four-week retracement and under a crossover stall, because trading there for any length of time means the retracement shelf is gone and the reversal has failed.
Objectives climb through Friday's high, then the paired second computed resistance and stochastic threshold, then third computed resistance sitting beneath the heavy band. Entering at 84.40 against that stop, those pay roughly 2.0, 2.7 and 3.8 to one.
Invalidation: a close under the stop, or a break of first computed support that does not immediately reclaim. Give up the low-81 band and the whole reversal thesis is dead and the structure flips. The macro override is specific too. Confirmed reporting that the preparation has been cancelled or de-escalated means leaving longs wherever price sits, because that exact headline is what unwinds the after-hours premium fastest.
The conditional short takes the other branch. It triggers where the Sunday reopen cannot hold the pivot, Monday's cash open turns away from the shelf from below, and no strike headlines arrived. Entry is 83.60 through 84.10, on that failed retest. Stop 84.90, far enough above to survive noise while still respecting the structure. Objectives at first computed support, then the second paired with the 13-week midpoint, then the four-week retracement alongside the converged averages. From 83.85 those run roughly 1.6, 2.7 and 3.7 to one, and a reclaim of first computed resistance on volume ends it.
Four reasons to stand aside. An open more than three dollars above Friday's settlement, which says the strike scenario is live, strips any edge from level-based structures, and and makes chasing it the most dependable way there is to lose money here. An opening range straddling the pivot-to-resistance band that has not resolved by half past ten. Strike headlines arriving live during the session, in which case wait and trade the second-day reaction instead. And price parked in the mid 84s to mid 85s offering no pullback at all, which is the middle of the band and gives no defined risk.
A weekend nobody can trade through
Scheduled American data on Monday is light and none of it moves this contract first. What moves it first is unscheduled, and it is whether those reported strikes happen before Sunday evening. Read the calendar as background and the geopolitical channel as the main event.
Asian and European surveys overnight set the demand tone, and the Chinese print matters most among them because China is the marginal importer. American manufacturing readings arrive mid-morning, and prices paid inside it is the single line joining an oil supply shock to inflation and to rates. Crude feeds that component on a lag, which is the machinery by which this eventually becomes a rates story. Refunding estimates in the afternoon are a dollar item, not a direct crude driver, though they can shift the currency enough to matter at the edges.
Inventories do not print Monday this week. Wednesday brings them, set against a prior figure of 7.167 million barrels drawn, which makes that release the only scheduled first-order item this contract gets all week and leaves Monday running on geopolitics and macro alone.
Everything about the weekend arrives in one print at the reopen, and two branches govern it. With strikes, expect a gap, likely past second computed resistance and possibly reaching for the heavy band on the first impulse, with liquidity thin and spreads wide enough that the opening print is useless as a level. Without them, expect part of the after-hours premium to bleed back toward the pivot shelf through Asian hours, the Chinese data supplying the first demand input. Soft Chinese numbers on a quiet weekend would deepen the give-back and bring Thursday's close into play.
Weighting both, base case is an overnight session that holds firm over 84 across a wide, choppy distribution. Nothing before 09:45, and that rule earns its keep on this particular Monday, because the opening print reacts to forty-eight hours of accumulated news and the first quarter hour will discover liquidity rather than price.
After that the opening range settles the day. Build entirely over first computed resistance and hold it on the retest, and this is a continuation session. Build under the pivot and fail the first reclaim attempt, and it is a give-back. Straddle without resolving, and on a day carrying this much exposure, sitting out is a perfectly respectable answer.
The weighting: 45 percent to continuation off the shelf toward Friday's high and second computed resistance. Twenty-five percent to a gap driven by headlines that extends past third computed resistance and into the heavy band. Thirty percent to the premium unwinding across a quiet weekend, back under Thursday's close toward first computed support and possibly all the way to where the reversal started.
One last note on reading the afternoon. Settle above Friday's high with the after-hours session keeping those gains and Friday's pattern repeats, setting up continuation into Tuesday. Settle back beneath the pivot after an early spike and that is a failed continuation, which returns the weekly bias to neutral. The same weekend sits under gold, where the settlement was struck three hours before the headline and options are charging almost nothing for it, as we covered in our August 3 gold review.
The complete data picture
Every number behind Friday’s plan, charted first; the full numeric reference follows underneath.
Full numeric reference , every remaining figure from the review
| September settlement | 84.67, up 1.08 or 1.29 per cent |
| Session shape | opened 83.92, low 81.06, high 86.45, a 5.39-dollar reversal off the low |
| Thursday's close | 83.59; Friday opened roughly 33 cents above it |
| Post-settlement | extended to 85.90 and 85.98, roughly 2.86 per cent above Thursday's close |
| Headline timing | reporting crossed at 16:53 ET, after the 13:30 CT settlement |
| Volume | 232,427 contracts against a 20-day average of 283,125 |
| Open interest | 265,736, with an August 20 expiration and August 24 first notice |
| Daily pattern | a bullish outside reversal, trading below Thursday's range then closing above its close |
| One month, from the July 2 low | up 26.03 per cent from 67.12 |
| The week | down 5.28 per cent |
| 13-week range | 67.12 to 95.30 |
| One-month range | 67.12 to 93.50 |
| 52-week high | 95.30, sitting 11.24 per cent above spot |
| 52-week low | 55.49, sitting 52.44 per cent below |
| Weekend exposure | 48 hours the market cannot trade, so entry price is a function of what happens while it is closed |
| Crossover-study lag | normal after a 26 per cent move off a low inside a single month, which is why the advance reads young rather than confirmed |
| Position in range | just above the 38.2 per cent retracement of the 13-week range at 84.54, well above the four-week 50 per cent at 80.31 |
| 5-day | 82.90, price 1.77 above |
| 18-day crossing | 81.02 |
| 20-day | 80.04, price 4.63 above |
| 50-day | 80.08, price 4.59 above |
| 100-day | 81.58, price 3.09 above |
| 200-day | 70.88, price 13.79 above |
| Year-to-date | 75.59, price 9.08 above |
| 9-day crossing | 85.32 |
| 9-day stall | 82.48 |
| 40-day crossing stall | 89.42 |
| Convergence | the 20-day and 50-day sit within 4 cents of each other, building a base in the low 80s |
| Relative strength | 9-day 56.31, 14-day 55.95, up 1.32 on the day |
| Momentum thresholds | the 14-day 70 per cent level computes at 100.66, the 50 per cent level at 80.50 |
| Stochastic, 9-day | raw 43.32 per cent, fast 40.92, slow 32.70 |
| Stochastic, 14-day | raw 44.69 per cent, fast 52.62, slow 50.99 |
| Stochastic, 20-day | raw 65.30 per cent, fast 64.49 |
| Stochastic thresholds | the 14-3 day raw reaches 70 per cent at 87.20 and 80 per cent at 89.30 |
| Direction, 9-day | strength 36.71, positive 26.50 against negative 22.28 |
| Direction, 14-day | strength 27.94, positive 27.32 against negative 20.85 |
| Direction, 20-day | strength 20.25 |
| Historic volatility | 70.86 per cent on 9 days against 50.35 per cent on 100 days |
| Composite | 16 per cent positive, strength weak, direction average, trend signal positive |
| Composite internals | short term 40 per cent positive on the 7-day direction reading, the 20-day average against price and the 20-day bands, offset by a negative 20-to-50 crossover; medium term 25 per cent negative with the 50-day average against price positive but the 20-to-100 crossover and 50-day parabolic negative; long term neutral |
| Average true range | 9-day 4.64 (5.48 per cent), 14-day 4.37 (5.16), 20-day 4.21 (4.97), 50-day 3.79 (4.49) |
| Average daily range | 9-day 4.71 (5.57 per cent), 14-day 4.24 (5.01) |
| Friday's range | 5.39 dollars, exceeding even the 9-day measure, the fourth consecutive expansion signature |
| One-range band around the 84.17 pivot | roughly 79.80 to 88.54 |
| Low scenario | 81.50 to 83.00, needing a quiet weekend and disappointing data |
| Mid, most likely | 84.20 to 87.20 |
| High scenario | 88.30 to 91.00, needing confirmed strikes |
| 85.32 / 85.36 | 9-day average crossing; first computed resistance |
| 85.78 | first deviation resistance |
| 86.45 / 86.68 | Friday's high; second deviation, a 23-cent band |
| 87.14 / 87.20 / 87.37 | second computed resistance; where the 14-3 day raw stochastic reaches 70 per cent; third deviation |
| 88.33 | third computed resistance |
| 89.21 / 89.30 / 89.42 | the 3-10-16 day study stall; stochastic 80 per cent; where price crossing the 40-day stalls |
| 93.50 / 95.30 | the one-month high; the 13-week and 52-week high |
| 84.54 / 84.58 / 84.17 | 38.2 per cent off the 13-week high; the 14-day fast-line stall; the pivot point |
| 83.82 / 83.59 | computed target price; Thursday's close |
| 83.27 / 83.42 | the 3-10 day crossover stall; 38.2 per cent off the four-week high |
| 82.39 / 82.48 / 82.90 | first computed support; the 9-day average stall; the 5-day average |
| 81.02 to 81.40 | Friday's low 81.06, second computed support 81.20, 50 per cent of the 13-week range 81.21, the 18-day crossing 81.02, first deviation support 81.40 |
| 80.04 to 80.50 | second deviation support, the 14-day relative strength 50 level at 80.50, 50 per cent of the four-week range at 80.31, 61.8 per cent off the 52-week low at 80.09, the 20-day at 80.04 and 50-day at 80.08 |
| 79.42 / 79.81 | third computed support; third deviation support |
| 77.88 / 78.18 | 38.2 per cent off the 13-week low; where price crosses the 40-day average |
| Managed money longs | up 6,490 to 193,959 |
| Managed money shorts | down 33,609 to 101,016 |
| Managed money net | roughly 92,900, adding roughly 29,000 contracts of net length in the week, almost all from covering |
| Commercial shorts | up 25,516 to 1,030,411 |
| Commercial longs | down 24,705 to 871,589 |
| Commercial net short | deepened by roughly 50,000 contracts |
| Producers | added 6,465 shorts to 296,817 |
| Swap dealers | added 24,317 shorts to 611,072 |
| WTI September | 84.67, up 1.08 or 1.29 per cent |
| Brent | 90.12, up 1.09 or 1.22 per cent; the differential near 5.45 dollars |
| Gasoline August | 3.2216 per gallon, down 0.0171 or 0.55 per cent |
| Diesel August | 4.1215 per gallon |
| Natural gas September | 2.7470 per million British thermal units |
| Strait and Red Sea | physical flows already impaired |
| Caspian consortium | tankers attacked by drones; operations continued Friday only after weighing an indefinite halt, leaving a percent-scale share of seaborne supply one decision from stopping |
| Abqaiq | attacked again; commentary Friday argued the market may still be underpricing it |
| Saudi ports | Houthi blockade in place; leadership warned Friday that Saudi escalation would draw a fiercer campaign |
| The reporting | preparation for United States and Israeli strikes on Iranian power plants and refineries, possibly this weekend, with Israel notified and coordinating and no end point determined |
| Context | no fresh direct exchanges between Washington and Tehran occurred on the day, so the market is pricing anticipation rather than event |
| Sunday 20:30 ET | Japanese manufacturing survey, prior 54.7 |
| Sunday 21:45 ET | Chinese manufacturing survey, expected 52.0 against a prior 51.7 |
| 02:30 ET | Swiss consumer prices |
| 03:50 to 04:30 ET | French, German, eurozone and United Kingdom manufacturing finals |
| 09:45 ET | United States manufacturing survey final, prior 53.8 |
| 10:00 ET | manufacturing survey, expected 54.0 against a prior 53.3 |
| 10:00 ET | prices paid, expected 70.0 against a prior 73.0 |
| 10:00 ET | employment component, prior 49.7; construction spending, expected 0.2 per cent |
| 15:00 ET | Treasury quarterly refunding estimates, full announcement Wednesday |
| Wednesday, August 5, 10:30 ET | weekly crude inventories against a prior draw of 7.167 million barrels |
| Entry | 84.20 to 84.60, on a pullback holding the pivot shelf after the 10:00 ET data, with a confirmed reclaim if price trades below 84.17 intraday |
| Stop | 83.40, below the 83.42 four-week retracement and the 83.27 crossover stall |
| Target 1 | 86.45, Friday's high, roughly 1 to 2.0 |
| Target 2 | 87.14 to 87.20, roughly 1 to 2.7 |
| Target 3 | 88.33, roughly 1 to 3.8 |
| Measured from | an 84.40 entry against an 83.40 stop |
| Invalidation | a close below 83.40, or any break of 82.39 without an immediate reclaim; losing 81.20 flips the structure |
| Macro override | exit longs on confirmed reporting that strike preparation has been called off or de-escalated |
| Trigger | the Sunday reopen fails to hold 84.17 and Monday's cash open rejects the 84.17 to 84.58 shelf from beneath, with no strike headlines |
| Entry | 83.60 to 84.10 on the failed retest |
| Stop | 84.90 |
| Target 1 | 82.39, roughly 1 to 1.6 |
| Target 2 | 81.20, roughly 1 to 2.7 |
| Target 3 | 80.31 to 80.50, roughly 1 to 3.7 |
| Measured from | an 83.85 entry |
| Invalidation | any reclaim of 85.36 on volume |
| Path A, 45 per cent | continuation from the pivot shelf toward 86.45 and 87.14 |
| Path B, 25 per cent | a headline-driven gap and extension above 88.33 toward the 89.21 to 89.42 band |
| Path C, 30 per cent | premium unwind on a quiet weekend, back through 83.59 toward 82.39 and potentially the 81.06 to 81.21 base |
| Reopen, with strikes | a gap likely through 87.14 and potentially toward 89.21 to 89.42 on the first impulse, with poor liquidity and wide spreads |
| Reopen, without strikes | partial unwind toward the 84.17 to 84.54 shelf through Asian hours; a soft Chinese print would put 83.59 in play |
| Opening range | entirely above 85.36 and held on the retest is continuation; below 84.17 with no first-attempt reclaim is give-back; straddling 84.17 to 85.36 is the stand-aside case |
| Skip | an open more than 3 dollars above Friday's settlement; an opening range straddling 84.17 to 85.36 unresolved by 10:30 ET; strike headlines arriving live during the session; price between 84.60 and 85.30 with no pullback offered |
| Standing rules | no entries before 09:45 ET or after 16:00 ET |
Related reading: The Day Trading Mistakes That Actually Cost You Money, our research piece on what the studies actually measured about overtrading and retail losses.



