
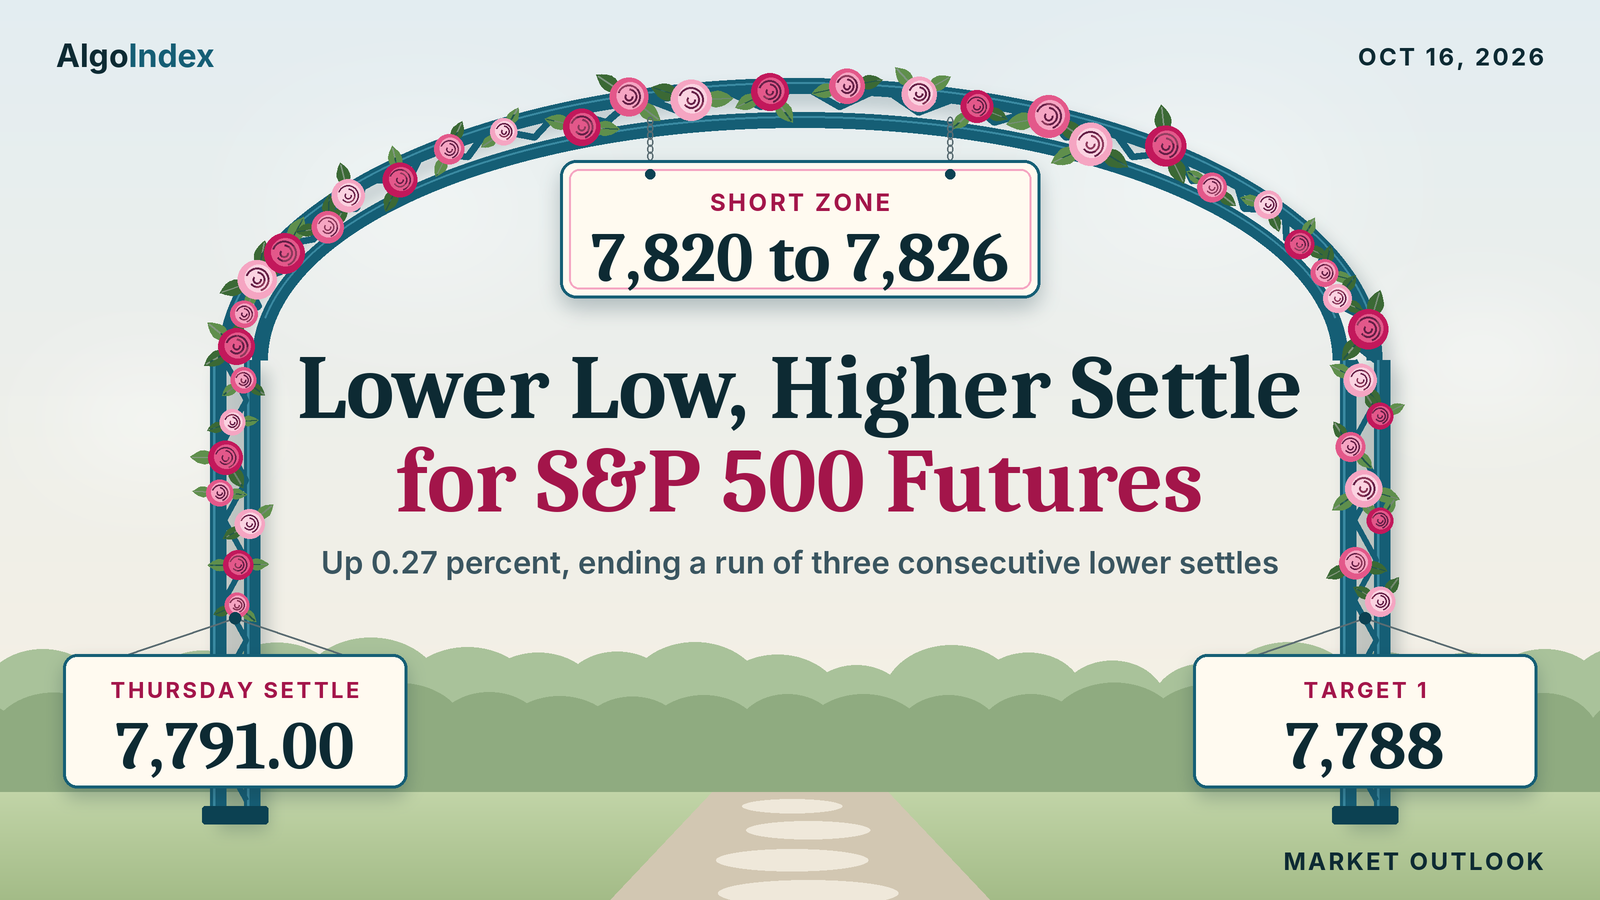
At 6:34 PM ET on Thursday the December S&P 500 contract was quoted at 7,791.75, 0.75 points above the settle. Globex had reopened at 6:00 PM ET, and the provider's display showed a new-session open of 7,788.75, a high of 7,794.00 and a low of 7,786.25. Friday's short zone, 7,820 to 7,826, sits 28.25 points above that quote. The band sits above the market.
Thursday broke a three-session slide. December E-mini futures settled at 7,791.00, up 20.75 points or 0.27 percent, after a 7,717.25 to 7,801.75 session. Lower high, lower low, higher settle. The 7,717.25 low was the lowest since the 7,672.75 low of 10/01, and the settle finished at 87.3 percent of the 84.50 point range. The cash index closed at 7,744.06, up 0.33 percent. The Dow industrials rose 1.08 percent while the Nasdaq-100 cash index slipped 0.05 percent and the semiconductor index fell 0.88 percent.
December S&P 500 futures settled at 7,791.00. That sits 21.00 points above the 7,770.00 Pivot Point and beneath the 5-day, 9-day and 20-day settlement averages, while the 50-day at 7,778.70, the 100-day at 7,693.17 and the 200-day at 7,394.26 sit beneath it. The primary setup is a short from 7,820 to 7,826 around Pivot R1 at 7,822.75, beneath the 5-day settlement average at 7,826.95, stop 7,858 above Pivot R2 at 7,854.50, targets 7,788, 7,753 and an extended 7,718. The band sits above the market. The settle sat 29.00 points beneath the band bottom and the 6:34 PM ET quote 28.25 beneath it. Per the desk note, the cash close sits 15.94 points beneath the 7,760 modeled volatility threshold (ES pair 7,807.55) and 12.06 above the 7,732 modeled gamma-flip level (ES pair 7,779.55), with gamma tilt at 0.923 and dealer gamma negative in aggregate in the note's own measure. Import prices print at 8:30 AM ET and industrial production at 9:15 AM ET on Friday, as the calendar lists them, and in the review's judgment import prices are the first-order scheduled input.
Thursday's 7,801.75 high reached 4.75 points into the short band
In Thursday’s outlook we set a short from 7,797 to 7,803. Its stop sat at 7,826, with targets at 7,774, 7,748 and an extended 7,722. Thursday's completed bar, from the review and the dated 2026-10-15 row, opened at 7,768.25 at the Wednesday 6:00 PM ET reopen, marked a high of 7,801.75 and a low of 7,717.25, and settled at 7,791.00. The band traded. The high went 4.75 points into it, 1.25 short of the 7,803 top and 24.25 beneath the 7,826 stop. No fill and no result is asserted.
The 30-minute bars fix the order. The session opened at 7,768.25, already 5.75 points beneath the first target, and the first bar traded down to 7,751.50. The 6:30 PM ET bar traded down to 7,745.25, through the second target. The extended target came in the 9:30 AM ET bar, which set the session low of 7,717.25, 4.75 points beneath 7,722. All three printed before the band traded. Those prints carry no result.
The rally came late. Before 3:00 PM ET the contract never traded above 7,792.25, the 1:30 PM ET bar's high, 4.75 points under the band. The 3:00 PM ET bar opened at its 7,779.25 low, set the session high of 7,801.75 and closed at 7,793.75. The 3:30 PM ET bar reached 7,799.50, inside the band, and closed at 7,790.75. After the 3:00 PM ET bar, through the 4:30 PM ET bar, the contract never traded beneath 7,783.00. That is 9.00 points above the first target.
The card's other lines held. The invalidation was a settle above two standard deviations resistance at 7,825.35, and the 7,791.00 settle finished 34.35 points beneath it. Acceptance above the band needed two consecutive 30-minute closes above 7,803. The session's highest close was 7,793.75, in the 3:00 PM ET bar, 9.25 points beneath that line. The 7,826 stop never traded.
Our ranges mostly held. The most likely band of 7,715 to 7,825 held both ends, with the low 2.25 points above its bottom and the high 23.25 under its top. The high-range case of 7,696 to 7,845 held with 21.25 points to spare beneath. The low-range case of 7,731 to 7,809 held the high by 7.25 and missed the low by 13.75. Overnight was the miss. Through the 2:30 AM ET bar the contract reached 7,729.50, 5.50 points beneath the 7,735 bottom of the Globex band. London stayed inside 7,730 to 7,805, between 7,730.50 and 7,755.75. The morning band of 7,715 to 7,826 held the 7,717.25 low by 2.25, and the afternoon band of 7,700 to 7,840 held the 7,801.75 high.
The weighted path held. Thursday's outlook expected a hold between two standard deviations support at 7,715.15 and two standard deviations resistance at 7,825.35. The low stayed 2.10 points above the first and the high 23.60 beneath the second. It weighted a rally that stalls beneath the 7,823.4 threshold pair, and the high stopped 21.65 points under it. The named alternative was a soft producer-price print that carries the contract back above that pair toward Pivot R1 at 7,853.00. Per the news feed, producer prices printed 1.3 percent for the month against a 0.6 percent forecast. The contract never traded above 7,823.4. We grade the card as written.
Pivot R1 at 7,822.75, the 7,820 to 7,826 band and the 7,858 stop
The basis narrowed. Thursday's 7,791.00 settle less the 7,744.06 cash close measures 46.94 points, against 51.31 on Wednesday, and every cash equivalent in this article uses the new figure. The desk note keeps its own 47.55 point offset, so its published futures pairs differ: 8,047.55 for the 8,000 gamma concentration, 7,947.55 for the 7,900 call-side ceiling, 7,807.55 for the 7,760 modeled volatility threshold, 7,779.55 for the 7,732 modeled gamma-flip level and 7,697.55 for the 7,650 put-side base.
Resistance starts 5.03 points up. The 20-day settlement average at 7,796.03 sits there, with the 18-day average crossing price at 7,796.63 and Thursday's 7,801.75 high (cash 7,754.81) just above it. The 7,807.55 threshold pair (cash 7,760) follows. Then the band's group. Pivot R1 at 7,822.75 (cash 7,775.81) sits 2.75 points above the band bottom, and the 5-day settlement average at 7,826.95 sits 0.95 above the band top. One standard deviation resistance at 7,833.94 (cash 7,787.00) and the 9-day average crossing price at 7,834.72 follow, with the 9-day average at 7,833.78 just beneath them.
The stop's group sits next. Two standard deviations resistance at 7,851.73 (cash 7,804.79) and Pivot R2 at 7,854.50 (cash 7,807.56) lie 2.77 points apart. The 7,858 stop sits 6.27 above the first and 3.50 above the second. Last Friday's 7,859.75 settle (cash 7,812.81) and the 7,861.48 top of the one-range frame sit just above it. Three standard deviations resistance at 7,865.38 (cash 7,818.44), Wednesday's 7,879.75 high (cash 7,832.81) and this week's 7,887.00 high come next. The 52-week and 13-week high of 7,905.00 sits 114.00 points above the settle, with last week's 7,897.50 high beneath it and Pivot R3 at 7,907.25 above it. The 7,947.55 ceiling pair (cash 7,900) and the 8,047.55 concentration pair (cash 8,000) are the extended references.
Support starts close too. The 7,779.55 flip pair (cash 7,732) sits 11.45 points beneath the settle, with the 50-day settlement average at 7,778.70 under it. The 38.2 percent retracement from the four-week high at 7,774.30, Wednesday's 7,770.25 settle and the Pivot Point at 7,770.00 (cash 7,723.06) span 4.30 points. Thursday's 7,768.25 open and the 40-day average crossing price at 7,766.33 sit under them. The published target price at 7,759.75 (cash 7,712.81), the 3-10 day crossover stall level at 7,755.43 and one standard deviation support at 7,748.06 (cash 7,701.12) follow. Wednesday's 7,741.00 low, Pivot S1 at 7,738.25 (cash 7,691.31) and the 50 percent retracement at 7,736.25 span 4.75 points. Two standard deviations support at 7,730.27 (cash 7,683.33) and the 7,720.52 bottom of the one-range frame come next. A tight pair follows. Thursday's 7,717.25 low (cash 7,670.31) and three standard deviations support at 7,716.62 lie 0.63 points apart.
The deeper supports stack up. The 38.2 percent retracement from the 13-week high at 7,706.74, the 38.2 percent retracement from the four-week low at 7,698.19, the 7,697.55 put-side pair (cash 7,650) and the 100-day average at 7,693.17 span 13.57 points. Then the deep references. Pivot S2 at 7,685.50 (cash 7,638.56), the 7,672.75 low of 10/01 and Pivot S3 at 7,653.75 (cash 7,606.81) lead them. The 7,575.00 one-month low, 216.00 points beneath the settle, the 200-day average at 7,394.26 and the 13-week low of 7,386.00 complete the list.
Three averages sit above the settle. The 5-day stands 35.95 points over it, the 9-day 42.78 and the 20-day 5.03. The 50-day sits 12.31 beneath, the 100-day 97.83 and the 200-day 396.74. The 5-day fell 5.05 points from Wednesday's 7,832.00 as the 10/08 settle of 7,816.25 left the window and 7,791.00 replaced it. The 20-day rose 4.19 from 7,791.84, because the 09/17 settle of 7,707.25 left that window, and the 50-day fell 0.55 from 7,779.24. The 20-day still sits above the 50-day. The 30 older settlements in the 50-day window averaged 7,767.14, less than the latest 20. The 50 older settlements in the 100-day window averaged 7,607.65, which keeps the 50-day above the 100-day. For Friday the averages would be crossed at 7,834.72 for the 9-day, 7,796.63 for the 18-day and 7,766.33 for the 40-day.
Momentum sits mid-range. Relative strength reads 48.57 on the 9-day, 50.68 on the 14-day and 51.60 on the 20-day. The raw stochastic reads 41.61 percent on the 9-day and 53.17 percent on the 14-day. The smoothed 14-day %K at 49.72 percent sits beneath %D at 59.31 percent, near the middle of the range. Negative direction leads on both windows. On the 9-day it reads 28.14 against 15.00 with the ADX at 18.28; on the 14-day, 25.85 against 16.89 with the ADX at 12.10. Both ADX readings describe a weak trend. Historic volatility reads 7.87 percent on the 9-day and 7.55 percent on the 14-day. These readings come from the provider's page for the Friday session, read after the 6:00 PM ET reopen. That page can substitute the live Globex price for the settle.
The composite multi-indicator read held at 16 percent buy, unchanged from the prior session's snapshot, with strength described as minimum and direction as weakest. It read 64 percent buy a week ago and 40 percent sell a month ago. The short-horizon group averages 40 percent sell. The medium-horizon group reads 25 percent buy and the long-horizon group 67 percent buy, and the composite trend indicator reads buy.
Ranges stayed wide. The 14-day average true range stands at 70.48 points, 0.90 percent of the settle, and the 14-day average daily range at 69.27. The 9-day figures are 67.79 and 62.83 and the 20-day figures 72.46 and 72.26. Thursday's 84.50 point range was 1.22 times the 14-day average daily range. One average true range either side of the settle frames Friday between 7,720.52 and 7,861.48. The deviation bands are tighter. They run 7,748.06 to 7,833.94 at one deviation, 7,730.27 to 7,851.73 at two and 7,716.62 to 7,865.38 at three. Built from five settlements, they describe settlement dispersion only. The desk note's implied one-day move of 0.50 percent equals about 38.72 points on the 7,744.06 cash close.
Zoom out. Daily ranges over the last eight sessions ran 68.50, 68.75, 75.25, 53.50, 40.75, 29.50, 138.75 and 84.50 points. Settlement changes over the same stretch read plus 47.75, minus 21.25, minus 36.50, plus 43.50, minus 1.75, minus 2.25, minus 85.50 and plus 20.75. The 7,801.75 high sits 78.00 points beneath Wednesday's 7,879.75, and the 7,717.25 low 23.75 beneath Wednesday's 7,741.00. The bar left an upper shadow of 10.75 points above the settle and a lower shadow of 51.00 beneath the 7,768.25 open. Now the week. Last week, October 5 through October 9, spanned 7,897.50 to 7,760.25, and this week through Thursday has spanned 7,887.00 to 7,717.25. The contract sits 68.75 points beneath last Friday's 7,859.75 settle and 25.25 beneath the 7,816.25 settle of 10/08, five sessions back. No four-hour series and no prior-quarter extremes were captured. Swing structure rests on daily bars and the 30-minute session, with the 13-week high of 7,905.00 and low of 7,386.00 as the quarterly reference.
Hot producer prices, lower yields and a recovery outside technology
September producer prices printed at 8:30 AM ET, as the calendar listed them. The news feed showed 1.3 percent for the month against a 0.6 percent forecast and 6.3 percent for the year against 5.4 percent. Core ran hot too. Per the news feed, core producer prices rose 0.7 percent against 0.3 percent and annual core 5.0 percent against 4.4 percent. Retail sales beat as well. Retail sales rose 0.8 percent against 0.3 percent and the core measure 0.9 percent against 0.5 percent, per the news feed. The release fell inside the 8:30 AM ET bar, which opened at 7,751.50, traded down to 7,728.75 and closed at 7,745.50. The bars record the timing. They record no cause.
More data came with it. The news feed carried initial jobless claims at 199 thousand against 200 thousand, the Philadelphia manufacturing survey at 20.9 against 28 and the New York survey at 25.5 against 12. The 9:00 AM ET bar closed at 7,735.50, and the 9:30 AM ET bar traded between 7,717.25 and 7,747.75 and closed at 7,727.75. Then the turn. The 10:30 AM ET bar closed at 7,769.00, the 11:00 AM ET bar reached 7,785.50 and the 2:00 PM ET bar closed at 7,768.50. The 3:00 PM ET bar marked the 7,801.75 high and closed at 7,793.75.
Yields eased. The ten-year yield index traded between 5.04 and 5.11 percent and closed at 5.09 percent against 5.19 percent on Wednesday. The dollar index closed at 102.00, down 0.55. A feed headline at 12:00 PM ET said the hot producer-price data failed to revive rate-increase bets. The feed's 9:19 AM ET sentiment item described hot inflation alongside a drop in yields and stronger haven demand.
Policy talk ran around the clock. At 4:16 AM ET the feed carried investment-bank commentary expecting a third Federal Reserve increase in March 2027. After the close, the feed carried a regional Federal Reserve president's remarks at 4:46 PM ET and 4:48 PM ET. The next policy decision is listed for October 28, 2026, per the news-feed calendar and unconfirmed.
Chips started weak. The feed's Europe and Asia wraps described a deepening selloff in artificial-intelligence and chip shares overnight. The Taiwanese chipmaker reported at 2:00 AM ET, as the calendar listed it, and the feed's 4:18 AM ET Europe sentiment item cited its earnings as a positive. More followed at 11:10 AM ET. The feed carried the leading graphics-chip maker's chief executive saying a cloud-computing provider does not require financial backing from the chipmaker. The US market wrap carried by the feed described stocks recovering as investors reassessed concerns about the sustainability of the artificial-intelligence boom. Per the feed, a brokerage firm reported adjusted earnings of 1.69 dollars a share against an estimate of 1.65. After the close, at 4:57 PM ET, the feed carried sources saying some investors dialed back valuation expectations for an artificial-intelligence developer after disappointing results.
The gains came from outside technology. The Dow industrials closed at 52,177.69, up 1.08 percent, and the NYSE composite at 24,066.65, up 0.84 percent. The S&P 500 cash index gained 0.33 percent. The Nasdaq-100 cash index slipped 0.05 percent, and the semiconductor index fell 0.88 percent and closed 409.69 points above its 11,171.53 low. In the review's interpretation the gains came from outside technology, with chip shares recovering from their lows without turning positive. No sector-level breadth series was captured, so the rotation is inferred from the index closes only.
Security headlines arrived in the afternoon. At 1:14 PM ET the news feed carried a US statement that a civilian vessel was hit by a projectile from Iran's revolutionary guard and that a civilian container vessel sank while being towed to shore. Two more followed at 4:43 PM ET and 4:44 PM ET. The news feed carried Pentagon statements on a rebalancing of the NATO alliance and a shift of focus toward the Pacific. These are statements carried by the news feed rather than events confirmed for this review, and no causal link to the index is asserted. November WTI crude settled at 97.97, up 3.03 percent, after a larger-than-expected official crude draw.
Implied volatility eased. The volatility index closed at 16.46 against 16.87 after trading as high as 18.01. The Nasdaq-100 volatility index closed at 22.89 against 22.70 and the volatility-of-volatility index at 92.57 against 94.45. Gold rose 1.51 percent. At 10:17 AM ET the feed carried a sentiment gauge reading of 23 out of 100, described as extreme fear. At 3:38 PM ET it carried money market fund assets of 7.92 trillion dollars, down 40.46 billion for the week.
The cash close sits between the model lines. The desk note used is the 5:28 PM ET edition for Thursday, read at 9:05 PM ET, and its reference prices are Wednesday's closes. The note's 7,718 index reference equals Wednesday's 7,718.94 cash close, and its 29,950 Nasdaq-100 reference equals 29,950.82. The note's narrative states a close of 7,744, up 0.3 percent, 0.06 beneath the provider's 7,744.06, and this article uses the provider's figure. Now the distances. Against that close, the index sits 15.94 points beneath the 7,760 modeled volatility threshold (ES pair 7,807.55) and 12.06 above the 7,732 modeled gamma-flip level (ES pair 7,779.55). It sits 155.94 beneath the 7,900 call-side ceiling (ES pair 7,947.55) and 94.06 above the 7,650 put-side base (ES pair 7,697.55). Then the gamma. Per the desk note, gamma tilt reads 0.923 and gamma notional minus 280.586 million dollars, so the note's aggregate dealer gamma is negative, against plus 996.435 million dollars in its Wednesday edition. The modeled threshold and flip level are model outputs; neither is an option strike.
The note draws its own map. Its summary lists resistance at 7,750 and 7,800, support at 7,650, 7,600 and 7,450 and a desk pivot at 7,690, with key strikes at 8,000, 7,700, 7,000 and 7,800, all in cash. Then the narrative. The note's narrative said the S&P 500 rebounded 110 basis points from its session low after testing and reclaiming the 7,690 desk pivot. Per the narrative, the long-bond fund rallied 1.4 percent and the equal-weighted index fund rose 1.4 percent, and healthcare and software led with gains of about 2 percent. Two gamma details stand out. The note described an 18 thousand lot same-day put sale at the 7,575 strike that added positive gamma near that strike. The note also described a pocket of negative local gamma near 7,750 that it said made the market less stable there. Then the flows. Per the desk note, index options flow ended roughly flat after swinging between plus 2 billion and minus 10 billion dollars of cumulative delta. Per the desk note, single-stock flow ran about plus 3 billion dollars, led by put selling and call buying in artificial-intelligence names. Per the desk note, fixed-strike implied volatility fell 1 to 1.5 vol points on the day.
The note's implied one-day move is 0.50 percent, about 38.72 points on the 7,744.06 close, and its implied five-day move 1.22 percent. That is about 94.48 points. The note states at-the-money implied volatility of 13.5 percent for Friday and an expected one-day move of about 84 basis points, or about 65 points on the close. Its published implied one-day high and low of 7,727.8 and 7,650.9 are not symmetric around either the reference or the close, so that pair is excluded. The console adds detail. A positioning console for the cash index, stamped 2026-10-15 and read at about 9:06 PM ET, shows call gamma of 5.73 billion against put gamma of minus 3.35 billion. The console puts one-month implied volatility at 13.10 percent against realised volatility of 10.28 percent, the implied-volatility rank at 17.79 percent and the put-to-call open-interest ratio at 1.38. A second console follows. A console for the S&P 500 exchange-traded fund shows call gamma of 79.24 million against put gamma of minus 6.78 billion and a put-to-call open-interest ratio of 1.92.
Two gamma measures appear here. The desk note's aggregate figure and the consoles' call and put gamma come from different models and timestamps. They are not reconciled here, and neither is netted against the other. In the review's interpretation, a cash close between the flip level and the modeled volatility threshold, with the desk note's aggregate gamma turning negative, describes an environment where dealer hedging is less likely to dampen moves and where monthly expiration can release positioning on Friday. The desk note lists Friday as monthly options expiration, per the positioning note and unconfirmed.
Volume eased. Thursday's December volume was 1,837,353 contracts on the 2026-10-15 row, against Wednesday's 2,063,500 on the revised 2026-10-14 row. That revised figure replaces the 1,976,201 carried in Thursday's outlook, a difference of 87,299. Wednesday's open interest now reads 1,920,481 on that row, up from 1,915,573 on the 2026-10-13 row. Thursday's open interest had not been reported when the review was written. No weekly positioning report was captured.
The trade map for Friday
The primary setup is a short from 7,820 to 7,826. Thursday printed a lower high and a lower low against Wednesday, and the settle sits beneath the 5-day, 9-day and 20-day settlement averages. Negative direction leads on the 9-day and 14-day directional systems, and the composite reads 16 percent buy with direction described as weakest. Now the band. It holds Pivot R1 at 7,822.75, 2.75 points above its bottom, and its top sits 0.95 beneath the 5-day settlement average at 7,826.95. Its bottom sits 12.45 points above 7,807.55, the desk note's pair for the modeled volatility threshold. The stop sits at 7,858, above Pivot R2 at 7,854.50 and two standard deviations resistance at 7,851.73. Targets step down. The first, 7,788, sits 3.00 beneath Thursday's 7,791.00 settle; the second, 7,753, sits 2.43 beneath the 3-10 day crossover stall level at 7,755.43; and the extended 7,718 sits 0.75 above Thursday's 7,717.25 low. The evidence against is plain. The settle finished at 87.3 percent of the range with a higher settle, and it sits above the 50-day average. The review calls the setup an analyst judgment that rallies stall beneath the 5-day average. No measured edge stands behind it.
Now the arithmetic. From the 7,823 midpoint the risk to the stop is 35 points, 49.7 percent of the 14-day average true range of 70.48. The targets sit 35, 70 and 105 points beneath the midpoint. Exact multiples. The settle sat 29.00 points beneath the band bottom and 35.00 beneath its top. The 6:34 PM ET quote of 7,791.75 sits 28.25 beneath the bottom, and the new session's displayed high, 7,794.00, stayed 26.00 points under the band. A one-range frame from the settle, 7,720.52 to 7,861.48, holds the band, the stop and the first two targets. One detail stands out. The extended 7,718 sits 2.52 points beneath the frame's bottom, and the new session's displayed low of 7,786.25 sat 1.75 beneath the first target.
The session bands are the review's analyst judgment. Through Globex the review expects roughly 7,765 to 7,815 absent a headline shock, with a neutral bias beneath Pivot R1 at 7,822.75. London runs 7,750 to 7,825 with a neutral to lower bias beneath the 5-day settlement average. There the review names the 7,820 to 7,826 band the first meaningful resistance and the Pivot Point at 7,770.00 the first meaningful support. The morning band runs 7,748 to 7,834 and the afternoon band 7,730 to 7,852. The desk note's implied one-day move of about 38.72 index points and its expected move of about 65 points frame the day. The scenario ranges run 7,765 to 7,815 for the low-range case, 7,748 to 7,834 for the most likely and 7,720 to 7,862 for the high-range case.
Friday's calendar starts overnight. A Federal Reserve bank president spoke at 4:30 PM ET on Thursday, per the news-feed calendar and unconfirmed. The Bank of England governor is listed at 10:00 PM ET and a European Central Bank board member at 10:30 PM ET, both per the news-feed calendar and unconfirmed. The Federal Reserve Chair's discussion with the International Monetary Fund's managing director is scheduled at 11:30 PM ET, as the calendar lists it. Then Friday. The Bank of Canada governor is listed at 12:15 AM ET and final euro-area consumer prices at 5:00 AM ET on Friday, both per the news-feed calendar and unconfirmed. Then the main event. Import prices for September print at 8:30 AM ET and industrial production at 9:15 AM ET, before the 9:30 AM ET cash open, as the calendar lists them. The cash session closes at 4:00 PM ET.
The weekend follows. The desk note lists Friday as monthly options expiration, per the positioning note and unconfirmed. A Friday close carries two days of headline exposure into the Sunday reopen at 6:00 PM ET on October 18, 2026. The weekend gap references are Pivot R1 at 7,822.75 above and Pivot S1 at 7,738.25 beneath. A streaming-video company reports at 4:01 PM ET on Tuesday, October 20, 2026, as the calendar lists it. The next policy statement is listed for 2:00 PM ET on October 28, 2026, per the news-feed calendar and unconfirmed. In the review's judgment the first-order scheduled input on Friday is import prices at 8:30 AM ET, with the Federal Reserve Chair's overnight discussion the other scheduled policy input.
One path is weighted. In this review's analyst judgment the most probable path holds the contract between one standard deviation support at 7,748.06 and one standard deviation resistance at 7,833.94, with long-end yields and artificial-intelligence headlines deciding the side. In the same judgment, a rally toward Pivot R1 at 7,822.75 that stalls beneath the 5-day settlement average at 7,826.95 is weighted above a sustained break higher. It rests on judgment. The review weighs it that way because of Thursday's lower high and lower low and the settle beneath the 5-day, 9-day and 20-day averages. Negative direction leads on both directional systems, and the composite reads 16 percent buy. One alternative is named. The alternative that would invalidate the reading is a continuation of Thursday's afternoon recovery that carries the contract through Pivot R2 at 7,854.50, which would put Wednesday's 7,879.75 high in play. The review names the counterweights. The settle at 87.3 percent of the range, the higher settle and the strength in the Dow industrials are the evidence against the short reading.
Thursday's 7,801.75 high stopped 1.25 points under the old band's top; Friday's card asks the 7,820 to 7,826 band, 18.25 points above that high, to cap a rally.
The complete data picture
Every number behind Friday’s plan, charted first, then the full level lists, then the complete numeric reference underneath.
Full numeric reference, every remaining figure from the session review
1. Executive Summary
The December S&P 500 contract settled at 7,791.00 on Thursday, up 20.75 or 0.27 percent from Wednesday's settle of 7,770.25, after trading between 7,801.75 and 7,717.25, an 84.50 point daily range. The settle finished at 87.3 percent of the range, and the 84.50 point range was 1.22 times the published 14-day average daily range of 69.27 points. Thursday printed a lower high and a lower low against Wednesday but a higher settle, ending a run of three consecutive lower settles. The 7,717.25 low was the lowest since the 7,672.75 low of 10/01.
Producer prices for September printed at 8:30 AM ET, as the calendar listed them, with the news feed showing 1.3 percent for the month against a 0.6 percent forecast and 6.3 percent for the year against 5.4 percent, while retail sales rose 0.8 percent against 0.3 percent. In the 30-minute bars the 8:30 AM ET bar traded down to 7,728.75 and closed at 7,745.50, the session low printed in the 9:30 AM ET bar and the session high in the 3:00 PM ET bar.
The S&P 500 cash index closed at 7,744.06, up 25.12 or 0.33 percent, after trading between 7,669.66 and 7,754.15. The Dow industrials rose 1.08 percent and the NYSE composite 0.84 percent while the Nasdaq-100 cash index slipped 0.05 percent and the semiconductor index fell 0.88 percent, so breadth outside technology led the recovery. The ten-year yield index closed at 5.09 percent against 5.19 percent, the dollar index at 102.00, down 0.55, and the volatility index at 16.46 against 16.87.
The Friday session carries import prices at 8:30 AM ET and industrial production at 9:15 AM ET, both as the calendar lists them. The published 14-day average true range of 70.48 points is 0.90 percent of the settle. The measured closing basis was 46.94 points, the December settlement less the cash close. The desk note places the cash close 15.94 points beneath the modeled volatility threshold at SPX 7,760 and 12.06 points above the modeled gamma-flip level at SPX 7,732, with the desk note's aggregate dealer gamma negative (section 5). The primary setup is a short from the 7,820 to 7,826 band around Pivot R1 at 7,822.75, stopped at 7,858 above Pivot R2 at 7,854.50, with objectives at 7,788, 7,753 and an extended 7,718.
2. Price Action & Technical Structure
2.1 Intraday and Session Review
The Thursday session opened at 7,768.25 at the Wednesday 6:00 PM ET reopen, 2.00 below Wednesday's settle, marked a daily high of 7,801.75 and a daily low of 7,717.25, and settled at 7,791.00. The 30-minute bars for the session place the session low of 7,717.25 in the 9:30 AM ET bar and the session high of 7,801.75 in the 3:00 PM ET bar.
Overnight, the 11:00 PM ET bar on Wednesday traded down to 7,729.75 and the 7:30 AM ET bar closed at 7,744.00. The 8:30 AM ET bar, which contains the producer price and retail sales releases, opened at 7,751.50, traded down to 7,728.75 and closed at 7,745.50, and the 9:00 AM ET bar closed at 7,735.50. The 9:30 AM ET bar traded between 7,717.25 and 7,747.75 and closed at 7,727.75.
The recovery then built through the session: the 10:30 AM ET bar closed at 7,769.00, the 11:00 AM ET bar reached 7,785.50, the 2:00 PM ET bar closed at 7,768.50, and the 3:00 PM ET bar marked the session high of 7,801.75 and closed at 7,793.75. After the settle, the chart's 4:30 PM ET bar closed at 7,786.00; that post-settlement quote is not used as the settlement anywhere in this review.
Globex reopened at 6:00 PM ET, so the provider's displayed day open, high and low of 7,788.75, 7,794.00 and 7,786.25 belong to the new session dated Friday, not to Thursday, and are not used as Thursday's range.
The session extremes used here are the completed-session inputs behind the published pivot ladder rather than an independently read bar, back-solved from the outer pivot pairs and verified against every rung. Pivot R3 at 7,907.25 minus Pivot S3 at 7,653.75, divided by three, returns 84.50, and Pivot R2 at 7,854.50 minus Pivot S2 at 7,685.50, divided by two, returns the same 84.50. Three times the Pivot Point of 7,770.00 less the 7,791.00 settle gives a high plus low sum of 15,519.00, which the pair of 7,801.75 and 7,717.25 reproduces, and that pair reproduces all seven published rungs.
Independent corroboration: the provider's settlement row, the chart's completed Thursday daily bar and the extremes of the 30-minute bars carry the same 7,801.75 high and 7,717.25 low.
2.2 Daily Structure
Thursday printed a lower high and a lower low against Wednesday: the 7,801.75 high sits 78.00 beneath Wednesday's 7,879.75, and the 7,717.25 low sits 23.75 beneath Wednesday's 7,741.00. The settle at 87.3 percent of the range leaves an upper shadow of 10.75 above the settle and a lower shadow of 51.00 beneath the 7,768.25 open on the daily bar.
The sequence of session highs over the last six sessions reads 7,858.25, 7,870.50, 7,887.00, 7,864.00, 7,879.75 and 7,801.75, and the sequence of session lows reads 7,783.00, 7,817.00, 7,846.25, 7,834.50, 7,741.00 and 7,717.25. Settlements over the same six sessions ran 7,816.25, 7,859.75, 7,858.00, 7,855.75, 7,770.25 and 7,791.00.
Last week, October 5 through October 9, spanned 7,897.50 to 7,760.25, and this week through Thursday has spanned 7,887.00 to 7,717.25, with the contract 68.75 beneath last Friday's 7,859.75 settle. The 52-week and 13-week high of 7,905.00 sits 114.00 above the settle, and the one-month low of 7,575.00 sits 216.00 beneath it. Over five sessions the contract fell 25.25 points from the 7,816.25 settle of 10/08, matching the provider's five-day change of minus 25.25.
No prior-quarter high or low was captured for this session, so the 13-week extremes serve as the available quarterly reference: 7,905.00 above and 7,386.00 beneath.
2.3 4-Hour and Swing Structure
Daily ranges for the last eight sessions ran 68.50, 68.75, 75.25, 53.50, 40.75, 29.50, 138.75 and 84.50. The settlement changes over the same eight sessions read plus 47.75, minus 21.25, minus 36.50, plus 43.50, minus 1.75, minus 2.25, minus 85.50 and plus 20.75.
The retracement grid published for Friday places the 38.2 percent retracement from the four-week high at 7,774.30 and the 50 percent retracement of the four-week range at 7,736.25, both beneath the settle, with the 38.2 percent retracement from the 13-week high at 7,706.74 and the 38.2 percent retracement from the four-week low at 7,698.19 further beneath. No four-hour series was captured for this session, so swing structure here rests on daily bars and the 30-minute session.
2.4 Moving Averages
The averages cited in this subsection were computed from the provider's daily settlement series for the December contract, which holds 259 completed sessions through Thursday. The 5-day average stands at 7,826.95, the 9-day at 7,833.78, the 20-day at 7,796.03, the 50-day at 7,778.70, the 100-day at 7,693.17 and the 200-day at 7,394.26.
The 7,791.00 settle sits 35.95 points beneath the 5-day average, 42.78 beneath the 9-day and 5.03 beneath the 20-day, and 12.31 above the 50-day, 97.83 above the 100-day and 396.74 above the 200-day. The 5-day average fell 5.05 from Wednesday's 7,832.00, because the 10/08 settle of 7,816.25 left the window and was replaced by 7,791.00. The 20-day rose 4.19 from 7,791.84, because the 09/17 settle of 7,707.25 left that window, and the 50-day fell 0.55 from 7,779.24.
The 20-day average sits above the 50-day because the last 20 settlements averaged 7,796.03 against 7,778.70 for the full 50, which means the 30 older settlements in the 50-day window averaged lower, at 7,767.14. The 50-day sits above the 100-day because the 50 older settlements in the 100-day window averaged lower, at 7,607.65. The projection grid gives the prices at which each average would be crossed on Friday: 7,834.72 for the 9-day, 7,796.63 for the 18-day and 7,766.33 for the 40-day.
2.5 Oscillator and Trend Readings
The oscillator figures below are as published on the provider's technical page dated for the Friday session and read after the 6:00 PM ET reopen; the page can substitute the live Globex price for the settle, so these readings carry that caveat. The 9-day relative strength reads 48.57, the 14-day relative strength 50.68 and the 20-day relative strength 51.60.
The 9-day raw stochastic reads 41.61 percent and the 14-day raw stochastic 53.17 percent, while the 14-day stochastic %K reads 49.72 percent and the 14-day stochastic %D 59.31 percent, so %K sits beneath %D near the middle of the range.
The 9-day directional index ADX reads 18.28 with the 9-day +DI at 15.00 and the 9-day -DI at 28.14; the 14-day directional index ADX reads 12.10 with the 14-day +DI at 16.89 and the 14-day -DI at 25.85, so negative direction leads on both while the low ADX readings describe a weak trend. The 9-day historic volatility reads 7.87 percent and the 14-day historic volatility 7.55 percent.
The composite multi-indicator read published for the Friday session is 16 percent buy, unchanged from 16 percent buy in the prior session's snapshot, with signal strength described as minimum and direction as weakest. The snapshot history reads 64 percent buy a week ago and 40 percent sell a month ago. The short-horizon group averages 40 percent sell, the medium-horizon group 25 percent buy and the long-horizon group 67 percent buy, and the composite trend indicator reads buy.
2.6 Volatility and Expected Range
The published 14-day average true range stands at 70.48 points and the 14-day average daily range at 69.27 points; the 9-day average true range is 67.79 with a 9-day average daily range of 62.83, and the 20-day average true range is 72.46 with a 20-day average daily range of 72.26. Thursday's 84.50 point range was 1.22 times the 14-day average daily range.
Adding and subtracting the 14-day average true range of 70.48 points from the 7,791.00 settle frames Friday between 7,720.52 and 7,861.48. The published standard-deviation bands are built from five settlements: one deviation spans 7,748.06 to 7,833.94, two spans 7,730.27 to 7,851.73 and three spans 7,716.62 to 7,865.38. These bands describe settlement dispersion, not intraday reach.
3. Key Levels
3.1 Resistance
Above the 7,791.00 settle, the 20-day settlement average at 7,796.03, the 18-day average crossing price at 7,796.63 and Thursday's 7,801.75 high form the first band. Pivot R1 at 7,822.75 and the 5-day settlement average at 7,826.95 form the band that anchors the setup, followed by one standard deviation resistance at 7,833.94 and the 9-day average crossing price at 7,834.72. Two standard deviations resistance at 7,851.73 and Pivot R2 at 7,854.50 come next, with three standard deviations resistance at 7,865.38, Wednesday's 7,879.75 high and Pivot R3 at 7,907.25 the extended references.
3.2 Support
Beneath the settle sit the 50-day settlement average at 7,778.70 and the 38.2 percent retracement from the four-week high at 7,774.30, with the Pivot Point at 7,770.00 and Wednesday's 7,770.25 settle next. The 40-day average crossing price at 7,766.33, the published target price at 7,759.75 and one standard deviation support at 7,748.06 follow, then Pivot S1 at 7,738.25, the 50 percent retracement at 7,736.25 and two standard deviations support at 7,730.27. Thursday's 7,717.25 low and three standard deviations support at 7,716.62 form the deeper band, with Pivot S2 at 7,685.50 and Pivot S3 at 7,653.75 the extended references.
4. Macro Drivers
4.1 Dollar, Rates, and Fed Policy
The news feed carried at 8:30 AM ET producer prices of 1.3 percent for the month against a 0.6 percent forecast, core producer prices of 0.7 percent against 0.3 percent, annual producer prices of 6.3 percent against 5.4 percent and annual core of 5.0 percent against 4.4 percent. Per the news feed, retail sales rose 0.8 percent against a 0.3 percent forecast and the core measure 0.9 percent against 0.5 percent, initial jobless claims printed 199 thousand against 200 thousand, the Philadelphia manufacturing survey 20.9 against 28 and the New York survey 25.5 against 12.
The ten-year yield index traded between 5.04 and 5.11 percent and closed at 5.09 percent against 5.19 percent on Wednesday, and the dollar index closed at 102.00, down 0.55. A feed headline at 12:00 PM ET said the hot producer-price data failed to revive rate-increase bets, and the feed's 9:19 AM ET sentiment item described hot inflation alongside a drop in yields and stronger haven demand. At 4:16 AM ET the feed carried investment-bank commentary expecting a third Federal Reserve increase in March 2027, and after the close a regional Federal Reserve president's remarks were carried at 4:46 PM ET and 4:48 PM ET. The next policy decision is listed for October 28, 2026, per the news-feed calendar and unconfirmed.
4.2 Large-Cap Leadership and Earnings
The feed's Europe and Asia wraps described a deepening selloff in artificial-intelligence and chip shares overnight. At 11:10 AM ET the feed carried the leading graphics-chip maker's chief executive saying a cloud-computing provider does not require financial backing from the chipmaker, and the US market wrap described stocks recovering as investors reassessed concerns about the sustainability of the artificial-intelligence boom. The Taiwanese chipmaker reported at 2:00 AM ET, as the calendar listed it, and the feed's 4:18 AM ET Europe sentiment item cited its earnings as a positive. A brokerage firm reported adjusted earnings of 1.69 dollars a share against an estimate of 1.65, per the feed. After the close, at 4:57 PM ET, the feed carried sources saying some investors dialed back valuation expectations for an artificial-intelligence developer after disappointing results.
4.3 Geopolitical Backdrop
The news feed carried at 1:14 PM ET a US statement that a civilian vessel was hit by a projectile from Iran's revolutionary guard and that a civilian container vessel sank while being towed to shore, and at 4:43 PM ET and 4:44 PM ET Pentagon statements on a rebalancing of the NATO alliance and a shift of focus toward the Pacific. November WTI crude settled at 97.97, up 3.03 percent, after a larger-than-expected official crude draw. These are statements carried by the news feed rather than events confirmed for this review, and no causal link to the index is asserted.
4.4 Sector Breadth and Rotation
The Dow industrials closed at 52,177.69, up 1.08 percent, and the NYSE composite at 24,066.65, up 0.84 percent, against a 0.33 percent gain in the S&P 500 cash index, a 0.05 percent decline in the Nasdaq-100 cash index and a 0.88 percent decline in the semiconductor index. The semiconductor index closed 409.69 points above its 11,171.53 low. In this review's interpretation the gains came from outside technology, with chip shares recovering from their lows without turning positive. No sector-level breadth series was captured, so the rotation is inferred from the index closes only.
4.5 Cross-Asset and Volatility
The volatility index closed at 16.46 against 16.87 after trading as high as 18.01, the Nasdaq-100 volatility index at 22.89 against 22.70 and the volatility-of-volatility index at 92.57 against 94.45. Gold rose 1.51 percent and crude 3.03 percent. The feed carried a sentiment gauge reading of 23 out of 100 at 10:17 AM ET, described as extreme fear, and at 3:38 PM ET money market fund assets of 7.92 trillion dollars, down 40.46 billion for the week.
4.6 Institutional Positioning
No weekly positioning report was captured for this session. Open interest on the December contract is shown at 1,920,481 for Wednesday, up from 1,915,573 on Tuesday; Thursday's open interest had not been reported when the review was written. Thursday's volume was 1,837,353 contracts against Wednesday's revised 2,063,500. The measured closing basis was 46.94 points, the December settlement of 7,791.00 less the 7,744.06 cash close from the same provider's daily record, against 51.31 on Wednesday.
5. SPX Options Flow Context
The desk note read for this section is the 5:28 PM ET edition for Thursday, read at 9:05 PM ET. Its reference prices are the prior session's closes, not Thursday's: SPX 7,718 equals Wednesday's 7,718.94 cash close and NDX 29,950 equals Wednesday's 29,950.82. The note's narrative states a close of 7,744, up 0.3 percent, consistent with the provider's 7,744.06 close, and this review uses the provider's close. Every level below is read against Thursday's 7,744.06 cash close.
On the index the primary call side ceiling sits at SPX 7,900, the largest gamma concentration at SPX 8,000, the modeled volatility threshold at SPX 7,760, the modeled gamma-flip level at SPX 7,732 and the primary put side support base at SPX 7,650. The close sits 155.94 points beneath the 7,900 ceiling, 15.94 points beneath the threshold, 12.06 points above the flip level and 94.06 points above the put side base. In the desk note, gamma tilt reads 0.923 and gamma notional minus 280.586 million dollars, so the note's aggregate dealer gamma is negative, against plus 996.435 million dollars in its Wednesday edition. The note's summary lists resistance at 7,750 and 7,800, support at 7,650, 7,600 and 7,450 and its desk pivot at 7,690, and its key strikes are SPX 8,000, 7,700, 7,000 and 7,800.
The note publishes its own December futures pair for each level, carrying the source's 47.55 point offset rather than the measured 46.94 point basis: the ceiling at 7,947.55, the largest concentration at 8,047.55, the modeled volatility threshold at 7,807.55, the modeled gamma-flip level at 7,779.55 and the put side support base at 7,697.55. These are quoted as the source's pairs. The modeled threshold and flip level are model outputs, not option strikes.
The narrative said the S&P 500 rebounded 110 basis points from its session low after testing and reclaiming the 7,690 desk pivot, that the long-bond fund rallied 1.4 percent and the equal-weighted index fund rose 1.4 percent, and that healthcare and software led with gains of about 2 percent. The note described an 18 thousand lot same-day put sale at the 7,575 strike that added positive gamma near that strike, a pocket of negative local gamma near 7,750 that it said made the market less stable there, index options flow that ended roughly flat after swinging between plus 2 billion and minus 10 billion dollars of cumulative delta, and single-stock flow of about plus 3 billion dollars led by put selling and call buying in artificial-intelligence names. Per the desk note, fixed-strike implied volatility fell 1 to 1.5 vol points on the day.
The note's implied one-day move is 0.50 percent and its implied five-day move 1.22 percent. It states at-the-money implied volatility of 13.5 percent for Friday, an expected one-day move of about 84 basis points, or about 65 points on the 7,744.06 close, and it notes that Friday is monthly options expiration, per the positioning note, unconfirmed. Its published implied one-day high and low of 7,727.8 and 7,650.9 are not symmetric around either the reference or the close, so that pair is excluded.
The S&P 500 positioning console, read at about 9:06 PM ET with a Date Updated stamp of 2026-10-15, shows call gamma of 5.73 billion against put gamma of minus 3.35 billion, one-month implied volatility of 13.10 percent against realised volatility of 10.28 percent, an implied-volatility rank of 17.79 percent and a put-to-call open-interest ratio of 1.38. The console for the S&P 500 exchange-traded fund shows call gamma of 79.24 million against put gamma of minus 6.78 billion and a put-to-call open-interest ratio of 1.92. Both consoles' high and low volatility point fields are treated as low-confidence and excluded; the index pair reads inverted, 8,355 against 9,130.
In this review's interpretation a cash close between the flip level and the modeled volatility threshold, with the desk note's aggregate gamma turning negative, describes an environment where dealer hedging is less likely to dampen moves and where monthly expiration can release positioning on Friday. The primary setup sells the 7,820 to 7,826 band, 12.45 points above the 7,807.55 source pair of the threshold and 0.95 beneath the 5-day settlement average at 7,826.95; the note's own resistance at 7,800 is a cash-index level, and the stop above Pivot R2 also clears the 7,807.55 pair.
6. Forecast
6.1 Night Session (6:00 PM ET Thursday to 3:00 AM ET Friday, Globex/Asia)
Globex reopened at 6:00 PM ET with the December contract quoted at 7,791.75 at 6:34 PM ET, 0.75 above the settle. The Bank of England governor is listed at 10:00 PM ET and a European Central Bank board member at 10:30 PM ET, both per the news-feed calendar and unconfirmed. The Federal Reserve Chair's discussion with the International Monetary Fund's managing director is scheduled for 11:30 PM ET, as the calendar lists it. Bias neutral beneath Pivot R1 at 7,822.75, expected Globex band roughly 7,765 to 7,815 absent a headline shock.
6.2 London Session (3:00 AM to 8:00 AM ET Friday)
Final euro-area consumer prices are listed at 5:00 AM ET, per the news-feed calendar and unconfirmed. Bias neutral to lower beneath the 5-day settlement average, expected band roughly 7,750 to 7,825, with the 7,820 to 7,826 band the first meaningful resistance and the Pivot Point at 7,770.00 the first meaningful support.
6.3 Morning Session (9:30 AM to 12:00 PM ET Friday, RTH Open)
Import prices for September print at 8:30 AM ET and industrial production at 9:15 AM ET, both as the calendar lists them, before the cash open at 9:30 AM ET. Expected band roughly 7,748 to 7,834, with one standard deviation resistance at 7,833.94 above and one standard deviation support at 7,748.06 beneath.
6.4 Afternoon Session (12:00 PM to 4:00 PM ET Friday)
The cash session closes at 4:00 PM ET, and a Friday close carries two days of headline exposure into the Sunday reopen. Expected band roughly 7,730 to 7,852.
6.5 Night Session Forward (6:00 PM ET Sunday)
Globex reopens at 6:00 PM ET on Sunday, October 18, 2026, after two days of headline exposure. The weekend gap references are Pivot R1 at 7,822.75 above and Pivot S1 at 7,738.25 beneath. A streaming-video company reports at 4:01 PM ET on Tuesday, October 20, 2026, as the calendar lists it.
6.6 Expected Range (Friday Full Session)
Low-range scenario: 7,765 to 7,815
Mid-range scenario (most likely): 7,748 to 7,834
High-range scenario: 7,720 to 7,862
6.7 Most Likely Path
In this review's analyst judgment the most probable path holds the contract between one standard deviation support at 7,748.06 and one standard deviation resistance at 7,833.94, with long-end yields and artificial-intelligence headlines deciding the side. In the same analyst judgment, a rally toward Pivot R1 at 7,822.75 that stalls beneath the 5-day settlement average at 7,826.95 is weighted above a sustained break higher, because Thursday printed a lower high and a lower low, the settle sits beneath the 5-day, 9-day and 20-day settlement averages, negative direction leads on the 9-day and 14-day directional systems and the composite reads 16 percent buy with direction described as weakest.
The alternative that would invalidate this reading is a continuation of Thursday's afternoon recovery that carries the contract through Pivot R2 at 7,854.50, which would put Wednesday's 7,879.75 high in play. The settle at 87.3 percent of the range, the higher settle and the strength in the Dow industrials are the evidence against the short reading.
7. Friday Economic Calendar
Globex reopened at 6:00 PM ET on Thursday. A Federal Reserve bank president spoke at 4:30 PM ET, per the news-feed calendar and unconfirmed. The Bank of England governor is listed at 10:00 PM ET and a European Central Bank board member at 10:30 PM ET, both per the news-feed calendar and unconfirmed. The Federal Reserve Chair's discussion with the International Monetary Fund's managing director is scheduled at 11:30 PM ET, as the calendar lists it.
On Friday, the Bank of Canada governor is listed at 12:15 AM ET and final euro-area consumer prices at 5:00 AM ET, both per the news-feed calendar and unconfirmed. Import prices for September print at 8:30 AM ET on Friday, October 16, 2026, and industrial production at 9:15 AM ET on Friday, October 16, 2026, both as the calendar lists them. The cash session opens at 9:30 AM ET and closes at 4:00 PM ET.
Later in the window, a streaming-video company reports at 4:01 PM ET on Tuesday, October 20, 2026, as the calendar lists it, and the next policy statement is listed for 2:00 PM ET on October 28, 2026, per the news-feed calendar and unconfirmed. In this review's judgment the first-order scheduled input on Friday is import prices at 8:30 AM ET, as the calendar lists it, with the Federal Reserve Chair's overnight discussion at 11:30 PM ET, as the calendar lists it, the other scheduled policy input.
8. Primary Trade Setup
Direction: Short
Rationale: Thursday printed a lower high and a lower low against Wednesday, the settle sits beneath the 5-day, 9-day and 20-day settlement averages, negative direction leads on the 9-day and 14-day directional systems, and the composite reads 16 percent buy with direction described as weakest; a rally into Pivot R1 at 7,822.75 beneath the 5-day settlement average at 7,826.95 offers a short with a defined risk point above Pivot R2 at 7,854.50. The settle finished at 87.3 percent of the range with a higher settle, and the settle sits above the 50-day average, so the setup is an analyst judgment that rallies stall beneath the 5-day average, not a measured edge.
Entry Zone: 7,820 to 7,826
Stop Loss: 7,858 (above Pivot R2 at 7,854.50 and two standard deviations resistance at 7,851.73)
Target 1 (T1): 7,788 (3.00 beneath Thursday's 7,791.00 settle)
Target 2 (T2): 7,753 (2.43 beneath the 3-10 day crossover stall level at 7,755.43)
Target 3 (T3, extended): 7,718 (0.75 above Thursday's 7,717.25 low)
Risk-to-Reward: Approximately 1:1 to T1, 1:2 to T2, 1:3 to T3
Invalidation: A settle above Pivot R2 at 7,854.50 negates the thesis. Short of that, the edge is removed by acceptance above the entry band rather than by a touch, defined as two consecutive 30-minute closes above 7,826.
Macro override: A soft import-price print that extends the decline in long-end yields, or a further recovery in chip shares, would invalidate the short in real time. In that scenario a move through the 7,858 stop removes the setup, and three standard deviations resistance at 7,865.38 and Wednesday's 7,879.75 high become the references within one 14-day average true range of 70.48 points.
Sources and methodology
This outlook is built from our session review of the December E-mini S&P 500 contract, the December ’26 contract, prepared after Thursday's close on October 15, 2026 for the Friday, October 16, 2026 session. Thursday's completed extremes are the inputs behind the published pivot ladder: Pivot R3 at 7,907.25 less Pivot S3 at 7,653.75, divided by three, and Pivot R2 at 7,854.50 less Pivot S2 at 7,685.50, divided by two, both return 84.50, and three times the 7,770.00 Pivot Point less the settle gives a high-plus-low sum of 15,519.00, which the pair of 7,801.75 and 7,717.25 reproduces. The provider's settlement row, the chart's completed Thursday daily bar and the extremes of Thursday's 30-minute bars carry the same high and low. Those figures, the 30-minute bars from the Wednesday 6:00 PM ET reopen through the 4:30 PM ET bar, and the review's own statements are the only evidence used to grade Thursday's card; an order is stated only where a bar shows it. Wednesday's volume now reads 2,063,500 contracts on the revised 2026-10-14 row, which replaces the 1,976,201 carried in Thursday's outlook, and Wednesday's open interest of 1,920,481 is now reported on that row; that post was not changed.
The moving averages were computed from the provider's 259-session daily settlement series through Thursday; the oscillators are cited as published for the Friday session, read after the 6:00 PM ET reopen, and that page can substitute the live Globex price for the settle. The desk note used is the 5:28 PM ET edition for Thursday, October 15; its reference column carries Wednesday's closes and its futures column a fixed 47.55 point translation, so cash equivalents here use the 46.94 point basis measured on Thursday, settlement against cash close. The note's implied one-day high and low pair is not symmetric around either the reference or the close and is excluded. The desk note's aggregate gamma and the consoles' call and put gamma are separate measures from different models and timestamps; they are shown side by side, each with its source, and never combined. The consoles' high and low volatility point fields are excluded as low-confidence. After the settle, the 4:30 PM ET bar closed at 7,786.00, a post-settlement quote that is not used as the settlement, and the provider's 7,788.75 open, 7,794.00 high and 7,786.25 low belong to the new session dated Friday. Scenario ranges are analyst judgment. Items marked unconfirmed come from the news-feed calendar or the positioning note, and every catalyst whose release time had passed at the time of writing is recorded as completed.
Thursday’s outlook for this contract is here, and the Nasdaq-100 contract’s Thursday outlook covers the index that slipped 0.05 percent in cash on Thursday. Outlooks for ES, NQ, GC and CL are collected on the market outlook page, and our forward trading record is on the performance statement.



