
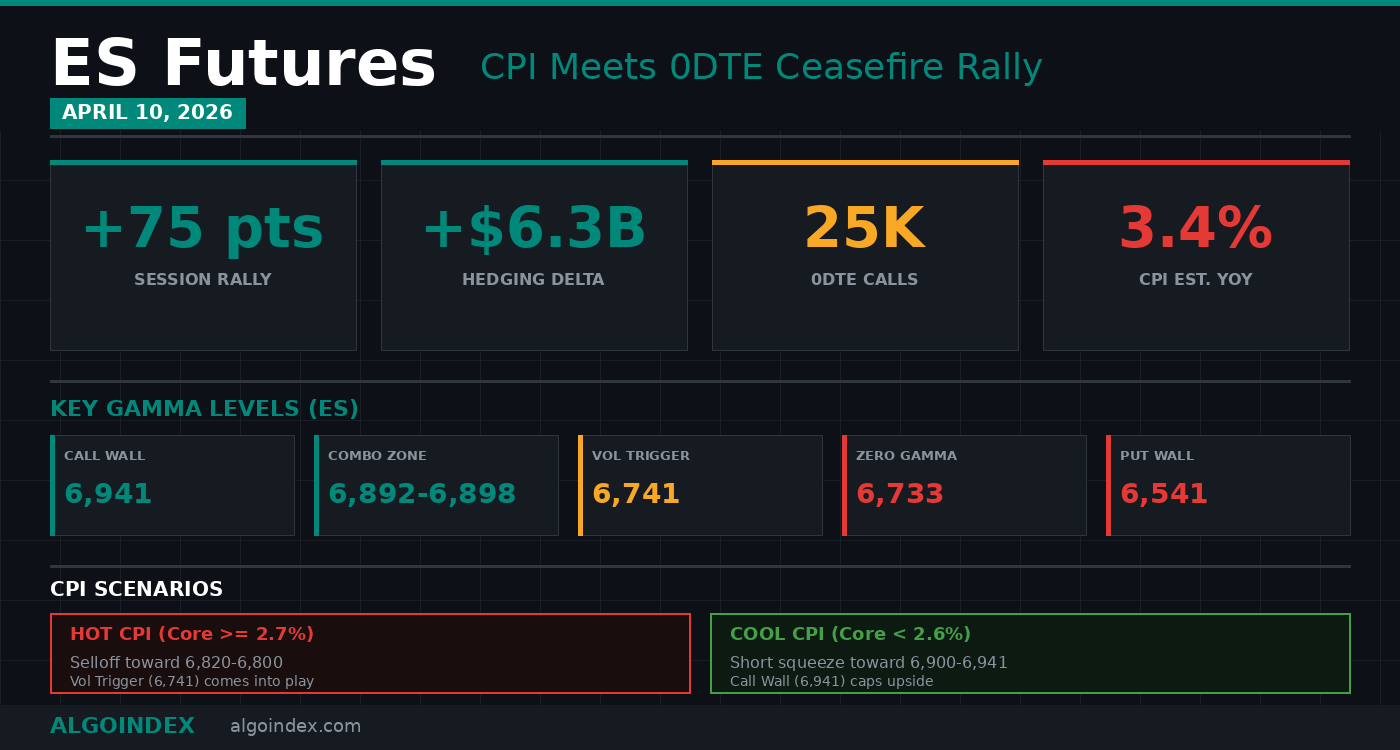
ES Futures • S&P 500 E-mini • CPI Day Setup
Between the moment Israel announced ceasefire talks and the moment 25,000 SPX 0DTE calls crossed the wire, ES futures surged 75 points in a single session, tagging 6,876 before stalling just below Thursday’s gamma ceiling. Cumulative hedging delta hit +$6.3 billion, a reading 24% above the 30-day maximum of $5.1 billion, the most aggressive positive flow in a month. And yet, buried beneath the rally, institutions were buying protection at a pace that tells a very different story.
That contradiction is the setup for Friday’s CPI release at 8:30 ET. The April 9 session delivered a surface-level recovery that reclaimed the 50-day moving average and pressed against the 100-day MA at SPX 6,802. As we detailed in yesterday’s ceasefire and triple-data analysis, the rally’s foundation rested on PCE and GDP data that came in mixed-to-soft. But the rally’s engine, 0DTE call speculation, expired at Thursday’s close. Friday opens with a clean gamma slate, no residual call support, and a CPI consensus calling for core inflation to re-accelerate from 2.5% to 2.7% year-over-year. The headline estimate of 3.4% would represent a significant jump from 2.4% prior. If those numbers print, the dovish narrative that fueled Thursday’s squeeze evaporates in minutes.
Gamma Architecture Heading Into CPI
Dealer gamma sits at +$758 million notional with a tilt of 1.251, meaning call positioning dominates and dealers are currently dampening moves. Price closed above both the gamma flip level level at ES 6,733 and the volatility inflection level at 6,741, which keeps the hedging environment supportive on shallow dips. For traders unfamiliar with how these levels shape price action, our complete guide to gamma exposure and GEX explains the mechanics in detail.
The problem is proximity to a cliff. A CPI-driven selloff that pushes ES below 6,741 flips dealer behavior from buying weakness to selling into it. Options flow data identified 6,740 SPX (roughly ES 6,781) as a critical support with a 99th percentile market-maker concentration. Below that threshold, negative gamma accelerates and the downside becomes self-reinforcing. The Call Wall at ES 6,941 caps the upside, while the Put Wall at 6,541 marks the lower gamma boundary, a level that would require a multi-standard-deviation shock to reach.
| Call Wall | 6,941 | Upper gamma ceiling |
| Combo Zone | 6,892-6,898 | High-confidence resistance |
| volatility inflection level | 6,741 | Conditions flip below |
| gamma flip level | 6,733 | Dealer hedging flips |
| Put Wall | 6,541 | Lower gamma boundary |
The implied one-day move of 0.65% translates to a rough range of 6,810 to 6,900 from Thursday’s close, though CPI volatility could widen that band considerably.
Institutional Positioning Contradicts the Rally
Thursday’s institutional flow report painted a decidedly bearish picture beneath the headline rally. Combined index ETF delta reached -$20,768 million at the 95th percentile, one of the most bearish readings in recent memory. QQQ alone carried -$1,473 million in bearish delta at the 1st percentile.
The specific trades tell the story more precisely. Institutions bought 185,492 QQQ April 17 puts at the 582 strike, a large protective position in tech. SPY saw 75,049 contracts of the May 15 480 puts and another 74,916 of the May 15 580 puts purchased, layering both deep out-of-the-money tail risk hedges and near-money protection. VIX call spreads, buying the 22 and 25 strikes while selling the 34, signal expectations for volatility to rise but not explode, the kind of positioning you see ahead of a known catalyst like CPI.
High-yield credit markets echoed the caution. HYG carried -$323 million in bearish delta at the 1st percentile with elevated vega at the 98th percentile, a combination that prices in both directional downside and a spike in credit volatility. When professional traders buy equity protection and credit hedges simultaneously after a 75-point rally, they are not celebrating the move. They are preparing for its reversal. This pattern mirrors the institutional hedging behavior we documented during the late-March PCE release and Iran deadline extension, where surface-level calm masked aggressive downside positioning.
The Ceasefire Catalyst Is Already Fading
Thursday’s rally was triggered by Israel-Lebanon ceasefire negotiations, but the geopolitical backdrop deteriorated before the session even ended. IDF began striking Hezbollah positions in Lebanon after the announcement. Iranian media reported reconnaissance flights over Tehran. Kuwait’s national guard facilities were targeted by drones. Iran’s Parliament Speaker warned that time was running out.
By Thursday evening, Iran had flagged a ceasefire violation. The two-week ceasefire window is already showing cracks, and the easy money from the headline was made on Wednesday when oil dropped from $99 to $94. WTI bounced back to $99 on Thursday as the market priced in fragility. Saudi refinery attacks earlier in the week took roughly 600,000 barrels per day offline, keeping the crude supply picture tight regardless of ceasefire headlines.
The geopolitical setup adds a secondary risk layer on top of CPI. A breakdown in ceasefire talks combined with a hot inflation print would create a dual catalyst for risk-off positioning, precisely the scenario institutions appear to be hedging. The broader correction dynamics we first examined in our analysis of whether a market crash is really brewing remain relevant: when multiple risk catalysts converge on stretched positioning, the unwind tends to be faster than the buildup.
Technical Structure at the Inflection
SPX closed at 6,824.67, reclaiming the 50-day moving average at 6,757 and pressing against the 100-day MA at 6,802. The 4-hour chart confirmed a break of structure at 6,848 with price reaching the 2.0 Fibonacci extension, a level that often marks impulse exhaustion. Oscillators sit at 84.80, approaching overbought territory, which leaves limited room for upside continuation without a pullback.
The 14-day RSI at 61.38 remains neutral-to-bullish but not overheated. The 14-day average true range of 96.68 points suggests Friday’s expected range spans roughly 6,758 to 6,952 from Thursday’s close, a band wide enough to accommodate a significant CPI reaction in either direction. For context on how to read these market internals and volatility signals, the interplay between breadth, volume, and VIX is especially critical on data release days. The computed technical opinion shifted from 56% sell to hold, reflecting improved momentum but not yet confirming a trend reversal.
For the rally to hold structural validity, the 4-hour break of structure level at 6,848 must act as support. A failure there invalidates the bullish thesis and likely triggers a move toward the charm pressure target at 6,820, followed by the 100-day MA zone near 6,800. Below the volatility inflection level at 6,741, the selloff intensifies mechanically as dealer hedging flips.
The 100-day moving average sits right where the institutions drew their line, and CPI will decide which side of it this market wakes up on.
For traders looking beyond ES into the tech-heavy Nasdaq 100 contract, our complete NQ futures trading guide breaks down contract specs, margin requirements, and what drives NQ price action.
Join the Discussion
Connect with other ES futures and SPY options traders. Share setups, discuss levels, and get real-time market insights from our community.
Join AlgoIndex Trading CommunityFoundational guides
New to S&P 500 futures? Start with What Are ES Futures, the ES, NQ, MES & MNQ point value and contract specs, gamma exposure (GEX) explained, and market internals: TICK, ADD, VOLD and VIX.



