At 8:30 AM ET on Monday, one 30-minute bar took December gold from a 3,918.8 open to a 3,961.0 high. That bar crossed the 3,930 to 3,940 short band we set for the session. Its high sat 1.0 point above the card's 3,960 stop. The contract settled at 3,969.6 at 1:30 PM ET, up 70.7 points, or 1.81 percent, from Friday's 3,898.9.
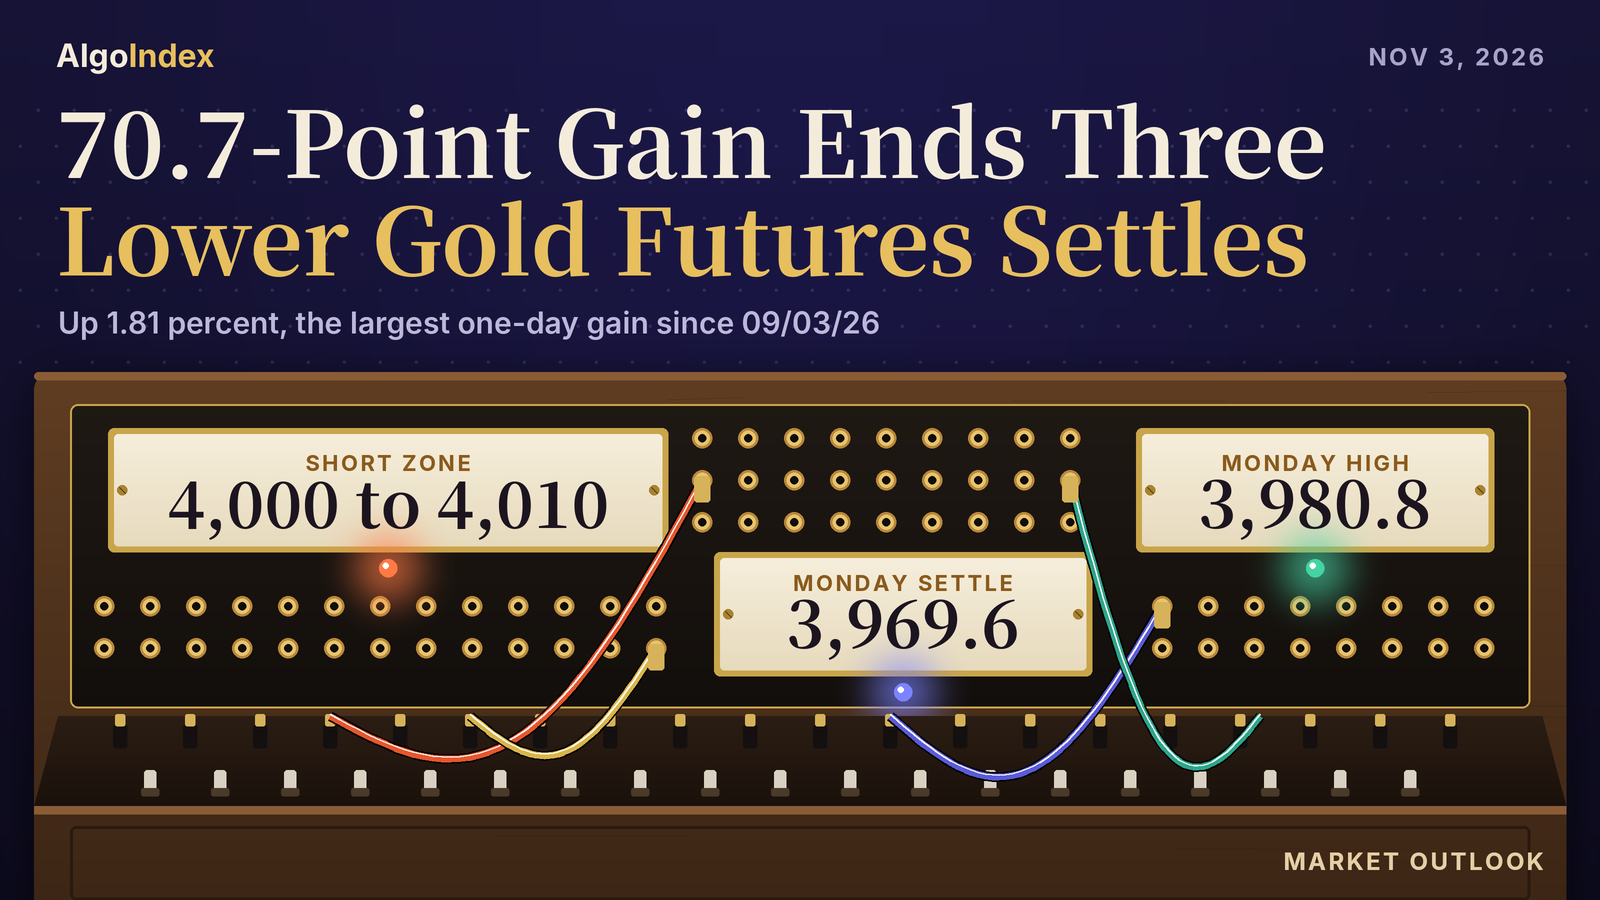
It was the largest one-day settlement gain since 09/03/26. It also ended a run of three lower settles. December WTI fell 7.36 percent to 96.46 the same day, and the news feed carried reports on diplomacy between the United States and Iran. Even so, the settle still sits beneath every settlement average. Tuesday's primary setup is another short, from 4,000 to 4,010, around Pivot R1 at 4,003.9 and the 5-day average at 4,005.2. The settle sits 30.4 points beneath it.
December gold settled at 3,969.6, up 70.7, inside Friday's 4,038.2 to 3,879.3 range and 11.2 points beneath Monday's 3,980.8 high. Every settlement average sits above it, from the 5-day at 4,005.2 to the 200-day at 4,587.7. The primary setup for Tuesday is a short from 4,000 to 4,010, with Pivot R1 and the 5-day average inside the band, stop 4,030, and targets 3,980, 3,955 and an extended 3,930. The band sits above the market. Target 1 sits 10.4 points above the settle and 0.8 beneath Monday's high; Target 2 sits 14.6 beneath the settle. The composite reads "88% SELL" with strength "Strong". Factory orders and the JOLTS report are scheduled for 10:00 AM ET on Tuesday, as the calendar lists them.
Monday's 8:30 AM ET bar crossed the 3,930 to 3,940 band and traded through the 3,960 stop
In Monday’s outlook we set a short from 3,930 to 3,940, stop 3,960, with targets at 3,910, 3,885 and an extended 3,860. Its status line put the contract at 3,898.9 at the Friday settle, 31.1 points beneath the band. Monday's bar, from the review and the dated 2026-11-02 row of the provider's daily record, opened at 3,890.0 at the Sunday 6:00 PM ET reopen. That was 8.9 under Friday's settle and 40.0 beneath the band bottom. It marked a low of 3,889.0 and a high of 3,980.8 and settled at 3,969.6.
The bars give the order. The low came first, in the 6:00 PM ET bar on Sunday. Through the 8:00 AM ET bar the 30-minute closes held between 3,903.8 and 3,921.8. No print reached the band in those hours; the highest, 3,928.1, stopped 1.9 beneath it. The 8:30 AM ET bar opened at 3,918.8, beneath the band, and reached 3,961.0. The band and the 3,960 stop both first traded in that bar. No fill and no result is asserted.
The rest of the card's tests followed. Its acceptance test, two consecutive 30-minute closes above 3,940, was met with the 9:00 AM ET bar, after closes of 3,947.5 and 3,958.2. The session high of 3,980.8 came in the 11:30 AM ET bar, 20.8 above the stop. The settle finished 9.6 above the stop. It sat 1.6 above one standard deviation resistance at 3,968.0, so the card's invalidation line, a settle above that level, was met.
None of the targets printed after the band traded. The 3,910 first target had traded overnight, first in the 6:00 PM ET bar on Sunday, before the band; that print carries no result. From the 8:30 AM ET bar onward no bar traded at 3,910. That bar's own low, 3,917.8, sat 7.8 above it. The 3,885 second target and the extended 3,860 never traded. Monday's low stopped 4.0 above 3,885.
The path call did not hold. Our Monday outlook weighted a rebound toward the 3,938.8 Pivot Point that fails beneath one standard deviation resistance at 3,968.0 above a sustained recovery. The rebound came and kept going. Prices first reached 3,968.0 in the 9:30 AM ET bar, and the high went 12.8 beyond it. The alternative named for invalidation, a settle above Pivot R1 at 3,998.3, did not occur. The high stopped 17.5 beneath R1. The downside branch, a reopen beneath Friday's 3,879.3 low, did not occur either. Monday opened 10.7 above that low.
The range work missed at the top this time. Monday's high went 40.8 above the 3,940 top of the low-range case and 10.8 above the 3,970 top of the most likely case. The settle finished 0.4 beneath that top. The high-range case of 3,780 to 4,000 held, with the high 19.2 beneath its top. The 3,980.3 top of the average-true-range envelope gave way by 0.5. Two deviations resistance at 3,996.6 held, 15.8 above the high.
The session bands split. The night band of 3,850 to 3,930 held, with the night trading from 3,889.0 to 3,928.1, 1.9 beneath its top. London's 3,845 to 3,945 band held too, around a 3,900.1 to 3,916.4 window. The morning band of 3,840 to 3,960 did not. From 9:30 AM ET to 12:00 PM ET the contract traded between 3,956.8 and 3,980.8, 20.8 above its top. The afternoon traded from 3,947.4 to 3,980.3, 10.3 above its 3,830 to 3,970 band.
The macro override named a sharp equity recovery with a weaker dollar, or an escalation that restores safe-haven demand. The S&P 500 cash index fell 0.51 percent. The dollar index eased 0.13 to 101.75. The feeds carried de-escalation headlines, in the review's description. Neither condition was met as written, and the stop traded in the 8:30 AM ET bar. We grade the card as written.
One row anchors the score. The dated 2026-11-02 row of the provider's daily record reads 3,890.0, 3,980.8, 3,889.0 and 3,969.6 on 166,666 contracts. The review states the same prices and volume. Monday's open interest was not yet reported. Friday's 2026-10-30 row was revised. It now carries 237,470 contracts against the preliminary 230,038 our Monday outlook carried, and open interest of 269,498, which that outlook listed as not yet reported. The review cites the same 237,470 and 269,498 for Friday.
The 4,000 to 4,010 band, Pivot R1 at 4,003.9 and the 5-day average at 4,005.2
Resistance starts at Monday's high. The 3,980.8 high sits 11.2 above the settle, and the 30 percent raw stochastic projection at 3,981.6 sits 0.8 above it. Then comes the band. Pivot R1 at 4,003.9 sits 3.9 above the 4,000 bottom. The 5-day average at 4,005.2 sits 4.8 beneath the 4,010 top, and the 10/23 settle of 4,007.9 also falls inside it.
Above the band the steps are short. The 9-day crossing price at 4,016.6 sits 6.6 over the top, and the 38.2 percent retracement from the four-week low at 4,018.0 sits 1.4 above that. The 4,030 stop sits 12.0 above the retracement and 1.4 beneath the 9-day average at 4,031.4, which is also the 10/29 settle. Friday's 4,038.2 high, Pivot R2 at 4,038.3 and the 10/26 settle of 4,038.4 sit within 0.2 of each other. One standard deviation resistance at 4,040.7 follows, 10.7 beyond the stop.
Then the extended group. The 50 percent raw stochastic projection at 4,049.8, the 10/28 settle of 4,051.6 and the 4,051.7 average-true-range mark come next. The 10/22 settle of 4,060.4 and the 50 percent retracement at 4,060.8 sit 0.4 apart. Two standard deviations resistance at 4,070.2 and the 10/27 settle of 4,074.6 follow. Four references lie within 4.4 points: three standard deviations resistance at 4,092.8, Pivot R3 at 4,095.7, the 18-day crossing price at 4,095.8 and the 4,097.2 weekly high. The 38.2 percent retracement from the four-week high at 4,103.6 and the 20-day average at 4,105.7 close the group.
The rest is distant. The 10/05 settle of 4,156.8 left the 20-day window on Monday. The provider publishes 4,242.3 as the one-month high. The 100-day at 4,261.9, the 50-day at 4,280.6 and the 200-day at 4,587.7 follow.
Support starts close. The 14-day stochastic stall level at 3,962.7 sits 6.9 beneath the settle. The final 30-minute close, 3,956.6 in the 4:30 PM ET bar after the settle, sits 13.0 beneath it. The 20 percent raw stochastic projection at 3,947.5 and the Pivot Point at 3,946.5 sit 1.0 apart, the pivot 23.1 beneath the settle. The published target price at 3,931.1 and the 3-10 day crossover stall level at 3,930.7 sit 0.4 apart. Pivot S1 at 3,912.1 follows, 57.5 beneath.
Deeper down, Friday's 3,898.9 settle sits 0.4 above one standard deviation support at 3,898.5. Monday's 3,890.0 open and 3,889.0 low come next, then the 3,887.5 average-true-range mark, 1.5 beneath the low. Friday's 3,879.3 low remains the provider's published 52-week, 13-week and one-month low. Two standard deviations support at 3,869.0, Pivot S2 at 3,854.7, three standard deviations support at 3,846.4 and Pivot S3 at 3,820.3 are the extended references.
Every average still sits above the settle. The gaps run 35.6 to the 5-day at 4,005.2, 61.8 to the 9-day at 4,031.4 and 136.1 to the 20-day at 4,105.7. Further out, 311.0 separates the settle from the 50-day at 4,280.6. The 100-day at 4,261.9 sits 292.3 above, the 200-day at 4,587.7 sits 618.1 above. The 5-day fell 13.8 from 4,019.0 as the 10/26 settle of 4,038.4 left its window. The 20-day fell 9.4 from 4,115.0 as the 10/05 settle of 4,156.8 dropped out. Older settlements explain the order. The 30 older ones in the 50-day window averaged 4,397.2, the 50 older ones in the 100-day window 4,243.3 and the 100 older ones in the 200-day window 4,913.4. Tuesday's crossing prices are 4,016.6 for the 9-day and 4,095.8 for the 18-day. The February contract settled at 4,002.3, 32.7 above December, against 32.0 on Friday.
Momentum sits beneath the midline. Relative strength reads 35.75 on the 9-day, 36.07 on the 14-day and 37.50 on the 20-day. The raw stochastics read 31.68 percent on the 9-day and 26.47 percent on the 14-day. The 14-day %K at 16.28 percent sits beneath %D at 19.01 percent. Sellers lead on direction. On the 9-day, negative direction at 34.61 leads positive at 8.49 with the ADX at 41.00; on the 14-day, 31.19 leads 10.04 with the ADX at 30.90. Historic volatility reads 23.82 percent on the 9-day and 21.73 percent on the 14-day. These are the provider's published readings, read at 6:24 PM ET on Monday after the Globex reopen, and the page may already reflect the reopened session's price.
The composite read published for Tuesday reads "88% SELL", with strength "Strong" and direction "Strongest". The prior session and a week ago both read "88% SELL". A month ago it read "80% SELL". The short-term group reads "Average: 100% SELL", the medium-term "Average: 100% SELL" and the long-term "Average: 33% SELL". The composite indicator reads "SELL".
Monday's 91.8 point range was 1.21 times the 14-day average daily range of 75.9. The high sat 57.4 beneath Friday's 4,038.2 and the low 9.7 above Friday's 3,879.3. That made an inside session. At 87.8 percent of the range, the settle sat 80.6 above the low and 11.2 beneath the high. The body ran 79.6 points above the open. The four-hour bars closed at 3,904.0, 3,915.8, 3,907.9, 3,974.8, 3,963.7 and 3,956.6. The 6:00 AM ET bar carried the gain, 66.9 points, from 3,907.9 to 3,974.8. The 2:00 AM, 10:00 AM and 2:00 PM ET bars closed beneath their opens, the last two by 11.0 and 7.1.
The week of October 26 spanned 4,097.2 to 3,879.3. Over five sessions the contract is down 68.8 from the 4,038.4 settle of 10/26. Settlements over eight sessions ran 4,060.4, 4,007.9, 4,038.4, 4,074.6, 4,051.6, 4,031.4, 3,898.9 and 3,969.6. Changes over ten sessions ran minus 17.5, plus 7.4, minus 89.6, minus 52.5, plus 30.5, plus 36.2, minus 23.0, minus 20.2, minus 132.5 and plus 70.7. Daily ranges ran 44.8, 38.3, 127.5, 61.1, 53.1, 77.8, 60.3, 65.4, 158.9 and 91.8 points.
The 14-day average true range stands at 82.1 points, with the 14-day average daily range at 75.9. The 9-day figures are 81.9 and 81.6, and the 20-day 84.5 and 74.5. One average true range either side of the settle spans 3,887.5 to 4,051.7. The deviation bands are built from five settlements. They run 3,898.5 to 4,040.7, 3,869.0 to 4,070.2 and 3,846.4 to 4,092.8, and describe dispersion, not intraday reach. The retracement grid for Tuesday sits above the settle: 4,018.0, 4,060.8 and 4,103.6.
A 7.36 percent fall in crude, a softer dollar and a 1.81 percent gain in gold
Crude and gold split. December WTI fell 7.36 percent to 96.46. The news feed carried reports on diplomacy between the United States and Iran the same day; these are reports carried by the feeds, not events confirmed for this review. In the review's interpretation crude was Monday's driver, a reading the price record alone does not establish. The provider's commentary connected the decline in crude to lower inflation expectations, a weaker dollar and lower yields; that link is the commentary's view, unconfirmed.
The dollar eased. The dollar index's daily record closed at 101.75 against 101.88 on Friday, down 0.13. The provider's commentary described the dollar at a one-month low after crude's decline eased inflation expectations, per that commentary and unconfirmed. The ten-year yield index closed at 4.89 percent against 4.92 percent. Gold rose 1.81 percent on a day both the dollar and nominal yields eased; the moves coincided. No real-yield series was captured, so no real-yield level is asserted.
Metals rose together while stocks slipped. Silver's December contract gained 3.27 percent to 50.888, and the gold-to-silver ratio fell to 78.01 from 79.12. The S&P 500 cash index fell 0.51 percent. The volatility index closed at 21.15 against 19.42.
One bar did most of the work. The 8:30 AM ET bar closed at 3,947.5, 28.5 above the 8:00 AM ET close of 3,919.0, and the 9:30 AM ET bar closed at 3,974.8. At 8:30 AM ET the news feed carried a state media report that Iran's Supreme Leader had granted the government authority in negotiations. Crude's 8:30 AM ET bar declined 2.13 points, per the review. The timing coincided. The series does not establish that either caused gold's move.
The afternoon brought more headlines. The news feed carried the President's remarks that there was no rush to decide on restarting the war in Iran, and a pool report at 3:03 PM ET that he said "No" to striking Iran after the elections. After the close the feeds carried reports of explosions heard on Qeshm Island at 4:04 PM ET, with no official confirmation, and off Bandar Lengeh at 4:34 PM ET. These are reports carried by the feeds, not events confirmed for this review. Gold rose on a day the feeds carried de-escalation headlines; no causal link is drawn here.
Rates are the other thread. The Fed's October 28, 2026 decision kept rates unchanged on a 10 to 2 vote with two dissents in favour of a 25 basis point increase, per the news feed and unconfirmed. Market pricing showed a 74 percent chance of a quarter-point increase at the next meeting, per the provider's commentary and unconfirmed. The US manufacturing survey rose to 55.5, per the provider's commentary and unconfirmed. Its prices paid component stood at 75.2, per the same commentary. Construction spending was released at 10:00 AM ET on Monday, as the calendar lists it. It fell 1.9 percent against an expected gain, per the provider's commentary and unconfirmed.
No structural demand figure was available. Central-bank purchase figures, Chinese reference rates and bullion-fund holdings were not captured, and neither was the weekly positioning report, so none is asserted. Monday's December volume was 166,666 contracts against a revised 237,470 on Friday, down 70,804 or 29.8 percent. Open interest stood at 269,498 on Friday 10/30 against 275,161 on Thursday 10/29, down 5,663. Monday's open interest was not yet reported.
The fund console comes next. The gold fund's options console was read at 6:18 PM ET on Monday, after the settle, with a page date of 2026-11-02; every figure below is that evening read, as of its read time. The fund is a proxy, used qualitatively only and never translated into futures prices; it tracks bullion at a different scale with a fee drag and has no clean basis to the December contract. The console carried Friday's 355.96 as its previous close. It showed a current price of 361.63, up 1.59 percent.
Modeled call gamma read minus 189.02 million against put gamma of plus 110.3 million on the proxy. At that read aggregate call-side gamma was negative and put-side gamma positive. Call volume of 227.84 thousand against put volume of 159.37 thousand and a put-to-call open-interest ratio of 0.5 show calls ahead of puts in the day's volume and open interest, an observation only. Options volume says nothing about direction or demand. Then volatility. One-month implied volatility read 23.50 percent against realised volatility of 21.14 percent, 2.36 points apart. The implied-volatility rank read 22.28 percent and the skew rank 19.37 percent. The options-implied move was 5.28 dollars, about 1.46 percent of the 361.63 current price.
These are readings taken at 6:18 PM ET on Monday, after the rebound and after the settle, and they describe that moment only. In the review's interpretation, calls ahead of puts and a modest implied-volatility rank at that evening read are consistent with the rebound. The read came after the move, so it says nothing about conditions before it. Modeled gamma on a proxy stays a non-directional lens. The console's high and low volatility point fields are excluded, and no fund figure sets a futures level here.
The trade map for Tuesday
The primary setup is a short. Its band runs 4,000 to 4,010 and holds Pivot R1 at 4,003.9 and the 5-day average at 4,005.2. The settle sits beneath every settlement average from the 5-day to the 200-day. Negative direction leads on both directional systems, and the composite reads "88% SELL" with strength "Strong". Monday's rebound stayed inside Friday's range. The band sits 30.4 to 40.4 points above the settle and 19.2 above Monday's high. Risk sits above the retracement. The 4,030 stop sits 12.0 above the 38.2 percent retracement at 4,018.0 and 1.4 beneath the 9-day average at 4,031.4. Targets step down. The first, 3,980, sits 1.6 beneath the 30 percent raw stochastic projection at 3,981.6 and 0.8 beneath Monday's 3,980.8 high, 10.4 above the settle. Then comes 3,955, 14.6 beneath the settle and 8.5 above the Pivot Point at 3,946.5. The extended 3,930 sits 1.1 beneath the published target price at 3,931.1. The review names the case against the trade. Monday's strong close can extend. So the review calls the setup an analyst judgment that rebounds beneath the short averages are sold, with no measured edge behind it.
The Tuesday session opened at the Monday 6:00 PM ET reopen. The review places the contract near the 3,956.6 post-settlement print at the reopen. That print came in the 4:30 PM ET bar, 13.0 beneath the settle. In the review's framing the overnight hours carry the post-close explosion reports from the Gulf and any further diplomacy headlines. Its night bias is neutral beneath Pivot R1 at 4,003.9, with an expected band of roughly 3,930 to 3,990. That band's top sits 10.0 beneath the 4,000 bottom of the setup band.
European trading opens at 3:00 AM ET. Swiss inflation data are listed for 2:30 AM ET by the news-feed calendar, unconfirmed. The review's London band runs roughly 3,925 to 4,000, with a neutral to lower bias beneath Pivot R1. Its top meets the 4,000 band bottom.
Data arrive at 10:00 AM ET. Factory orders and the JOLTS report are both scheduled then, on Tuesday, November 3, 2026, as the calendar lists them. The JOLTS figure bears on the rate-increase pricing described above. The morning band runs roughly 3,915 to 4,015. The setup band's 4,010 top sits 5.0 beneath its upper edge.
Gold settles at 1:30 PM ET. The midterm elections take place on Tuesday, per the news-feed calendar and unconfirmed. The afternoon band runs roughly 3,910 to 4,020, its top 10.0 above the setup band.
For the full session the review sets a low-range case of 3,930 to 3,990, a mid-range case, the most likely, of 3,910 to 4,020 and a high-range case of 3,880 to 4,050. That last case's 3,880 bottom sits 7.5 beneath the 3,887.5 average-true-range mark. Its 4,050 top sits 1.7 beneath the 4,051.7 mark. Later in the week, the trade report is scheduled for 8:30 AM ET on Wednesday, November 4, and preliminary productivity and costs for 8:30 AM ET on Thursday, November 5. The employment situation report follows at 8:30 AM ET on Friday, November 6, 2026, as the calendar lists them.
One path is weighted. In the review's analyst judgment the most probable path holds the contract between Pivot S1 at 3,912.1 and the 38.2 percent retracement at 4,018.0. Within it, a further test toward Pivot R1 at 4,003.9 and the 5-day average at 4,005.2 that stalls beneath the 9-day average at 4,031.4 is weighted above a sustained recovery through one standard deviation resistance at 4,040.7. No measured frequency backs it. The 9-day reference sits 13.4 above the 4,018.0 top of that path. The alternative that would invalidate the reading is a settle above 4,040.7. That could bring the 50 percent retracement at 4,060.8 into play and, in the review's reading, suggest Friday's 3,879.3 low marked a turn. A move beneath Pivot S1 at 3,912.1 before any rebound could instead bring Monday's 3,889.0 low and the 52-week low of 3,879.3 into play without the rebound the setup needs.
Tuesday's band starts 19.2 points above Monday's high. The rebound has to extend before the short comes into play.
The complete data picture
Every number behind Tuesday’s plan, charted first, then the full level lists, then the complete numeric reference underneath.
Full numeric reference, every remaining figure from the session review
1. Executive Summary
The December gold contract settled at 3,969.6 on Monday, up 70.7 or 1.81 percent from Friday's settle of 3,898.9, after trading between 3,980.8 and 3,889.0, a 91.8 point daily range. The settle finished at 87.8 percent of the range, and the range was 1.21 multiples of the published 14-day average daily range of 75.9 points. Monday's high sat 57.4 beneath Friday's 4,038.2 high and its low sat 9.7 above Friday's 3,879.3 low, so the session traded inside Friday's range. The 70.7 point gain is the largest one-day settlement gain since the 125.3 point gain of 09/03/26, and it ended a run of three lower settles.
In this review's interpretation, crude was Monday's driver. December WTI fell 7.36 percent on a day the news feed carried reports on diplomacy between the United States and Iran, the dollar index eased to 101.75 from 101.88, and the ten-year yield index closed at 4.89 percent; Friday's close was 4.92 percent. The provider's commentary connected the decline in crude to lower inflation expectations, a weaker dollar and lower yields, and gold rose alongside silver, whose December contract gained 3.27 percent. These are reports and attributed commentary, not events confirmed for this review.
Monday's rebound left the structure beneath every settlement average from the 5-day to the 200-day, and Friday's 3,879.3 low remains the provider's published 52-week low. Electronic trade after the 1:30 PM ET settlement ended the session at 3,956.6 in the 4:30 PM ET bar, 13.0 beneath the settle.
The composite multi-indicator read published for Tuesday is "88% SELL" with strength "Strong" and direction "Strongest", unchanged from "88% SELL" a session earlier. The Primary Setup below is a short from the 4,000 to 4,010 band around Pivot R1 at 4,003.9 and the 5-day average at 4,005.2, stopped at 4,030, with objectives at 3,980, 3,955 and an extended 3,930.
2. Price Action & Technical Structure
2.1 Intraday and Session Review
The Monday session opened at 3,890.0 at the Sunday 6:00 PM ET reopen, 8.9 under Friday's settle, marked a daily low of 3,889.0 and a daily high of 3,980.8, and settled at 3,969.6 at 1:30 PM ET. The 30-minute series for the continuous contract places the low in the 6:00 PM ET bar on Sunday and the high in the 11:30 AM ET bar on Monday. Through the overnight hours the 30-minute closes held between 3,903.8 and 3,921.8.
The 8:30 AM ET bar closed at 3,947.5, 28.5 above the 8:00 AM ET bar's close of 3,919.0, and the 9:30 AM ET bar closed at 3,974.8. The 8:30 AM ET bar coincided with the news feed's 8:30 AM ET state media report on Iran's negotiating authority and with the 2.13 point decline in crude's 8:30 AM ET bar; the series does not establish that either caused the move. After the settle the 30-minute closes eased to 3,956.6 in the 4:30 PM ET bar, a post-settlement print labelled as such wherever it appears.
The open, high and low on the provider's overview page now belong to the Globex session that reopened at 6:00 PM ET for Tuesday, so Monday's completed range is taken from the settlement record and the published pivot ladder. Pivot R3 at 4,095.7 minus Pivot S3 at 3,820.3, divided by three, returns 91.8, and Pivot R2 at 4,038.3 minus Pivot S2 at 3,854.7, divided by two, returns the same 91.8. Three times the Pivot Point of 3,946.5 less the 3,969.6 settle gives a high plus low sum of 7,869.9, which the pair of 3,980.8 and 3,889.0 reproduces to within the published rounding at 7,869.8, and that pair reproduces all seven published rungs. These are the completed-session inputs behind the published pivot ladder rather than an independently read bar, and they are corroborated by the provider's settlement row and the chart's completed daily bar, which carry the same 3,890.0 open, 3,980.8 high, 3,889.0 low and 3,969.6 settle.
2.2 Daily Structure
Monday traded inside Friday's 4,038.2 to 3,879.3 range, a lower high and a higher low. Settlements over the last eight sessions read 4,060.4, 4,007.9, 4,038.4, 4,074.6, 4,051.6, 4,031.4, 3,898.9 and 3,969.6, so Monday's gain followed declines of 23.0, 20.2 and 132.5. Over five sessions the contract is down 68.8 from the 4,038.4 settle of 10/26.
The weekly bar for the week of October 26 spanned 4,097.2 to 3,879.3. The provider publishes 3,879.3 as the 52-week, 13-week and one-month low and 4,242.3 as the one-month high. The February contract settled 32.7 above December, against 32.0 on Friday; its settlement was 4,002.3.
2.3 4-Hour and Swing Structure
The four-hour bars for Monday's session, read from the chart, show the 6:00 AM ET bar opening at 3,907.9 and closing at 3,974.8, a 66.9 point gain and the largest of the session's six four-hour bars. The three bars from 2:00 AM ET onward other than that one each closed beneath their opens, the 10:00 AM ET bar by 11.0 and the 2:00 PM ET bar by 7.1.
Daily ranges for the last ten sessions ran 44.8, 38.3, 127.5, 61.1, 53.1, 77.8, 60.3, 65.4, 158.9 and 91.8. The retracement grid published for Tuesday places the 38.2 percent retracement from the four-week low at 4,018.0, the 50 percent retracement of the four-week range at 4,060.8 and the 38.2 percent retracement from the four-week high at 4,103.6.
2.4 Moving Averages
The averages cited here were computed for this review from the provider's daily settlement series for the December contract, which holds 259 completed sessions from 10/22/25 through Monday; the partial row of the reopened Tuesday session is excluded, and each average is carried at full precision and rounded once to the tenth. The 5-day average stands at 4,005.2, the 9-day at 4,031.4, the 20-day at 4,105.7, the 50-day at 4,280.6, the 100-day at 4,261.9 and the 200-day at 4,587.7.
The 3,969.6 settle sits 35.6 beneath the 5-day average, 61.8 beneath the 9-day, 136.1 beneath the 20-day, 311.0 beneath the 50-day, 292.3 beneath the 100-day and 618.1 beneath the 200-day. The 5-day average fell from Friday's 4,019.0 as Monday's 3,969.6 replaced the 10/26 settle of 4,038.4, and the 20-day fell from 4,115.0 as the 10/05 settle of 4,156.8 left the window.
The 20-day average sits beneath the 50-day because the 30 older settlements in the 50-day window averaged higher, at 4,397.2. The 50-day sits above the 100-day because the 50 older settlements in the 100-day window averaged lower, at 4,243.3, and the 100-day sits beneath the 200-day because the 100 older settlements in the 200-day window averaged higher, at 4,913.4. The projection grid gives 4,016.6 as the price at which the 9-day average would be crossed on Tuesday and 4,095.8 for the 18-day.
2.5 Oscillator and Trend Readings
The oscillator figures below are as published on the provider's technical page, read at 6:24 PM ET on Monday after the Globex reopen; they are the provider's readings, not computations made for this review, and the page may already reflect the reopened session's price. The 9-day relative strength reads 35.75, the 14-day relative strength 36.07 and the 20-day relative strength 37.50.
The 9-day raw stochastic reads 31.68 percent and the 14-day raw stochastic 26.47 percent, while the 14-day stochastic %K reads 16.28 percent and the 14-day stochastic %D 19.01 percent. The 9-day directional index ADX reads 41.00 with the 9-day +DI at 8.49 and the 9-day -DI at 34.61; the 14-day directional index ADX reads 30.90 with the 14-day +DI at 10.04 and the 14-day -DI at 31.19, so negative direction leads on both. The 9-day historic volatility reads 23.82 percent and the 14-day historic volatility 21.73 percent.
The composite multi-indicator read published for the Tuesday session, quoted verbatim, is "88% SELL", with Current Strength "Strong" and Current Direction "Strongest", and the composite indicator reads "SELL". The short-term group reads "Average: 100% SELL", the medium-term group "Average: 100% SELL" and the long-term group "Average: 33% SELL". The snapshot history reads Yesterday "88% SELL", Last Week "88% SELL" and Last Month "80% SELL".
2.6 Volatility and Expected Range
The published 14-day average true range stands at 82.1 points and the 14-day average daily range at 75.9 points; the 9-day average true range is 81.9 with a 9-day average daily range of 81.6, and the 20-day average true range is 84.5 with a 20-day average daily range of 74.5. Monday's 91.8 point range was 1.21 multiples of the 14-day average daily range.
Adding and subtracting the 14-day average true range of 82.1 from the 3,969.6 settle frames Tuesday between 3,887.5 and 4,051.7. The published standard-deviation bands, built from five settlements, span 3,898.5 to 4,040.7 at one deviation, 3,869.0 to 4,070.2 at two and 3,846.4 to 4,092.8 at three. These bands describe dispersion, not intraday reach.
3. Key Levels
3.1 Resistance
Above the 3,969.6 settle, the first references are Monday's 3,980.8 high and 3,981.6, the 30 percent raw stochastic projection. Pivot R1 at 4,003.9, the 5-day average at 4,005.2 and the 10/23 settle of 4,007.9 form the next band, followed by the 9-day average crossing price at 4,016.6, the 38.2 percent retracement from the four-week low at 4,018.0 and the 9-day average at 4,031.4. Friday's 4,038.2 high, Pivot R2 at 4,038.3, the 10/26 settle of 4,038.4, one standard deviation resistance at 4,040.7, 4,049.8, the 50 percent raw stochastic projection, the 10/28 settle of 4,051.6 and the 4,051.7 average-true-range mark are the extended references, with the 10/22 settle of 4,060.4, the 50 percent retracement of the four-week range at 4,060.8, two standard deviations resistance at 4,070.2, the 10/27 settle of 4,074.6, three standard deviations resistance at 4,092.8, Pivot R3 at 4,095.7, the 18-day crossing price at 4,095.8, the 4,097.2 weekly high, the 38.2 percent retracement from the four-week high at 4,103.6 and the 20-day average at 4,105.7 beyond.
3.2 Support
Beneath the settle sit the 14-day stochastic stall level at 3,962.7, the 3,956.6 post-settlement print and the 20 percent raw stochastic projection at 3,947.5 beside the Pivot Point at 3,946.5. The published target price at 3,931.1 and the 3-10 day crossover stall level at 3,930.7 form the next band, followed by Pivot S1 at 3,912.1. Friday's 3,898.9 settle, one standard deviation support at 3,898.5, Monday's 3,890.0 open, Monday's 3,889.0 low, the 3,887.5 average-true-range mark and the 52-week low of 3,879.3 are the deeper references, with two standard deviations support at 3,869.0, Pivot S2 at 3,854.7, three standard deviations support at 3,846.4 and Pivot S3 at 3,820.3 beyond.
4. Macro Drivers
4.1 Dollar and Real Yields
The dollar index's daily record closed at 101.75 against 101.88 on Friday, and the ten-year yield index closed at 4.89 percent; Friday's close was 4.92 percent. The provider's commentary described the dollar at a one-month low after crude's decline eased inflation expectations. Gold rose 1.81 percent on a day both the dollar and nominal yields eased; the moves coincided. No real-yield series was captured for this review.
4.2 Fed and Monetary Policy
The Fed's October 28, 2026 policy decision kept rates unchanged on a 10 to 2 vote with two dissents in favour of a 25 basis point increase, per the news feed and unconfirmed. Market pricing showed a 74 percent chance of a quarter-point increase at the Fed's next meeting, per the provider's commentary and unconfirmed. The US manufacturing survey rose to 55.5 with its prices paid component at 75.2, per the provider's commentary and unconfirmed. The employment situation report is scheduled for 8:30 AM ET on Friday, November 6, 2026, as the calendar lists it.
4.3 Geopolitical Backdrop
The news feed carried at 8:30 AM ET a state media report that Iran's Supreme Leader had granted the government authority in negotiations, and in the afternoon the President's remarks that there was no rush to decide on restarting the war in Iran and a pool report at 3:03 PM ET that he said "No" to striking Iran after the elections. After the close it carried reports of explosions heard on Qeshm Island at 4:04 PM ET, with no official confirmation, and off Bandar Lengeh at 4:34 PM ET. These are reports carried by the feeds, not events confirmed for this review, and gold rose on a day the feeds carried de-escalation headlines.
4.4 China and Structural Demand (Central Bank Buying, PBOC, ETF Flows)
Central-bank purchase figures, Chinese reference rates and bullion-fund holdings were not captured for this review, so this section asserts no structural demand reading. The gold fund console's options figures appear in section 5 and are used qualitatively only.
4.5 Energy and Cross-Asset
December WTI crude fell 7.36 percent to 96.46 while the S&P 500 cash index fell 0.51 percent and the volatility index closed at 21.15; Friday's close was 19.42. Silver's December contract rose 3.27 percent to 50.888, and the gold-to-silver ratio fell to 78.01 from 79.12.
4.6 Institutional Positioning (COT, ETF Holdings, Speculator Length)
The weekly positioning report was not captured for this review. Monday's open interest on the December contract was not yet reported; Friday's stood at 269,498 per the settlement record, and Monday's December volume was 166,666 contracts against 237,470 on Friday.
5. Gold Fund Options Context (Proxy)
The gold fund's options console was read at 6:18 PM ET on Monday, after the settle, with a page date of 2026-11-02; every figure in this section is that evening read. The fund proxy is used qualitatively only and is never translated into futures prices; the fund tracks bullion at a different scale with a fee drag and has no clean basis to the December contract.
The console carried Friday's 355.96 as its previous close and showed a current price of 361.63, up 1.59 percent. Modeled call gamma reads minus 189.02 million against put gamma of plus 110.3 million, so aggregate call-side gamma is negative while put-side gamma is positive. Call volume of 227.84 thousand against put volume of 159.37 thousand and a put-to-call open-interest ratio of 0.5 show calls ahead of puts in the day's volume and open interest.
One-month implied volatility reads 23.50 percent against realised volatility of 21.14 percent, the implied-volatility rank 22.28 percent and the skew rank 19.37 percent, with an options-implied move of 5.28 dollars. The console's high and low volatility point fields are excluded.
In this review's interpretation, calls ahead of puts and a modest implied-volatility rank at that evening read, taken after the rebound, are consistent with the rebound; the read says nothing about conditions before the move. Nothing in this section is used to set a futures level; every level in this review originates in published pivot arithmetic, published standard-deviation bands, published retracement and moving-average projections, settlement averages computed from the provider's daily record, or the completed-session extremes described in section 2.1.
6. Forecast
6.1 Night Session (6:00 PM ET Monday to 3:00 AM ET Tuesday, Globex/Asia)
Globex reopened at 6:00 PM ET with the contract near the 3,956.6 post-settlement print. In this review's framing, the overnight hours carry the post-close explosion reports from the Gulf and any further diplomacy headlines. Bias neutral beneath Pivot R1 at 4,003.9, expected band roughly 3,930 to 3,990.
6.2 London Session (3:00 AM to 8:00 AM ET Tuesday)
From 3:00 AM ET European trading opens with Swiss inflation data listed at 2:30 AM ET by the news-feed calendar, unconfirmed. Bias neutral to lower beneath Pivot R1 at 4,003.9, expected band roughly 3,925 to 4,000.
6.3 Morning Session (9:30 AM to 12:00 PM ET Tuesday, US Open)
Factory orders and the JOLTS report are both scheduled for 10:00 AM ET on Tuesday, November 3, 2026, as the calendar lists it, and the JOLTS figure bears on the rate-hike pricing described in section 4.2. Expected band roughly 3,915 to 4,015, with the 4,000 to 4,010 setup band near the upper edge, its 4,010 top 5.0 beneath it.
6.4 Afternoon Session (12:00 PM to 4:00 PM ET Tuesday)
The 1:30 PM ET settlement is the reference for the midterm elections, per the news-feed calendar and unconfirmed. Expected band roughly 3,910 to 4,020.
6.5 Night Session Forward (6:00 PM ET Tuesday)
The Tuesday evening session at 6:00 PM ET carries the reaction to the midterm election results, per the news-feed calendar and unconfirmed, and the employment situation report for 8:30 AM ET on Friday, November 6, 2026, as the calendar lists it, is the next first-order US release for gold.
6.6 Expected Range (Tuesday Full Session)
Low-range scenario: 3,930 to 3,990
Mid-range scenario (most likely): 3,910 to 4,020
High-range scenario: 3,880 to 4,050
6.7 Most Likely Path
In this review's analyst judgment the most probable path holds the contract between Pivot S1 at 3,912.1 and the 38.2 percent retracement at 4,018.0, with a further test toward Pivot R1 at 4,003.9 and the 5-day average at 4,005.2 that stalls beneath the 9-day average at 4,031.4 weighted above a sustained recovery through one standard deviation resistance at 4,040.7. The composite stays at "88% SELL" with strength "Strong", negative direction leads on both directional systems and the settle sits beneath every settlement average, while Monday's settle at 87.8 percent of its range left the close 11.2 points beneath the session high.
The alternative that would invalidate this reading is a settle above one standard deviation resistance at 4,040.7, which would bring the 50 percent retracement at 4,060.8 into play and suggest Friday's low at 3,879.3 marked a turn. On the other side, a move beneath Pivot S1 at 3,912.1 before any rebound would bring Monday's 3,889.0 low and the 52-week low of 3,879.3 into play without the rebound the setup needs.
7. Tuesday Economic Calendar
Monday's releases are complete. Construction spending, released at 10:00 AM ET on Monday, November 2, 2026, as the calendar lists it, fell 1.9 percent against an expected gain, per the provider's commentary and unconfirmed. The US manufacturing survey rose to 55.5, per the provider's commentary and unconfirmed. Gold settled at 1:30 PM ET, and results from two large technology companies were released after the cash close on Monday, November 2, 2026, as the calendar lists it.
On Tuesday, November 3, 2026, factory orders and the JOLTS report are scheduled for 10:00 AM ET, both as the calendar lists it, and a chipmaker's results are due the same day, as the calendar lists it, which lists them for the date only. The midterm elections take place on Tuesday, per the news-feed calendar and unconfirmed.
Later in the week, the trade report is scheduled for 8:30 AM ET on Wednesday, November 4, 2026, preliminary productivity and costs for 8:30 AM ET on Thursday, November 5, 2026, and the employment situation report for 8:30 AM ET on Friday, November 6, 2026, all as the calendar lists it. In this review's judgment the first-order scheduled event for gold on Tuesday is the JOLTS report at 10:00 AM ET, given the rate-hike pricing, with the midterm elections, per the news-feed calendar and unconfirmed, the main unscheduled source of volatility.
8. Primary Trade Setup
Direction: Short
Rationale: The composite stays at "88% SELL" with strength "Strong", negative direction leads on both directional systems, and the settle sits beneath every settlement average after a rebound that traded inside Friday's range. A further rise into the 4,000 to 4,010 band around Pivot R1 at 4,003.9 and the 5-day average at 4,005.2 offers a short with a defined risk point above the 4,018.0 retracement. Monday's strong close can extend, so the setup is an analyst judgment that rebounds beneath the short averages are sold, not a measured edge.
Entry Zone: 4,000 to 4,010
Stop Loss: 4,030 (above the 4,018.0 retracement from the four-week low and beneath the 9-day average at 4,031.4)
Target 1 (T1): 3,980 (beneath the 3,981.6 stochastic projection and Monday's 3,980.8 high)
Target 2 (T2): 3,955 (above the Pivot Point at 3,946.5)
Target 3 (T3, extended): 3,930 (1.1 beneath the published target price of 3,931.1)
Risk-to-Reward: Approximately 1:1 to T1, 1:2 to T2, 1:3 to T3
Invalidation: A settle above one standard deviation resistance at 4,040.7 negates the thesis. Short of that, the edge is removed by acceptance above the entry band, defined as two consecutive 30-minute closes above 4,010; a touch alone does not remove it.
Macro override: A JOLTS figure read as reducing the chance of a rate increase, or a further decline in the dollar, would support gold. In that scenario a move through the 4,030 stop invalidates the short before the targets, and one standard deviation resistance at 4,040.7 becomes the reference, 10.7 beyond the stop and inside one 14-day average true range of 82.1.
Sources and methodology
This outlook is built from our session review of the December gold contract, the December ’26 contract, prepared after Monday's close on November 2, 2026 for the Tuesday, November 3, 2026 session. Monday's completed extremes are the inputs behind the published pivot ladder for Tuesday: Pivot R3 at 4,095.7 less Pivot S3 at 3,820.3, divided by three, and Pivot R2 at 4,038.3 less Pivot S2 at 3,854.7, divided by two, both return 91.8, and three times the 3,946.5 Pivot Point less the settle gives 7,869.9, which the 3,980.8 high and the 3,889.0 low reproduce to within the published rounding at 7,869.8. The provider's settlement row and the chart's completed Monday bar carry the same open, extremes and settle. Only those figures, the dated 2026-11-02 row of the provider's daily record, Monday's 30-minute bars and the review's statements are used to grade Monday's card. The 30-minute bars run from the Sunday 6:00 PM ET reopen to the bar that opened at 4:30 PM ET on Monday, labelled in Eastern standard time; each timed statement here names the bar in which a price first traded. The provider's overview open, high and low belong to the Tuesday session that reopened at 6:00 PM ET and are not used.
Friday's 2026-10-30 row has been revised since our Monday outlook: volume now reads 237,470 contracts against the preliminary 230,038, and open interest 269,498, which that outlook listed as not yet reported; Friday's prices are unchanged. Monday's open interest was not yet reported, so none is stated. The partial row of the reopened Tuesday session is excluded from every count and average. The moving averages were computed from the provider's daily settlement series of 259 completed sessions through Monday and rounded once to the 0.1 tick; the oscillators and range measures are cited as published, read at 6:24 PM ET on Monday after the Globex reopen, and the composite strings are quoted verbatim. The gold fund is a proxy used qualitatively; its gamma figures are modeled, its high and low volatility point fields were not used, and no fund level is translated into a futures price. The percent change for the dollar index, the volume and open interest changes and the fund's implied move as a percent are computed from the stated figures. Scenario ranges are analyst judgment, and items marked unconfirmed come from the news-feed calendar, the news feed or provider commentary.
Monday’s outlook for this contract is here, and the crude oil contract’s Monday outlook covers the December WTI contract, which settled at 96.46 on Monday, down 7.36 percent. Outlooks for ES, NQ, GC and CL are collected on the market outlook page, and our forward trading record is on the performance statement.