
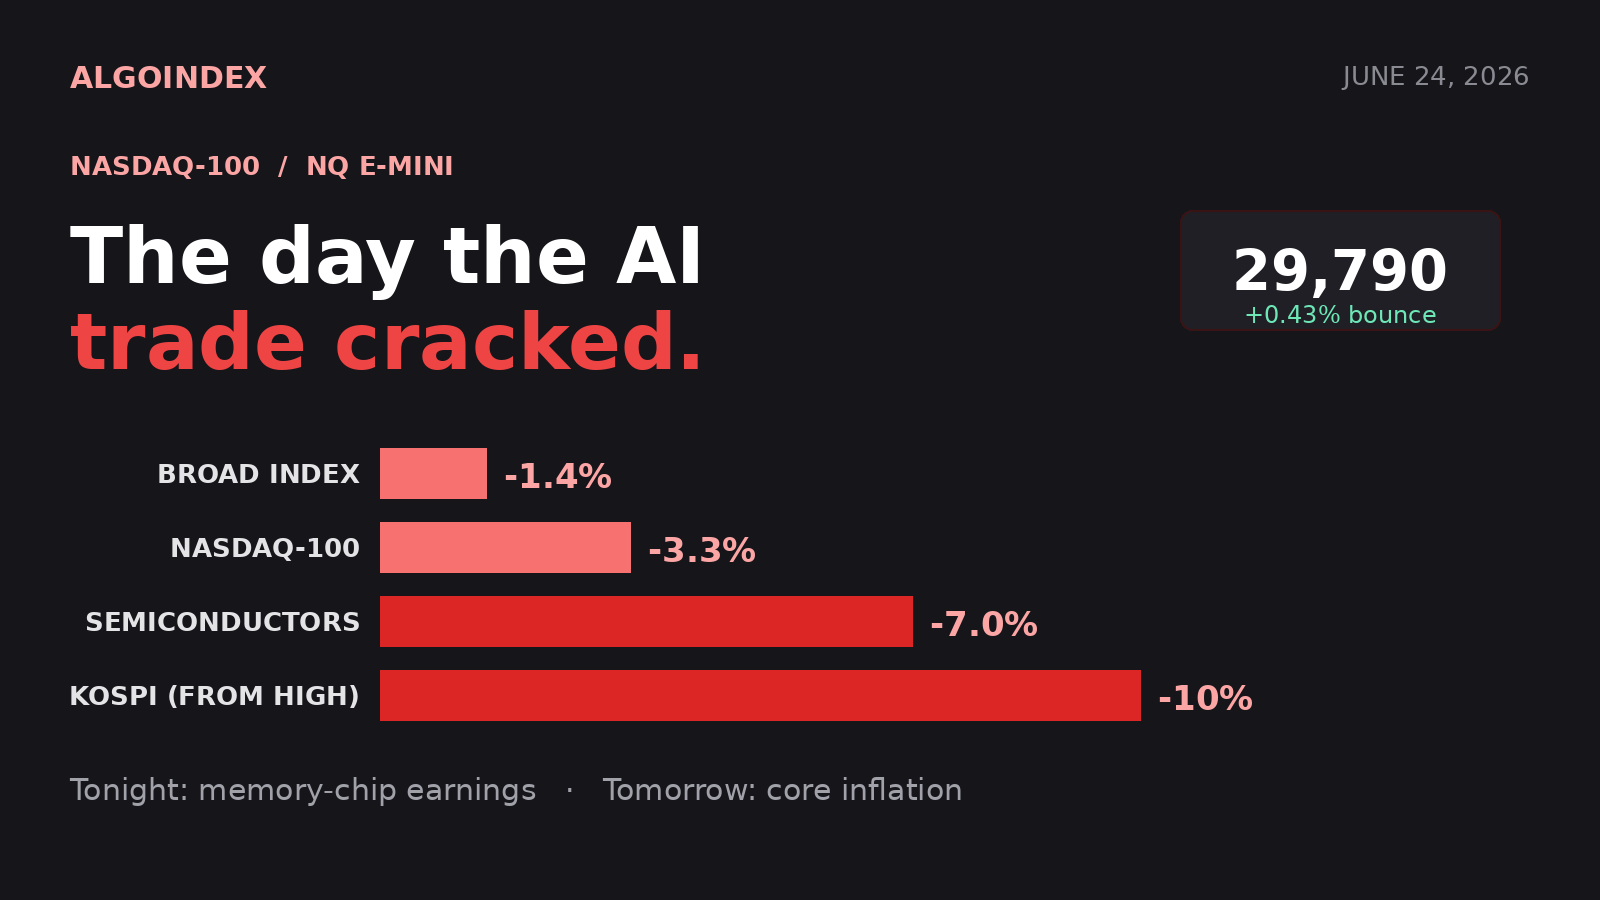
Tuesday was the day the artificial-intelligence trade cracked. The Nasdaq-100 dropped 3.3%, the semiconductor group sank 7%, and overnight in Asia South Korea's Kospi fell roughly 10% from its record high. This morning the index is attempting to stabilize near 29,790, up about 0.43%, but the bounce reads as cautious repair, not conviction, with a memory-chip bellwether reporting tonight and a core inflation print tomorrow.
The continuous front-month contract trades up roughly 127 points against Tuesday's 29,666.00 settle, after an overnight band of about 29,774 to 29,851. The overnight high near 29,851 is the first hurdle bulls must clear to argue the bounce has legs. The structural contradiction is the gap between trend and momentum: on a longer horizon the index remains above its 50-, 100-, and 200-day averages, so the multi-month uptrend is intact, but on a short horizon price has broken below its 5- and 20-day averages and below the computed daily pivot near 29,981, on a dealer-positioning backdrop that sits in net negative gamma.
Tuesday's decline was led by the largest AI-linked names and by the semiconductor group, with single-stock flow showing heavy longer-dated call selling, which forces dealers who are short those calls and long the underlying shares to sell stock to stay hedged. Those mechanical flows added to the downside. Sentiment readings flag rising AI jitters, and with the memory-chip bellwether reporting after the close, today's price action is best understood as positioning into that result rather than a fresh directional thesis.
A decision area, with averages split
Price closed Tuesday well off the highs and now sits almost exactly on the 50% retracement of the four-week high-to-low span, computed near 29,804, which makes this a true decision area: holding above keeps the larger uptrend's benefit of the doubt, while losing it opens room toward the lower half of the range. The 5-day average near 30,172 and the 20-day near 30,211 now act as overhead resistance, while the 50-day near 29,119, the 100-day near 27,113, and the 200-day near 26,518 remain well underneath. Momentum is squarely neutral, with nine-day relative strength near 47, fourteen-day near 50, and twenty-day near 53, so there is no oversold tailwind for dip buyers and no overbought warning for sellers. The multi-indicator composite reads a weak 24% buy, best interpreted as a market with no clean directional edge.
The first overhead reference is the overnight high near 29,851, followed by the computed pivot at 29,981, the single most important intraday line, with the 18- and 9-day average crosses near 30,205 to 30,240 above it. Immediate support is the overnight low near 29,774 and the 29,804 retracement base, then Tuesday's low shelf near 29,585, the first pivot support at 29,262, and deeper toward the one-month low at 28,508, a level whose break would mark a meaningful change of character.
Negative gamma, and two catalysts ahead
Dealer-positioning context, read through the Nasdaq exchange-traded fund proxy near 716 against a prior close near 738, shows call gamma roughly negative 303 million and put gamma roughly negative 1.2 billion, a net negative posture that mechanically amplifies intraday moves in both directions; rallies and selloffs both tend to extend rather than mean-revert. The primary upside gamma concentration sits near 747 on the proxy, a magnet-and-resistance zone on any strong recovery. Positioning data show the equity complex printed its most negative single-day delta reading of the past thirty days, dominated by longer-dated call selling, while the proxy saw roughly negative 3.6 billion dollars of delta driven by longer-dated put buying. Institutions have been adding downside protection and trimming upside exposure into the catalysts.
The conditional path is a reclaim-and-continuation long: a decisive reclaim of the 29,981 pivot that holds on a retest after 09:45 ET, entering 29,981 to 30,010 with a stop below 29,800 and targets at 30,150 then 30,205, lower conviction because the short-term averages overhead cap the upside. Stand aside through the 10:00 ET new home sales reaction, and do not carry fresh swing exposure into the after-close earnings. The base case is a choppy, two-sided session that compresses into the report, with sellers defending the 29,890 to 29,981 shelf and a roughly even split between a fade-the-bounce rotation toward 29,585 and a reclaim-and-grind toward 30,150.
The complete data picture
For readers who want the full structure rather than the summary, here is the entire computed level map and the complete set of momentum, volatility, and positioning readings behind today's view.
Market-wide desk levels (cash index): resistance 7,400 and 7,500, the 7,475 risk pivot broken to the downside, support 7,330 and 7,150, and a deeper 7,000 magnet tied to a large strike into the end-of-month expiration, with a base case of a 1 to 2% correction.
| EXPECTED RANGE TODAY | |
| Low | about 29,400 |
| Most-likely center | 29,750 to 29,950 |
| High | about 30,150 |
A close above 29,981 is a bullish tell; a close below 29,585 signals renewed distribution. Implied one-day band about 480 points.
Full session calendar. Current Account at 8:30; New Home Sales at 10:00 (prior about 0.622M); weekly EIA crude inventories at 10:30; a 5-year Treasury note auction at 1:00; the memory-chip bellwether after the close; and the core inflation print tomorrow pre-market.
AlgoIndex publishes computed levels and dealer-positioning context every session. Review the performance statement, learn the method in our trading signals guide, compare strategies on the pricing page, and track every entry with the free AI Trading Journal.
Latest session: The AI Trade Roars Back: Nasdaq-100 Gaps 2% on Chip Earnings →
Foundational guides
New to Nasdaq 100 futures? Start with What Are NQ Futures, the ES, NQ, MES & MNQ point value and contract specs, QQQ gamma exposure (GEX), and market internals: TICK, ADD, VOLD and VIX.



