At the Thursday 6:00 PM ET reopen the December Nasdaq-100 contract opened at 29,180.00, 300.00 points beneath the short band we published for Friday. That first print was the session high. The band never traded. Within the first half hour the contract had already traded through the card's extended third target, and the low came in the 30-minute bar that opened at 2:30 PM ET on Friday.
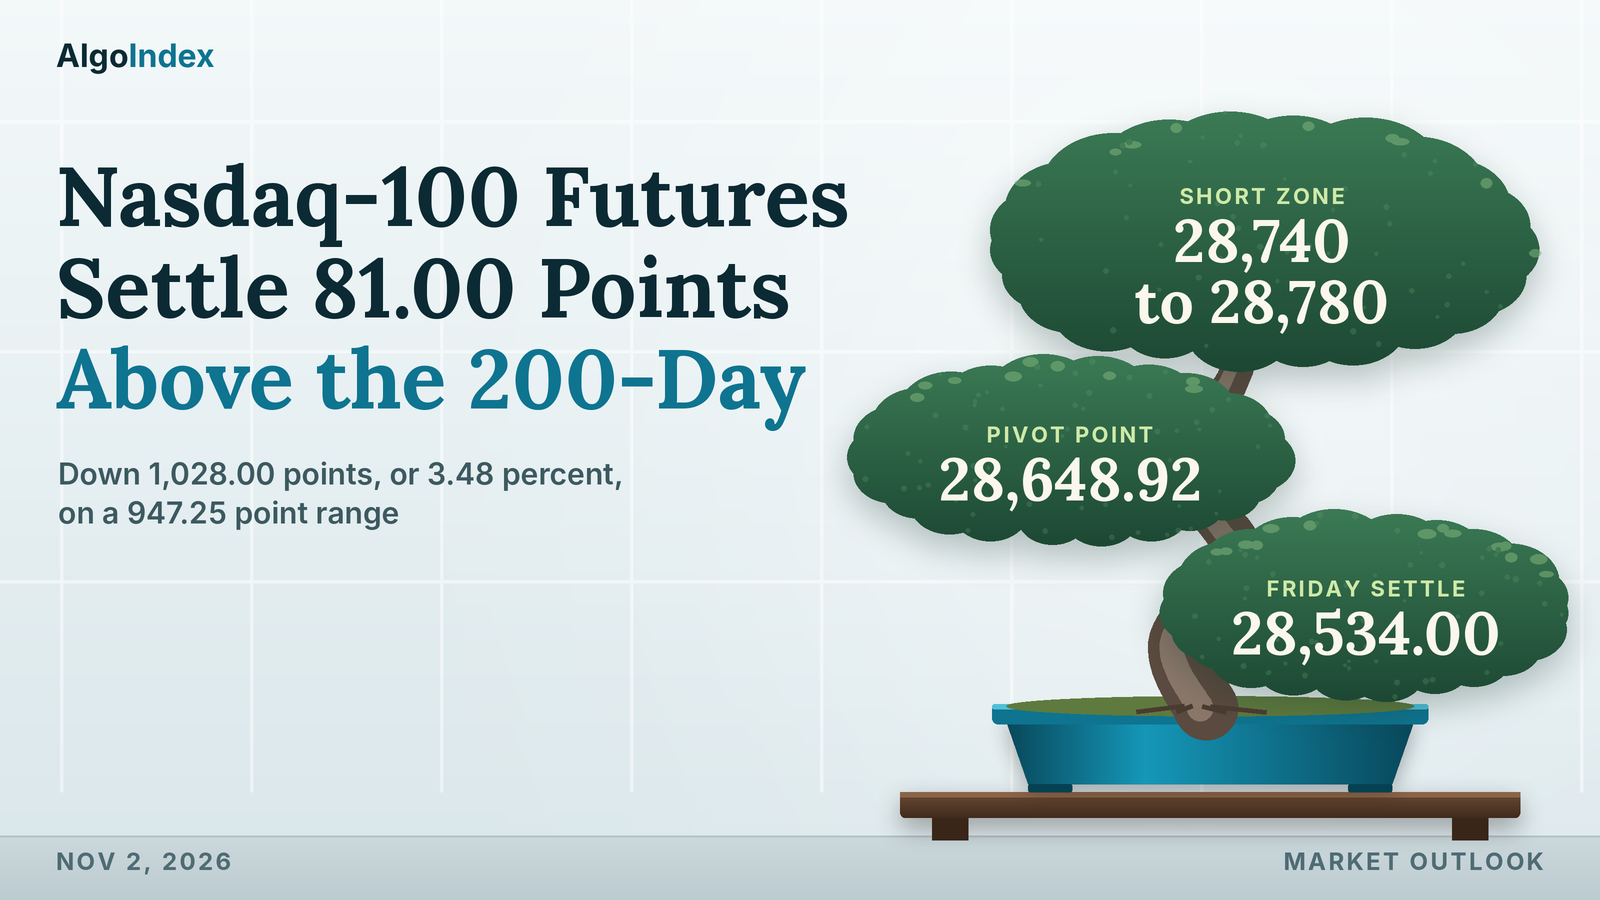
The contract settled at 28,534.00, down 1,028.00 points, or 3.48 percent, at 31.8 percent of a 947.25 point range. It was the largest one-day decline since 06/05/26. The Nasdaq-100 cash index fell 3.46 percent to 28,384.85 and the semiconductor index 7.20 percent, against 1.82 percent for the S&P 500 cash index. Monday's map sits above the settle.
December Nasdaq-100 futures settled at 28,534.00 on Friday, down 1,028.00 points, with a lower high and a lower low. It was the largest decline since 06/05/26. Friday's published short band at 29,480 to 29,520 never traded. The open at the Thursday 6:00 PM ET reopen was the session high, 300.00 points beneath it. Neither the 29,630 stop nor the 29,370 and 29,240 targets traded; the 29,110 third target traded in the first 30-minute bar, and with the band untouched the card never came into play. The settle sits beneath every settlement average from the 5-day to the 100-day and 81.00 points above the 200-day. The primary setup for Monday is a short from 28,740 to 28,780, a band above the settle that holds the 28,767.40 projection, stop 28,900, targets 28,620, 28,480 and an extended 28,340. Globex reopens at 6:00 PM ET on Sunday, after daylight saving time ends, as the calendar lists it.
Friday’s card: the band stayed 300.00 points out of reach and the stop never traded
In Friday’s outlook we set a short from 29,480 to 29,520, stop 29,630. Its targets sat at 29,370, 29,240 and an extended 29,110. Friday's bar, from the review and the provider's 2026-10-30 settlement row, opened at 29,180.00 at the Thursday 6:00 PM ET reopen, marked a low of 28,232.75 and settled at 28,534.00. The open was also the high. So the band was never reached. Its bottom sat 300.00 points above the session's highest print.
The stop sat 450.00 points above the high. The first two targets never traded either. Their prices sat 190.00 and 60.00 points above the high. The extended third did trade, in the very first 30-minute bar: the bar that opened at 6:00 PM ET on Thursday reached 29,090.25, beneath 29,110. A short from the band needed the band to trade first, so no fill and no result are asserted. The low went 877.25 points beneath that third target. The settle finished 576.00 beneath it.
The card's other tests were never close. Its invalidation needed a settle above the published target price at 29,610.22. The settle finished 1,076.22 points beneath that line. Its acceptance test needed two consecutive 30-minute closes above 29,520. The 30-minute series rules that out. The highest close of the session, 29,110.25 in the bar that opened at 7:30 PM ET on Thursday, sat 409.75 points beneath the line.
Its macro override named a cash-session reversal of the after-hours declines in an online retailer and a processor maker, described in market commentary, or a labour-cost reading taken as easing pressure on rates. Its reference, the 29,673.49 flip-level equivalent, did not trade. The high stopped 493.49 points beneath it. The employment cost index came at 8:30 AM ET, as the calendar lists it; per the news-feed calendar and unconfirmed, it rose 0.8 percent, in line with the forecast. The provider's commentary tied Friday's decline to the two companies' results and to a press report on an artificial-intelligence developer's credit rating. That is attributed commentary, and this article ties no price move to it.
This time the 30-minute series lets each session band be scored over its own window. None held its low. All three scenario cases held the 29,180.00 high. The most likely case of 28,900 to 29,620 missed the low by 667.25 points. The high-range case of 28,500 to 29,870 came closest, 267.25 short at the bottom, and the low-range case of 29,050 to 29,500 missed by 817.25. The night band of 28,980 to 29,500, scored from 6:00 PM ET to 3:00 AM ET, held the night's 29,180.00 high but missed its 28,821.50 low by 158.50. London's 28,950 to 29,520, from 3:00 AM to 8:00 AM ET, missed its 28,762.75 low by 187.25.
The two cash-hours bands missed outright. From 9:30 AM to 12:00 PM ET the contract traded between 28,610.75 and 28,860.50. The morning band of 28,900 to 29,620 never traded; its bottom sat 39.50 above that window's high. From 12:00 PM to 4:00 PM ET the range ran 28,232.75 to 28,670.25, and the afternoon band of 28,800 to 29,650 sat 129.75 above that high.
The most probable path, an analyst judgment, kept the contract between Pivot S2 at 28,805.83 and the published target price at 29,610.22. It weighted a failed rebound toward the Pivot Point at 29,489.08. No rebound came near that Pivot Point. The open, also the session high, sat 309.08 points beneath it. The range did not hold. The low went 573.08 beneath S2, and the settle finished 271.83 beneath it. The downside alternative named a fall through two standard deviations support at 29,088.83 at the cash open, bringing the 28,987.00 one-month low and Pivot S2 into play. All three gave way before the cash open: 29,088.83 in the 6:30 PM ET Thursday bar, 28,987.00 in the 8:30 PM ET bar and S2 in the 7:30 AM ET Friday bar. The upside alternative never came close.
A 149.15 point basis, a band above the settle and five averages overhead
The basis narrowed to 149.15 points, the 28,534.00 settle less the 28,384.85 cash close, from 159.49 on Thursday. The review converts six positioning levels at it. The NDX 28,000 put side support base becomes 28,149.15 and the NDX 28,785 combination level 28,934.15. The modeled gamma-flip level at NDX 29,327 becomes 29,476.15, and the modeled volatility threshold at NDX 29,550 becomes 29,699.15. The NDX 29,675 strike, home of the largest gamma concentration and the call side ceiling, becomes 29,824.15. The NDX 29,000 key level becomes 29,149.15. The conversions are the review's own. Only the first sits beneath the settle.
Resistance starts 114.92 points up, at the Pivot Point at 28,648.92. The 20 percent raw stochastic projection at 28,767.40 follows; it sits inside Monday's short band. Then come the 28,934.15 combination equivalent, the 30 percent projection at 29,034.72, Pivot R1 at 29,065.08 and one standard deviation resistance at 29,095.71. Thursday's 29,111.00 low is next. Three levels sit within 30.85 points: the 29,149.15 key-level equivalent, the one-ATR line at 29,152.58 and Friday's 29,180.00 open and high.
Higher up sit the 14-day %K stall level at 29,267.91 and two standard deviations resistance at 29,328.37. Then a tight knot. The 9-day crossing price at 29,448.94, the 5-day average at 29,465.00, the 9-day average at 29,474.00 and the 29,476.15 flip equivalent sit within 27.21 points. Three standard deviations resistance at 29,506.90, the 38.2 percent retracement from the four-week low at 29,525.34, Thursday's 29,562.00 settle and Pivot R2 at 29,596.17 follow. The 29,699.15 threshold equivalent, Thursday's 29,794.25 high and the 29,824.15 concentration equivalent come next. The 50 percent retracement of the four-week range at 29,924.63, the 100-day average at 29,935.75 and Pivot R3 at 30,012.33 close the ladder. Beyond it sit the 50-day at 30,065.75, the 20-day at 30,134.00 and this week's 30,178.00 high. The 31,616.50 52-week high of 10/06 caps the list, 3,082.50 points up.
Support starts 45.12 points down, at the 61.8 percent retracement from the 52-week low at 28,488.88. The 200-day average at 28,453.00 sits 35.88 beneath it. Friday's 28,232.75 low, now the one-month and 13-week low, follows, then the published target price at 28,196.83. The 28,149.15 put-base equivalent and Pivot S1 at 28,117.83 sit 31.32 apart. Beneath them come one standard deviation support at 27,972.29, the one-ATR line at 27,915.42 and the 3-10 day crossover stall level at 27,902.71. Two standard deviations support at 27,739.63, Pivot S2 at 27,701.67, three standard deviations support at 27,561.10 and the 50 percent retracement of the 52-week range at 27,522.75 are the extended references. Pivot S3 sits at 27,170.58.
Five averages sit overhead. The settle sits 931.00 points beneath the 5-day at 29,465.00, 940.00 beneath the 9-day at 29,474.00, 1,401.75 beneath the 100-day at 29,935.75, 1,531.75 beneath the 50-day at 30,065.75 and 1,600.00 beneath the 20-day at 30,134.00. Only the 200-day, at 28,453.00, sits beneath it, by 81.00. The review computed the averages from 260 completed daily settlements and rounded each once to the 0.25 tick. The 5-day fell 116.75 from Thursday's 29,581.75 as the 10/23 settle of 29,117.75 left the window. The 20-day fell 126.25 from 30,260.25 as the 10/02 settle of 31,061.75 dropped out. Older settlements sit lower. The 30 older ones in the 50-day window averaged 30,020.41, the 50 older ones in the 100-day window 29,805.92 and the 100 older ones in the 200-day window 26,970.28. Monday's 9-day crossing price is 29,448.94, 914.94 points above the settle.
Momentum sits low on its scale. Relative strength reads 29.99 on the 9-day, 34.26 on the 14-day and 37.91 on the 20-day. The raw stochastics read 15.49 percent on the 9-day and 11.27 percent on the 14-day. The 14-day %K at 26.45 percent sits 4.09 points beneath %D at 30.54 percent. Sellers lead both windows. On the 9-day, negative direction at 38.27 tops positive at 14.01 by 24.26, with the ADX at 35.35; on the 14-day, 34.68 tops 15.00 by 19.68, with the ADX at 25.91. Historic volatility reads 26.50 percent and 24.72 percent. These readings are as published, read at 6:24 PM ET on Friday with Globex closed for the weekend.
A composite multi-indicator read published for Monday sits at 56 percent sell, with strength described as strong and direction as strengthening, against 16 percent sell in the prior session's snapshot. A week ago it also read 56 percent sell. A month ago, 80 percent buy. The short-horizon group averages 60 percent sell, the medium 50 percent sell and the long 33 percent sell.
Friday's bar opened at its high. The settle finished 646.00 points beneath the 29,180.00 open and 301.25 above the low. The high sat 614.25 points beneath Thursday's and the low 878.25 beneath Thursday's. The 947.25 point range was 1.49 times the 14-day average daily range of 634.88. The 14-day average true range stands at 618.58 points; the 9-day figures are 674.98 and 608.00 and the 20-day figures 585.40 and 570.97. The week opened at 29,268.00 and closed at 28,534.00, between 30,178.00 and 28,232.75. Against the prior week's 30,113.00 high and 28,987.00 low, that is a higher high and a lower low.
One average true range either side of the settle spans 27,915.42 to 29,152.58. The deviation bands, built from five settlements and centred on the settle, run 27,972.29 to 29,095.71, 27,739.63 to 29,328.37 and 27,561.10 to 29,506.90. They describe settlement dispersion only. Ten sessions of daily ranges read 757.50, 511.75, 385.50, 960.25, 339.00, 548.00, 593.25, 503.75, 683.25 and 947.25 points. The settlement changes over those sessions net to minus 857.50. Over five sessions the contract is down 583.75 points from the 29,117.75 settle of 10/23. The four-hour bars closed at 28,865.50, 28,979.75, 28,889.75, 28,842.00, 28,394.50 and 28,543.00. The one that opened at 10:00 AM ET fell furthest, from 28,841.75 to 28,394.50.
A 3.46 percent cash decline, a 7.20 percent chip slide and results after Thursday’s close
Technology led the decline. The Nasdaq-100 cash index closed at 28,384.85, down 1,017.66 points or 3.46 percent, after trading between 28,713.45 and 28,093.25. The S&P 500 cash index fell 1.82 percent and the Dow industrials 1.09 percent, so technology fell 1.64 percentage points more than the broad index. The semiconductor index fell 7.20 percent to 10,688.80. The provider's commentary noted that 12 of the 30 Dow components closed higher. In the review's reading, the rotation away from technology that the feeds described on Thursday continued, now with semiconductors leading the decline.
Results came first. An online retailer and a processor maker reported after the close on Thursday, October 29, as the calendar lists them. The news feed headlined both as disappointing. The news feed carried at 4:07 PM ET on Friday an item, unconfirmed, that the processor maker's shares fell 29 percent, their worst day in at least four decades. The provider's commentary tied Friday's decline to those results and to a press report on an artificial-intelligence developer's credit rating. These are reports carried by the feeds and attributed commentary.
Other items ran through the session. At 12:46 PM ET the news feed carried a press report that an artificial-intelligence developer may not secure an investment-grade rating after its listing. A regulator's statement followed. At 1:49 PM ET the feed carried a statement from the SEC's enforcement director that the agency is examining artificial-intelligence disclosures. At 3:25 PM ET it carried an item that large technology companies hold 3 trillion dollars in spending commitments for artificial-intelligence infrastructure. These are reports carried by the feeds. This article ties no price move to any of them.
Yields eased. The ten-year yield index closed at 4.93 percent, against 4.98 percent on Thursday. The employment cost index was released at 8:30 AM ET, as the calendar lists it, and per the news-feed calendar and unconfirmed it rose 0.8 percent, in line with the forecast. In the review's interpretation, lower yields that did not support technology mark the decline as earnings-driven rather than rate-driven. No real-yield series was captured, so no real-yield level is asserted.
The news feed carried reports of tanker incidents in the Strait of Hormuz and of the President's remark at 4:01 PM ET that “there are talks” with Iran. December WTI crude rose 2.08 percent to 104.12. The provider's commentary cited higher oil prices and a 6.3 billion dollar theft at a cryptocurrency exchange among the day's pressures. These are reports carried by the feeds and attributed commentary. December gold fell 3.29 percent. The dollar index's daily record eased to 101.88 from 102.04. The volatility index closed at 19.42 against 17.20, after a session high of 23.93.
The cash close sits beneath every positioning line but one. The dealer-positioning dataset's reference prices are Thursday's closes. NDX 29,402 corresponds to Thursday's 29,402.51 cash close, and QQQ 715 to the fund console's previous close of 715.34. Against Friday's 28,384.85 close, the index sits 942.15 points beneath the 29,327 modeled gamma-flip level. It sits 1,165.15 beneath the 29,550 modeled volatility threshold and 1,290.15 beneath 29,675. That strike holds the largest gamma concentration and the call side ceiling. The 28,000 put side support base sits 384.85 points beneath the close. The index model's gamma tilt reads 0.981 and its gamma notional plus 949.405 thousand dollars, both model outputs. That is close to flat. The dataset lists 29,675, 30,000, 29,000 and 29,200 as key index strikes. Its combination levels are 28,785, 28,991, 29,197 and 27,962.
On the QQQ proxy the call side ceiling sits at 723, the modeled volatility threshold and the largest gamma concentration at 720, the modeled gamma-flip level at 719 and the put side support base at 700. Those are proxy levels. The fund's gamma tilt reads 0.620 and its gamma notional minus 721.507 million dollars, proxy model outputs. The console, read at 6:19 PM ET, carried Thursday's 715.34 as its last close and a current price of 690.59, down 3.46 percent and 9.41 beneath the 700 put side base. On the console, call gamma reads minus 1.64 billion against put gamma of minus 2.64 billion. One-month implied volatility reads 20.90 percent against realised volatility of 19.21 percent, 1.69 points apart. The implied-volatility rank reads 41.14 percent and the put-to-call open-interest ratio 1.38.
In the review's interpretation, drawn from the index model and the QQQ fund proxy, both model outputs, a close more than 900 points beneath the flip level, with fund gamma negative and the fund beneath its put side base, describes an environment in which dealer hedging is more likely to extend moves than to damp them. Gamma stays a damping lens here. It carries no direction. The modeled threshold and flip level are model outputs, not option strikes, and no directional read is drawn from options volume or modeled gamma. Monday's band sits beneath the 29,476.15 flip equivalent and above the 28,149.15 put-base equivalent.
Activity jumped. Volume reached 1,023,028 contracts on the 2026-10-30 row, against Thursday's 806,178 on the 2026-10-29 row, a figure revised from the 794,700 carried in Friday's outlook. Open interest reads 268,077 on that 2026-10-29 row, which Friday's outlook listed as not yet reported. That is 435 above the 267,642 on the 2026-10-28 row. Friday's figure is not yet reported. The weekly positioning report released after Friday's close covers the week of October 27. Its Nasdaq-100 table was not captured, so no figure from it is carried.
The trade map for Monday
The primary setup is a short from 28,740 to 28,780. The composite reads 56 percent sell, with direction described as strengthening. Negative direction leads on both directional systems. Friday printed the largest decline since 06/05/26, and the settle sits beneath every average except the 200-day. The whole band sits above the settle. Its bottom sits 206.00 points up and its top 246.00. It holds the 20 percent raw stochastic projection at 28,767.40, 27.40 above its bottom and 12.60 beneath its top. The Pivot Point at 28,648.92 sits 91.08 beneath it.
Then the stop. At 28,900 it sits 120 points above the band top and 34.15 beneath the 28,934.15 combination-level equivalent. The first target, 28,620, also sits above the settle, 86.00 points up and 28.92 beneath the Pivot Point. The second, 28,480, sits 8.88 beneath the 61.8 percent retracement at 28,488.88 and 27.00 above the 200-day average. Then the extended third. At 28,340 it sits 107.25 above Friday's 28,232.75 low and 194.00 beneath the settle. The setup needs a rebound into the band. The 9-day relative strength reading of 29.99 leaves room for a sharp one, so the review calls the setup an analyst judgment that rebounds are sold, with no measured edge behind it.
Now the arithmetic. From the 28,760 midpoint the risk to the stop is 140 points, 22.6 percent of the 14-day average true range of 618.58. The targets sit 140, 280 and 420 points beneath the midpoint. Exact multiples. The first target sits 120 points beneath the band bottom and 86.00 above the settle. The second sits 54.00 beneath the settle. The third sits 194.00 beneath it.
The scenario ranges are analyst judgment. The low-range case runs 28,250 to 28,800 and the most likely 28,100 to 28,950. The high-range case runs 27,740 to 29,330, within 0.37 and 1.63 points of the two-deviation band. Then the sessions. Globex reopens at 6:00 PM ET on Sunday, and the review expects roughly 28,250 to 28,800 through the night, with a lower bias beneath the Pivot Point at 28,648.92. Gap references sit at and above the settle at 28,534.00, 28,648.92 and 28,767.40, and beneath it at 28,488.88, 28,232.75 and 28,149.15. London follows from 3:00 AM ET at 28,200 to 28,850, bias neutral to lower beneath the Pivot Point. The morning band runs 28,150 to 28,900. The setup band sits in its upper half, its top 120.00 points beneath the band's top, which equals the stop. The afternoon band runs 28,100 to 28,950, its top 50.00 above the stop.
Monday's calendar starts on Sunday. US daylight saving time ends at 2:00 AM ET on Sunday, November 1, as the calendar lists it, so Monday's clock times are standard time. Globex reopens at 6:00 PM ET that evening. Two days of headline exposure separate Friday's settle from the reopen. Manufacturing surveys are listed for Monday morning, and a US manufacturing survey for Monday, per the news-feed calendar and unconfirmed. The cash session opens at 9:30 AM ET. Construction spending is scheduled for 10:00 AM ET and the senior loan officer survey for 2:00 PM ET, as the calendar lists them. The calendar lists results from a consumer-electronics maker and a data-analytics software group for Monday, November 2, for the date only; the time is not confirmed. Tuesday's midterm elections are listed per the news-feed calendar and unconfirmed.
One path is weighted. In the review's analyst judgment the most probable path holds the contract between two standard deviations support at 27,739.63 and Pivot R1 at 29,065.08. Within it, a rebound toward the Pivot Point at 28,648.92 that fails beneath the 28,934.15 equivalent is weighted above a sustained recovery. No measured frequency backs it. The alternative is a settle above Pivot R1, which would open Friday's 29,180.00 high and the 29,476.15 flip-level equivalent. On the other side, a reopen beneath Friday's 28,232.75 low would bring the 28,149.15 put-base equivalent and Pivot S1 at 28,117.83 into play without the rebound the setup needs. In the review's judgment the first-order event on Monday is the cash open at 9:30 AM ET after Friday's semiconductor decline.
Monday's band sits between Friday's settle, 206.00 points beneath its bottom, and Pivot R1, 285.08 points above its top.
The complete data picture
Every number behind Monday’s plan, charted first, then the full level lists, then the complete numeric reference underneath.
Full numeric reference, every remaining figure from the session review
1. Executive Summary
The December Nasdaq-100 contract settled at 28,534.00 on Friday, down 1,028.00 or 3.48 percent from Thursday's settle of 29,562.00, after trading between 29,180.00 and 28,232.75, a 947.25 point daily range. The settle finished at 31.8 percent of the range, and the range was 1.49 multiples of the published 14-day average daily range of 634.88 points. Friday's high sat 614.25 beneath Thursday's 29,794.25 high and Friday's low sat 878.25 beneath Thursday's 29,111.00 low, a lower high and a lower low. The 1,028.00 point decline was the largest one-day decline since the 1,477.25 point decline of 06/05/26, the 947.25 point range the widest since 960.25 on 10/22/26, and the settle the lowest since 28,518.00 on 07/30/26.
The Nasdaq-100 cash index closed at 28,384.85, down 1,017.66 or 3.46 percent, against a 1.82 percent decline for the S&P 500 cash index, so technology fell by 1.64 percentage points more than the broad index. The semiconductor index fell 7.20 percent. The news feed carried at 4:07 PM ET an item, unconfirmed, that the processor maker's shares fell 29 percent, their worst day in at least four decades. A processor maker and an online retailer reported after the close on Thursday, October 29, 2026, as the calendar lists them, and the provider's commentary tied Friday's decline to those results and to a press report on an artificial-intelligence developer's credit rating. These are reports carried by the feeds and attributed commentary.
The volatility index closed at 19.42; Thursday's close was 17.20. The ten-year yield index eased to 4.93 percent, so the decline came without a rise in yields.
The composite multi-indicator read is "56% SELL", with strength "Strong" and direction "Strengthening", against "16% SELL" in the prior session's snapshot. The settle sits beneath the 5-day, 9-day, 20-day, 50-day and 100-day settlement averages and 81.00 points above the 200-day. The Primary Setup below is a short from the 28,740 to 28,780 band, stopped at 28,900, with objectives at 28,620, 28,480 and an extended 28,340.
2. Price Action & Technical Structure
2.1 Intraday and Session Review
The Friday session opened at 29,180.00 at the Thursday 6:00 PM ET reopen, 382.00 points beneath Thursday's settle, and that opening print was also the session high. The contract marked a daily low of 28,232.75 and settled at 28,534.00 at 4:00 PM ET. The 30-minute series places the low in the 2:30 PM ET bar, after which the 3:30 PM ET bar closed at 28,527.25, so the settle sat 301.25 points above the low. Of the six four-hour bars, the 10:00 AM ET bar carried the largest decline, from 28,841.75 to 28,394.50.
Because Globex does not reopen until Sunday, the open, high and low on the provider's overview page belong to Friday's completed session. The published pivot ladder for the next session was computed from those inputs. Pivot R3 at 30,012.33 minus Pivot S3 at 27,170.58, divided by three, returns 947.25, and Pivot R2 at 29,596.17 minus Pivot S2 at 27,701.67, divided by two, returns the same 947.25. Three times the Pivot Point of 28,648.92 less the 28,534.00 settle gives a high plus low sum of 57,412.76, which the pair of 29,180.00 and 28,232.75 reproduces to within the published rounding at 57,412.75, and that pair reproduces all seven published rungs. The provider's settlement row and the chart's completed daily bar carry the same 29,180.00 open, 29,180.00 high, 28,232.75 low and 28,534.00 settle.
2.2 Daily Structure
Friday's 29,180.00 high sits 614.25 points beneath Thursday's 29,794.25 high and the 28,232.75 low sits 878.25 points beneath Thursday's 29,111.00 low. Settlements over the last seven sessions read 29,142.00, 29,117.75, 29,437.25, 29,812.00, 29,979.50, 29,562.00 and 28,534.00, two consecutive declines after three higher settles. Over five sessions the contract is down 583.75 points from the 29,117.75 settle of 10/23.
The weekly bar on the chart opened at 29,268.00 and closed at 28,534.00, with a high of 30,178.00 and a low of 28,232.75, against the prior week's 30,113.00 high and 28,987.00 low, so the week printed a higher high and a lower low. The provider publishes 28,232.75 as the one-month and 13-week low and 31,616.50 as the 52-week high of 10/06/26.
The December settle stood 149.15 points above the 28,384.85 cash close, against 159.49 points on Thursday, both measured as the settle less the provider's cash close from the same completed-session daily records.
2.3 4-Hour and Swing Structure
The four-hour bars for Friday's session closed at 28,865.50, 28,979.75, 28,889.75, 28,842.00, 28,394.50 and 28,543.00; the 2:00 PM ET bar holds the session low and closed 310.25 points above it.
Daily ranges for the last ten sessions ran 757.50, 511.75, 385.50, 960.25, 339.00, 548.00, 593.25, 503.75, 683.25 and 947.25. The retracement grid published for Monday places the 61.8 percent retracement from the 52-week low at 28,488.88, the 38.2 percent retracement from the four-week low at 29,525.34, the 50 percent retracement of the four-week range at 29,924.63 and the 50 percent retracement of the 52-week range at 27,522.75.
2.4 Moving Averages
The averages cited here were computed from the provider's daily settlement series for the December contract, which holds 260 completed sessions from 10/21/25 through Friday; each is carried at full precision and rounded once to the 0.25 tick. The 5-day average stands at 29,465.00, the 9-day at 29,474.00, the 20-day at 30,134.00, the 50-day at 30,065.75, the 100-day at 29,935.75 and the 200-day at 28,453.00.
The 28,534.00 settle sits 931.00 points beneath the 5-day average, 940.00 beneath the 9-day, 1,600.00 beneath the 20-day, 1,531.75 beneath the 50-day, 1,401.75 beneath the 100-day and 81.00 above the 200-day. The 5-day average fell from Thursday's 29,581.75 and the 20-day from 30,260.25 as the 10/02 settle of 31,061.75 left that window.
The 20-day average sits above the 50-day because the 30 older settlements in the 50-day window averaged lower, at 30,020.41. The 50-day sits above the 100-day because the 50 older settlements in the 100-day window averaged lower, at 29,805.92, and the 100-day sits above the 200-day because the 100 older settlements in the 200-day window averaged lower, at 26,970.28. The projection grid gives 29,448.94 as the price at which the 9-day average would be crossed on Monday.
2.5 Oscillator and Trend Readings
The oscillator figures below are as published on the provider's technical page, read at 6:24 PM ET on Friday with Globex closed for the weekend; they are the provider's readings and were not computed here. The 9-day relative strength reads 29.99, the 14-day relative strength 34.26 and the 20-day relative strength 37.91.
The 9-day raw stochastic reads 15.49 percent and the 14-day raw stochastic 11.27 percent, while the 14-day stochastic %K reads 26.45 percent and the 14-day stochastic %D 30.54 percent. The 9-day directional index ADX reads 35.35 with the 9-day +DI at 14.01 and the 9-day -DI at 38.27; the 14-day directional index ADX reads 25.91 with the 14-day +DI at 15.00 and the 14-day -DI at 34.68, so negative direction leads on both. The 9-day historic volatility reads 26.50 percent and the 14-day historic volatility 24.72 percent.
The composite multi-indicator read published for the Monday session is "56% SELL", with signal strength "Strong" and direction "Strengthening". The snapshot history reads "16% SELL" for the prior session, "56% SELL" a week ago and "80% BUY" a month ago. The short-horizon group averages "Average: 60% SELL", the medium-horizon group "Average: 50% SELL" and the long-horizon group "Average: 33% SELL".
2.6 Volatility and Expected Range
The published 14-day average true range stands at 618.58 points and the 14-day average daily range at 634.88 points; the 9-day average true range is 674.98 with a 9-day average daily range of 608.00, and the 20-day average true range is 585.40 with a 20-day average daily range of 570.97. Friday's 947.25 point range was 1.49 multiples of the 14-day average daily range.
Adding and subtracting the 14-day average true range of 618.58 points from the 28,534.00 settle frames Monday between 27,915.42 and 29,152.58. The published standard-deviation bands, built from five settlements, span 27,972.29 to 29,095.71 at one deviation, 27,739.63 to 29,328.37 at two and 27,561.10 to 29,506.90 at three. These bands describe dispersion, not intraday reach.
3. Key Levels
3.1 Resistance
Above the 28,534.00 settle, the first references are the Pivot Point at 28,648.92 and 28,767.40, the 20 percent raw stochastic projection. The 28,934.15 conversion of the NDX 28,785 combination level, 29,034.72, the 30 percent raw stochastic projection, Pivot R1 at 29,065.08 and one standard deviation resistance at 29,095.71 form the next band, followed by Thursday's 29,111.00 low, the 29,149.15 conversion of the NDX 29,000 key level, the one-ATR line at 29,152.58 and Friday's 29,180.00 high. The 29,267.91 stall level of the 14-day %K line, two standard deviations resistance at 29,328.37, the 9-day crossing price at 29,448.94, the 5-day average at 29,465.00, the 9-day average at 29,474.00, the 29,476.15 conversion of the NDX 29,327 modeled gamma-flip level, three standard deviations resistance at 29,506.90, the 38.2 percent retracement from the four-week low at 29,525.34, Thursday's 29,562.00 settle and Pivot R2 at 29,596.17 are the extended references.
3.2 Support
Beneath the settle sit the 61.8 percent retracement from the 52-week low at 28,488.88, the 200-day average at 28,453.00, Friday's 28,232.75 low and the published target price at 28,196.83. The 28,149.15 conversion of the NDX 28,000 put side support base and Pivot S1 at 28,117.83 form the next band, with one standard deviation support at 27,972.29, the one-ATR line at 27,915.42 and the 3-10 day crossover stall level at 27,902.71 beneath. Two standard deviations support at 27,739.63, Pivot S2 at 27,701.67, three standard deviations support at 27,561.10 and the 50 percent retracement of the 52-week range at 27,522.75 are the extended references, with Pivot S3 at 27,170.58 beneath them.
4. Macro Drivers
4.1 Largest-Company Results and the AI Spending Cycle
An online retailer and a processor maker reported after the close on Thursday, October 29, 2026, as the calendar lists them, and the news feed headlined both results as disappointing. On Friday the feed carried at 4:07 PM ET an item, unconfirmed, that the processor maker's shares fell 29 percent, their worst day in at least four decades, and at 3:25 PM ET an item that large technology companies hold 3 trillion dollars in spending commitments for artificial-intelligence infrastructure. It also carried at 12:46 PM ET a press report that an artificial-intelligence developer may not secure an investment-grade rating after its listing, and at 1:49 PM ET a statement from the SEC's enforcement director that the agency is examining artificial-intelligence disclosures. These are reports carried by the feeds. The calendar lists a consumer-electronics maker's results for Monday, November 2, 2026, for the date only; the time is not confirmed.
4.2 Semiconductor Cycle and Tech Sector Rotation
The semiconductor index closed at 10,688.80, down 7.20 percent, against 3.46 percent for the Nasdaq-100 cash index, 1.82 percent for the S&P 500 and 1.09 percent for the Dow industrials. The provider's commentary noted that 12 of the 30 Dow components closed higher. In the review's reading, the rotation away from technology that the feeds described on Thursday continued, now with semiconductors leading the decline.
4.3 Fed Policy and Real Yields (Duration Sensitivity)
The ten-year yield index closed at 4.93 percent; Thursday's close was 4.98 percent. The employment cost index released at 8:30 AM ET on Friday, October 30, 2026, as the calendar lists it, rose 0.8 percent, in line with the forecast, per the news-feed calendar and unconfirmed. Lower yields did not support technology on Friday, which in this review's interpretation marks the decline as earnings-driven rather than rate-driven. No real-yield series was captured.
4.4 Geopolitical Backdrop
The news feed carried reports of tanker incidents in the Strait of Hormuz and of the President's remark at 4:01 PM ET that "there are talks" with Iran, while December WTI crude rose 2.08 percent to 104.12. The provider's commentary cited higher oil prices and a 6.3 billion dollar theft at a cryptocurrency exchange among the day's pressures. These are reports carried by the feeds and attributed commentary.
4.5 Cross-Asset and Volatility
The volatility index closed at 19.42; Thursday's close was 17.20, and its session high was 23.93. The dollar index's daily record eased to 101.88 and gold's December contract fell 3.29 percent. The Nasdaq-100 cash index's session range ran from 28,713.45 to 28,093.25.
4.6 Institutional Positioning
Open interest on the December contract stood at 268,077 on Thursday, the 2026-10-29 row of the provider's record, against 267,642 on Wednesday, the 2026-10-28 row, and Friday's open interest is not yet reported; Friday's December volume was 1,023,028 contracts, against 806,178 on Thursday's 2026-10-29 row, revised from the 794,700 carried in Friday's outlook. The weekly positioning report released after Friday's close covers the week of October 27; the news feed summarised its S&P 500 figures, and its Nasdaq-100 table was not captured.
5. QQQ Options Flow Context (Proxy)
This review uses the QQQ fund and the Nasdaq-100 index columns of the dealer-positioning dataset as the positioning proxy for the December contract; the dataset tracks the index and the fund, and the futures translation below is this review's. The dataset read for this section uses Thursday's closes as its reference prices: NDX 29,402 corresponds to Thursday's 29,402.51 cash close and QQQ 715 corresponds to the fund console's previous close of 715.34. Thursday's 29,402.51 less 1,017.66 points, a 3.46 percent decline, gives the provider's 28,384.85 close, and every level below is read against that close.
On the index the modeled gamma-flip level sits at NDX 29,327, the modeled volatility threshold at NDX 29,550, the largest gamma concentration and the call side ceiling both at NDX 29,675 and the put side support base at NDX 28,000. The close sits 942.15 points beneath the flip level, 1,165.15 beneath the threshold, 1,290.15 beneath the ceiling and 384.85 above the put side base. Gamma tilt reads 0.981 and gamma notional plus 949.405 thousand dollars, close to flat, both model outputs. The dataset's key index strikes are 29,675, 30,000, 29,000 and 29,200, and its index combination levels are 28,785, 28,991, 29,197 and 27,962. The modeled threshold and flip level are model outputs, not option strikes.
On the fund the modeled gamma-flip level sits at 719, the modeled volatility threshold and largest gamma concentration at 720, the call side ceiling at 723 and the put side support base at 700. Fund gamma notional reads minus 721.507 million dollars with a gamma tilt of 0.620, proxy model outputs. The QQQ console, read at 6:19 PM ET, carried Thursday's 715.34 as its last closing price and a current price of 690.59, down 3.46 percent, beneath the 700 put side base. The console shows call gamma of minus 1.64 billion against put gamma of minus 2.64 billion, one-month implied volatility of 20.90 percent against realised volatility of 19.21 percent, an implied-volatility rank of 41.14 percent and a put-to-call open-interest ratio of 1.38.
At the measured basis of 149.15 points the NDX 28,000 base converts to 28,149.15, the NDX 29,327 flip level to 29,476.15, the NDX 29,550 threshold to 29,699.15, the NDX 29,675 concentration to 29,824.15 and the NDX 28,785 combination level to 28,934.15. In this review's interpretation, drawn from the index model and the QQQ fund proxy, both model outputs, a close more than 900 points beneath the flip level, with fund gamma negative and the fund beneath its put side base, describes an environment in which dealer hedging is more likely to extend moves than to damp them, and the index's 28,000 base is the nearest dataset reference beneath; gamma is read as a damping lens with no direction.
6. Forecast
6.1 Night Session (6:00 PM ET Sunday to 3:00 AM ET Monday, Globex and Asia)
Globex halted at 5:00 PM ET on Friday and reopens at 6:00 PM ET on Sunday, November 1, 2026, after US daylight saving time ends at 2:00 AM ET that morning, as the calendar lists it. Two days of headline exposure separate Friday's settle from the reopen. Gap references run both ways: at and above the settle, Friday's 28,534.00 settle itself, the Pivot Point at 28,648.92 and the 28,767.40 projection; beneath, the 28,488.88 retracement, Friday's 28,232.75 low and the 28,149.15 conversion of the NDX 28,000 base. Bias lower beneath the Pivot Point at 28,648.92, expected band roughly 28,250 to 28,800.
6.2 London Session (3:00 AM to 8:00 AM ET Monday)
From 3:00 AM ET European trading opens with manufacturing surveys listed for Monday morning by the news-feed calendar, unconfirmed. Bias neutral to lower beneath the Pivot Point at 28,648.92, expected band roughly 28,200 to 28,850.
6.3 Morning Session (9:30 AM to 12:00 PM ET Monday, RTH Open)
The cash open at 9:30 AM ET is the first directional test after Friday's semiconductor decline, and construction spending is scheduled for 10:00 AM ET on Monday, November 2, 2026, as the calendar lists it. Expected band roughly 28,150 to 28,900, with the 28,740 to 28,780 setup band in the upper half, its top 120.00 points beneath the 28,900 top of that range, which equals the stop.
6.4 Afternoon Session (12:00 PM to 4:00 PM ET Monday)
The senior loan officer survey is scheduled for 2:00 PM ET on Monday, November 2, 2026, as the calendar lists it, and the calendar lists the consumer-electronics maker's results for the same day, for the date only; the time is not confirmed. Expected band roughly 28,100 to 28,950.
6.5 Night Session Forward (6:00 PM ET Monday)
The Monday evening session opens at 6:00 PM ET and carries into Tuesday's midterm elections, per the news-feed calendar and unconfirmed. The calendar also lists results from a data-analytics software group for Monday, November 2, 2026, for the date only.
6.6 Expected Range (Monday Full Session)
Low-range scenario: 28,250 to 28,800; Mid-range scenario (most likely): 28,100 to 28,950; High-range scenario: 27,740 to 29,330.
6.7 Most Likely Path
In this review's analyst judgment the most probable path holds the contract between two standard deviations support at 27,739.63 and Pivot R1 at 29,065.08, with a rebound toward the Pivot Point at 28,648.92 that fails beneath the 28,934.15 conversion weighted above a sustained recovery. The composite moved to "56% SELL" from "16% SELL" with direction "Strengthening", negative direction leads on both directional systems and the settle sits beneath every average except the 200-day, while the 9-day relative strength reading of 29.99 shows how stretched the decline has become.
The alternative that would invalidate this reading is a settle above Pivot R1 at 29,065.08, which would open Friday's 29,180.00 high and the 29,476.15 flip-level conversion. On the other side, a reopen beneath Friday's 28,232.75 low would bring the 28,149.15 conversion of the NDX 28,000 base and Pivot S1 at 28,117.83 into play without the rebound the setup needs.
7. Monday Economic Calendar
Friday's releases are complete. The employment cost index released at 8:30 AM ET on Friday, October 30, 2026, as the calendar lists it, rose 0.8 percent, in line with the forecast, per the news-feed calendar and unconfirmed. The weekly positioning report was released after the close.
Over the weekend US daylight saving time ends at 2:00 AM ET on Sunday, November 1, 2026, as the calendar lists it, so Monday's clock times are in standard time. On Monday, November 2, 2026, construction spending is scheduled for 10:00 AM ET and the senior loan officer survey for 2:00 PM ET, both as the calendar lists them; the US manufacturing survey is listed for Monday by the news-feed calendar, unconfirmed. The calendar lists results from the consumer-electronics maker and the data-analytics software group for Monday, November 2, 2026, for the date only; the time is not confirmed.
Later in the week, the midterm elections fall on Tuesday, per the news-feed calendar and unconfirmed, the JOLTS report is scheduled for 10:00 AM ET on Tuesday, November 3, 2026, as the calendar lists it, results from a processor and graphics-chip maker are due on Tuesday, November 3, 2026, and from a mobile-chip designer on Wednesday, November 4, 2026, both as the calendar lists them, for the date only, and the employment situation report is scheduled for 8:30 AM ET on Friday, November 6, 2026, as the calendar lists it. In this review's judgment the first-order event for the Nasdaq-100 on Monday is the cash open at 9:30 AM ET after Friday's semiconductor decline, with the consumer-electronics maker's results, listed for the date only, the main scheduled company event.
8. Primary Trade Setup
Direction: Short
Rationale: The composite moved to "56% SELL" with direction "Strengthening", negative direction leads on both directional systems, and Friday printed the largest decline since 06/05/26 with the settle beneath every average except the 200-day. A rebound into the 28,740 to 28,780 band around 28,767.40, the 20 percent raw stochastic projection, offers a short with a defined risk point beneath the 28,934.15 conversion. The 9-day relative strength reading of 29.99 leaves room for a sharp rebound, so the setup is an analyst judgment that rebounds are sold, not a measured edge.
Entry Zone: 28,740 to 28,780
Stop Loss: 28,900 (above the entry band and beneath the 28,934.15 combination-level conversion)
Target 1 (T1): 28,620 (beneath the Pivot Point at 28,648.92)
Target 2 (T2): 28,480 (beneath the 61.8 percent retracement at 28,488.88)
Target 3 (T3, extended): 28,340 (above Friday's 28,232.75 low)
Risk-to-Reward: Approximately 1:1 to T1, 1:2 to T2, 1:3 to T3
Invalidation: A settle above Pivot R1 at 29,065.08 negates the thesis. Short of that, the edge is removed by acceptance above the entry band and not by a touch, defined as two consecutive 30-minute closes above 28,780.
Macro override: A cash-session recovery in semiconductors, or a weekend headline read as de-escalation in the Gulf, would support the index. In that scenario a move through the 28,900 stop invalidates the short before the targets, and Pivot R1 at 29,065.08 becomes the reference, 165.08 points beyond the stop and inside one 14-day average true range of 618.58.
Sources and methodology
This outlook is built from our session review of the December E-mini Nasdaq-100 contract, the December ’26 contract, prepared after Friday's close on October 30, 2026 for the Monday, November 2, 2026 session. Friday's open, high, low and settle come from the provider's daily settlement record for the December contract, the 2026-10-30 row, and match the chart's completed daily bar. Friday's session opened at the Thursday 6:00 PM ET reopen, and with Globex closed for the weekend the overview's open, high and low belong to that completed session. Pivot R3 at 30,012.33 less Pivot S3 at 27,170.58, divided by three, and Pivot R2 at 29,596.17 less Pivot S2 at 27,701.67, divided by two, both return 947.25, and three times the 28,648.92 Pivot Point less the settle gives 57,412.76, against 57,412.75 for the pair of 29,180.00 and 28,232.75, a difference within the published rounding. Every time of day given for Friday's prices comes from the 30-minute series for Friday's session, which starts at the Thursday 6:00 PM ET reopen, read as Eastern clock times; session windows are scored over the bars that open inside each window. Monday's clock times are standard time after daylight saving time ends on Sunday, as the calendar lists it.
The moving averages are the review's, computed from the provider's daily settlement series for the December contract, 260 completed sessions, and rounded once to the 0.25 tick. The oscillators and the average true and daily ranges are cited as published, read at 6:24 PM ET on Friday with Globex closed. Volume and open interest come from the provider's daily record: the 2026-10-30 row reads 1,023,028 contracts with open interest not yet reported, and the 2026-10-29 row now reads 806,178 contracts and open interest of 268,077, where Friday's outlook carried 794,700 contracts and open interest not yet reported; the 2026-10-28 row reads open interest of 267,642. The weekly positioning report covering the week of October 27 was released after Friday's close, and its Nasdaq-100 table was not captured. The dealer-positioning dataset carries Thursday's closes in its reference column; every Nasdaq futures equivalent is the review's conversion at the 149.15 point measured basis, the December settlement less the cash close, against 159.49 on Thursday. The QQQ fund is a proxy read alongside the index levels. The reading that dealer hedging is more likely to extend moves than to damp them is the review's interpretation from the index model and that proxy, both model outputs, and gamma is read as a damping lens with no direction; the fund console was read at 6:19 PM ET. Company results are dated by the calendar and described per the news feed, and the provider's attribution of Friday's decline is its commentary. The volume and open-interest changes, the session-window highs and lows and the distances in this article are computed. Scenario ranges are analyst judgment, and items marked unconfirmed come from the news-feed calendar.
Friday’s outlook for this contract is here, and the S&P 500 contract’s Friday outlook covers the index that fell 1.82 percent in cash on Friday. Outlooks for ES, NQ, GC and CL are collected on the market outlook page, and our forward trading record is on the performance statement.