Intel lost more than a quarter of its market value on Friday. It was the chipmaker's worst session in decades, and it came one day after Alphabet fell 12% on its own results. By the closing bell the main semiconductor fund had dropped 7.0%, Nvidia 4.2% and the Nasdaq-100 3.5%.
Then there was everyone else. The equal-weight S&P 500 gave up 0.8%.
That gap is the story of October. Investors spent the month selling the companies building artificial intelligence, and the losses are now deep enough to call it a bear market inside the AI trade. The question every trader carried into the weekend is whether this is the opening act of the broader crash that skeptics of the AI boom have predicted for two years. After going through the multi-week data, the AlgoIndex view is that the AI complex is in real trouble while the broad market is rotating, and that four specific signals would tell us the rotation has turned into something worse.
Distance from the 52-week closing high, close of October 30, 2026.
How far the AI trade has fallen
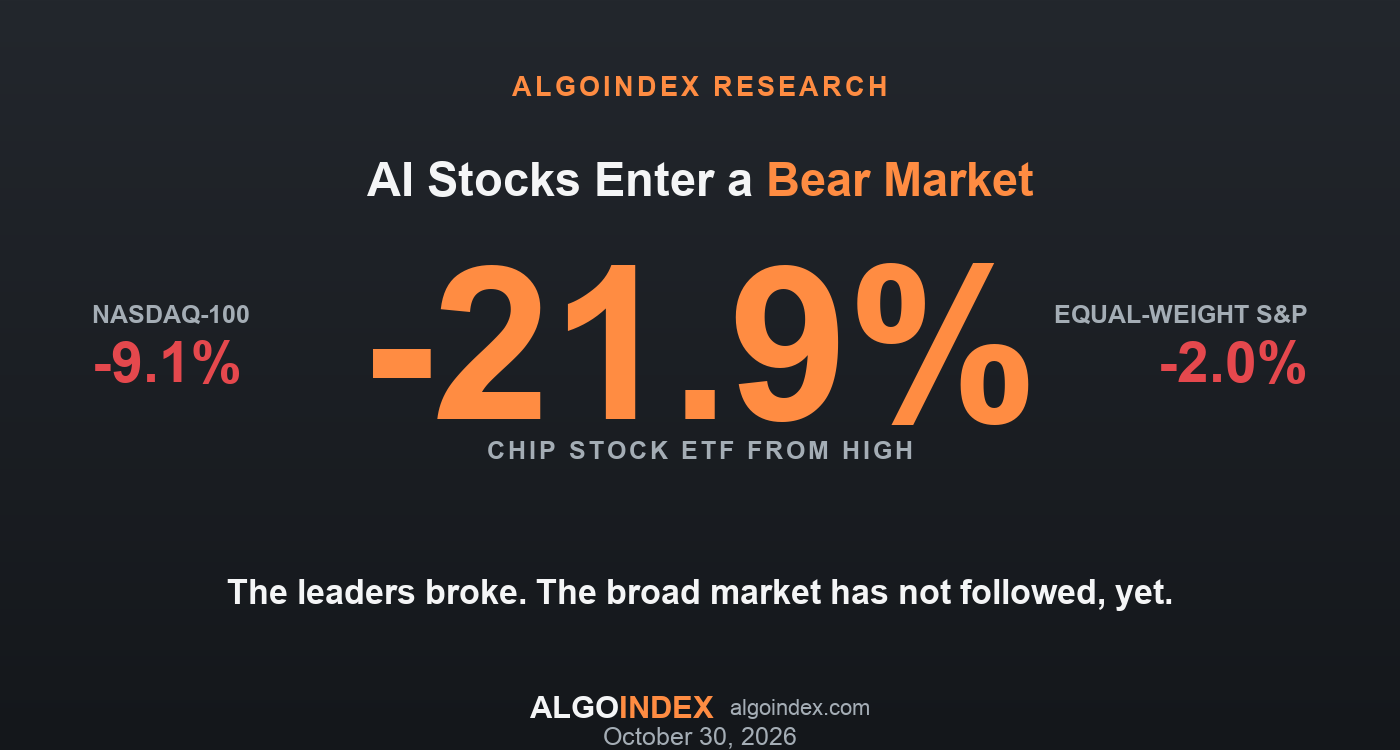
Measured from their highs, the declines line up almost exactly with each group's exposure to the AI buildout. The chip stock fund peaked on June 22 and has lost 21.9%, with 17.1% of that coming in the last 20 sessions. Nvidia is 14.5% below its October 6 close. The technology sector is down 11.1%.
The Nasdaq-100 set its record at 31,224 on October 6 and closed Friday at 28,385, a 9.1% decline that leaves it at the edge of a formal correction. The S&P 500, weighted heavily toward the same megacaps, is only 3.1% off its record.
The equal-weight index tells the rest. It treats the smallest member the same as the largest, which makes it a fair measure of the typical stock, and it sits just 2.0% below its August high.
The spending question finally has a price
For most of the past two years, markets rewarded AI spending almost without condition. This earnings season changed the terms. Investors started asking what the money returns, and the cash flow numbers gave them an uncomfortable answer.
Alphabet reported negative free cash flow of $9.1 billion in the third quarter, its second quarter in a row in the red, as quarterly capital spending reached $51.4 billion. Meta was negative by $2.1 billion. Amazon's free cash flow over the past twelve months swung to negative $42.4 billion, against positive $14.8 billion a year earlier, and the company expects to spend about $220 billion this year. According to S&P Global Market Intelligence figures cited by TechCrunch, Microsoft, Alphabet, Amazon, Meta and Oracle have raised $326 billion of debt in 2026, roughly triple last year's total.
| Company | Free cash flow | 2026 capex plan |
|---|---|---|
| Alphabet | -$9.1B (Q3) | $195B to $205B |
| Amazon | -$42.4B (trailing 12 months) | about $220B |
| Meta | -$2.1B (Q3) | $135B to $145B |
| Microsoft | +$18.6B (latest quarter) | $170B, cut from $175B |
Microsoft was the exception, with $18.6 billion of positive free cash flow, and it trimmed its full-year spending forecast to $170 billion from $175 billion while citing delays at outside providers of chip capacity. Even that read as a warning to chip investors. A buyer that spends less is a smaller customer.
Industry forecasts still have the largest cloud companies spending more than $1 trillion next year. That is the uncomfortable part for chip stocks. Their revenue depends on that spending continuing to climb, and the market has started to doubt the buyers can keep paying for it out of cash.
Money is rotating toward the average stock
A crash needs forced sellers across the whole market. October has produced something narrower. Over the last 20 sessions the equal-weight S&P 500 gained 6.0% on the cap-weighted index and utilities gained 11.0%, while the chip fund lost 15.6% against it. Small caps edged ahead by 1.0%.
The bond market points the same way. The 10-year Treasury yield fell from 5.28% on October 7 to 4.93% on Friday, a drop of 35 basis points, while technology stocks were falling. When stocks fall alongside rising yields, rates are usually the culprit. Here yields fell, which says investors are buying safety and doubting AI growth.
That matters for how to read Friday. The S&P 500 broke the 7,600 level shortly before noon, on the earnings news alone. Comments from two Federal Reserve officials in the early afternoon, one of them openly discussing rate hikes, then kept buyers away as the index slid toward its low. The comments added pressure. The selling had been building for three weeks while yields moved lower.
The path itself carries a warning. The Nasdaq-100 has fallen hard four times this month, on October 14, 16, 22 and 30, and each rebound was sold. Friday's 3.5% drop was the largest of the four. Rallies that fail at lower highs are how corrections deepen.
Inside Friday's session
Our morning map named index 7,600 (ES 7,633) as the line that mattered, with weaker support below it. It held through the morning and gave way just before noon. Our afternoon briefing, published before the low, marked the 7,520 zone (ES 7,553) as the next area where positioning favored buyers. The S&P 500 bottomed near 7,530 in the middle of the afternoon, and ES futures tested 7,558 to 7,560 four times without breaking.
Buyers absorbed every test. Month-end flows helped, and the S&P 500 finished at 7,580, down 1.8%, while ES futures settled at 7,614. The volatility index closed at 19.4, up 12.9% on the day but nowhere near the 31 it reached in March.
Four signals that would turn rotation into a crash
The difference between a sector bear market and a broad crash shows up in places beyond the AI names. We are watching four of them, and each has a clear trigger.
Status as of the October 30, 2026 close. None of the four has triggered.
The first is breadth. If the equal-weight index starts falling with the leaders, the rotation has run out of places to go. Friday's 0.8% decline was the first sign of that strain and needs watching. The second is credit: high-yield bonds weakening sharply against investment grade would mean stress is spreading to companies that need to borrow. The third is the volatility curve. In panics, near-term fear jumps above three-month fear, and so far it has not. The fourth is price. A settlement in ES futures below the 7,553 zone that held four times on Friday would open the deeper support at 7,530 and beyond.
History offers a caution about reading too much comfort into rotation. In 2000 the Nasdaq peaked in March, and for more than a year afterward much of the rest of the market held up as money moved out of technology. The broad decline came later. Our comparison of the AI boom with the dot-com era covers how that unwinding played out. A narrow bear market in the leaders fits that early stage, and it also fits a correction that runs its course without spreading.
The week ahead
The calendar gives every one of the four signals a chance to move. ISM manufacturing arrives at 10:00 ET on Monday. Tuesday brings the U.S. elections and job openings data, Wednesday the ISM services report, and Friday the October jobs report. More chip and AI earnings fall in the same window.
On ES futures, the broken support at 7,630 to 7,635 is now the first resistance, with a second band at 7,646 to 7,662. Support sits at 7,590, then the 7,553 to 7,563 zone that held on Friday, then 7,530. How dealer positioning shapes levels like these is covered in our gamma level accuracy tracker, and the day-by-day plan for the Nasdaq-100 is in our latest Nasdaq-100 outlook.
For now the AI trade is broken and the market around it is holding, and the next week will show which of the two gives way first.
Sources and methodology
Index, fund and stock figures use daily closing prices through October 30, 2026. Drawdowns are measured from each series' highest close of the past 52 weeks. Relative performance is the change in the ratio of two closing prices over the last 20 sessions. Group proxies: a broad semiconductor fund for chip stocks, a technology sector fund, an equal-weight S&P 500 fund, a small-cap index fund, a megacap technology basket, a utilities sector fund, and high-yield and investment-grade corporate bond funds for credit.
Company cash flow, capital spending and debt figures are as reported by the companies and summarized by TechCrunch and CNBC on October 29 and 30, 2026; the debt total is attributed there to S&P Global Market Intelligence. Intraday levels, the session low and the ES futures map come from AlgoIndex's own live session record and published maps for October 30. Views expressed are AlgoIndex research opinion.