
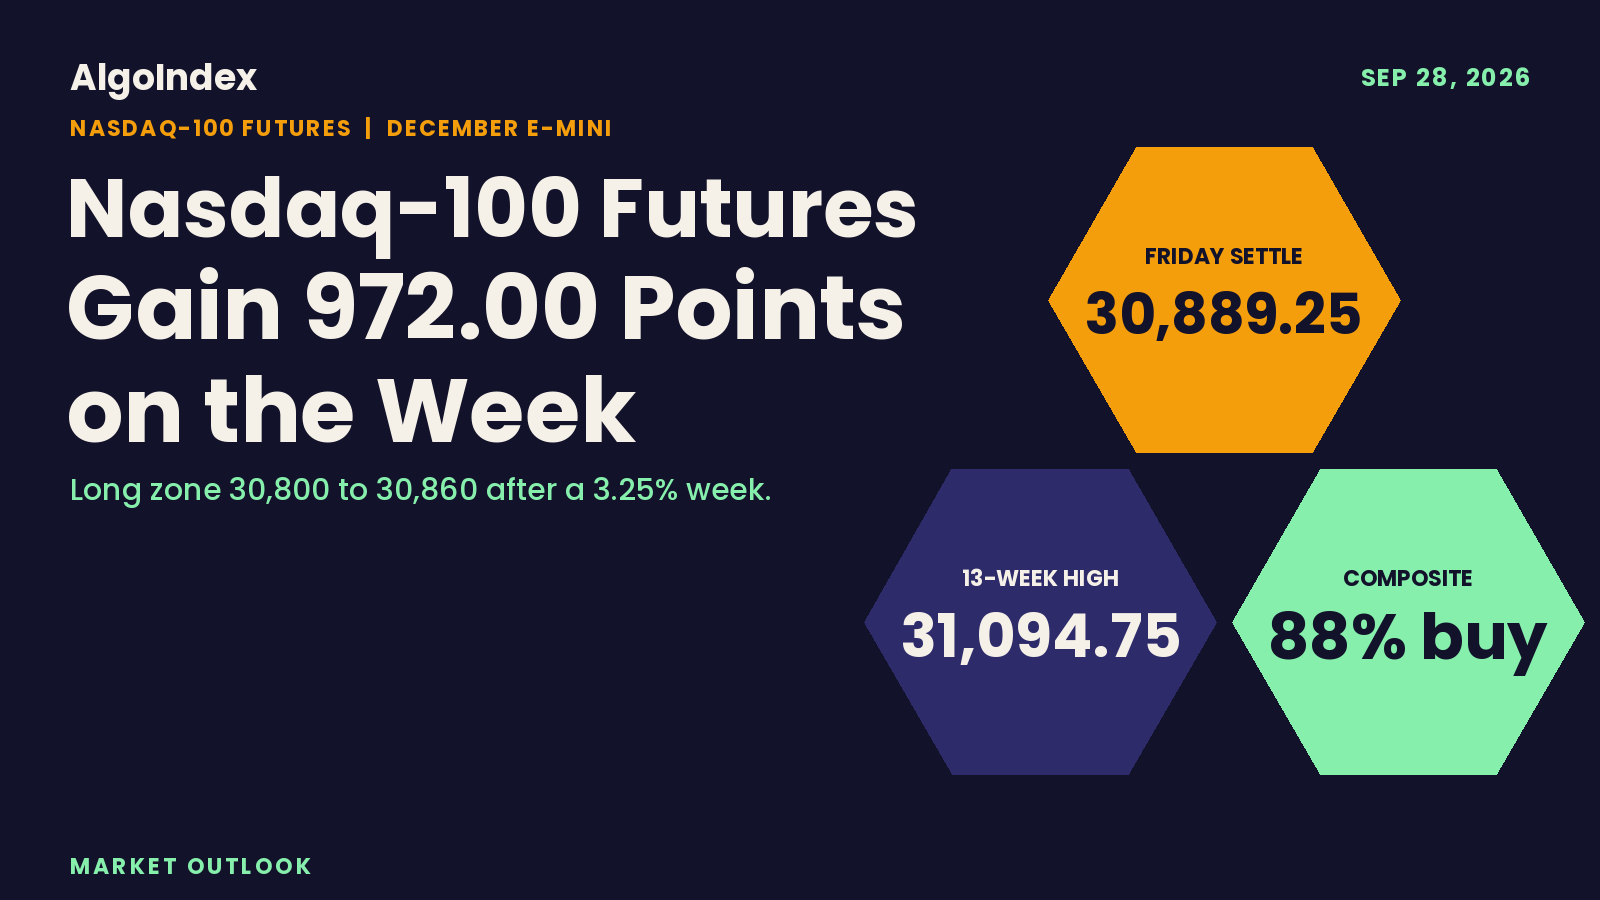
On the quarter's last full week, December Nasdaq-100 futures gained 972.00 points, or 3.25 percent, most of it in Monday's 867.50 point advance. Friday added 122.50. The contract settled at 30,889.25, up 0.40 percent, its second higher settle in a row, after a 320.50 point session between 30,999.50 and 30,679.00. That range was 0.71 times the 14-day average daily range of 451.88. It was the narrowest since 09/15.
Lower crude carried the equity complex. Provider commentary credited a slide of more than 2 percent in crude on hopes for a diplomatic path to reopen the Strait of Hormuz, strength in chipmakers and artificial-intelligence names, and firmer United States data. The Nasdaq-100 cash index closed at 30,608.13, up 0.42 percent, trailing the S&P 500's 0.51 percent. The ten-year yield still closed 2 basis points higher at 5.18 percent. For a long-duration index near its highs, rising yields are the central tension of the week.
Monday asks whether the contract can reclaim Wednesday's 31,094.75 high, the one-month and 13-week high, after a weekend that rejected the Iran plan behind Friday's crude relief. The composite reads 88 percent buy with direction strengthening, and positive direction leads on every horizon. The primary setup is a long from 30,800 to 30,860 around the Pivot Point. Delayed public quotes at 07:39 PM ET Sunday showed the contract at 30,809.00, inside that band.
Prepared for the Monday, September 28, 2026 session. December Nasdaq-100 futures settled at 30,889.25, up 0.40 percent, after a 30,999.50 to 30,679.00 session with a higher high and a higher low against Thursday. The first overhead band runs from the 30,998.89 %k stall through Friday’s high to the 31,003.06 deviation line, then Pivot R1 at 31,032.83, the 31,050.20 deviation line and Wednesday’s 31,094.75 high. Support starts at the 30,867.45 target price and the 30,855.92 Pivot Point, then the 30,846.80 5-day average and the 30,775.44 deviation line. The composite reads 88 percent buy. The primary setup is a long from 30,800 to 30,860, stop 30,660, targets 31,000, 31,170 and 31,340, void in real time on a ten-year yield above 5.23 percent. A large memory-chip maker reports after Wednesday’s close, the week’s first large chip report.
Friday's long from 30,640, graded against the bar
Our Nasdaq-100 outlook for Friday leaned long off Thursday's rejection candle. The card bought 30,640 to 30,690, the band around the 30,654.75 Pivot Point, the 30,652.40 5-day average and Wednesday's 30,642.75 low, with a 30,470 stop and objectives at 30,860, 31,055 and 31,250. A settle beneath Thursday's 30,370.00 low negated it outright. The Friday NQ outlook carries the full level map.
Friday opened at 30,726.50, 36.50 points above the band. Its low at 30,679.00 reached 11.00 points into the top of the band, and the bottom at 30,640 did not trade. The stop sat 209.00 points beneath the low. The high at 30,999.50 went 139.50 through the first objective and stopped 55.50 short of the second, and the settle at 30,889.25 finished 29.25 above the first. The daily bar cannot show the order of those prints, so this outlook asserts no fill and no sequence.
The range cases split. The low-range case, 30,600 to 30,940, held the low and the settle, and the high overran its top by 59.50 points. The most likely band, 30,480 to 31,040, contained the whole bar, 40.50 points inside its top and 199.00 above its bottom. So did the high-range case, 30,315 to 31,195.
The path call held. It weighted a settle between the 30,654.75 pivot and Pivot R1 at 30,939.50 above a move through the 31,094.75 high. Friday settled 50.25 points beneath R1, and the high stopped 95.25 short of 31,094.75. The macro override named a ten-year back above 5.18 percent. The yield traded as high as 5.23 percent during the session and closed at 5.18, on the line, and the contract finished higher regardless.
A 972-point week and a 30,889.25 settle
Friday's bar sat above Thursday's on both ends. The session opened at 30,726.50, 40.25 points beneath Thursday's settle, and the settle finished 162.75 points above the open, 210.25 above the low and 110.25 beneath the high, at 65.6 percent of the range. The high sat 172.00 points above Thursday's 30,827.50 and the low 309.00 above Thursday's 30,370.00. The whole bar stayed inside Wednesday's 31,094.75 to 30,642.75 range. No intraday series was captured, so no Friday path is drawn.
The extremes are back-solved from the published pivot ladder. The third resistance point at 31,353.33 minus the third support point at 30,391.83, divided by three, returns 320.50, and the second pair, 31,176.42 and 30,535.42, divided by two, returns the same. Three times the unrounded 30,855.917 Pivot Point, published as 30,855.92, less the settle gives a 61,678.50 high-plus-low sum, and 30,999.50 with 30,679.00 reproduces all seven rungs. The overview page and the chart's daily bar show the same open, high and low. The chart's last 30-minute bar closed at 30,921.75, a post-settlement print that is not used as the settle.
Monday did most of the week's work. Settles read 30,784.75 on Monday, 31,028.50 on Tuesday, 30,764.75 on Wednesday, 30,766.75 on Thursday and 30,889.25 on Friday. After Monday's advance the contract spent four sessions inside a 31,094.75 to 30,370.00 envelope, and Friday's settle is the highest since Tuesday. Daily ranges ran 958.75 on Monday, 395.50 on Tuesday, 452.00 on Wednesday, 457.50 on Thursday and 320.50 on Friday.
The week's ranges shrank as it went. After Monday's 958.75 point session, Tuesday through Thursday ran between 395.50 and 457.50 points, and Friday's 320.50 was the narrowest session since the 287.75 point range of 09/15. Compression after an advance that size leaves the direction of the next expansion open. In our reading the directional system is what leans it upward, since positive direction leads on every horizon.
The prior week sits entirely underneath. The week of September 21 through 25 spanned 31,094.75 at Wednesday's high and 29,904.00 at Monday's low. September 14 through 18 spanned 29,993.25 to 29,053.00, and every settle of this week finished above that week's high; Friday's low at 30,679.00 sat 685.75 points over it. No prior-quarter high or low was captured, so the 13-week extremes stand in: the 31,094.75 high, set on 09/23/26 and also the one-month high, and the 27,482.00 low, set on 07/29/26. The settle sits 205.50 points beneath the high.
The retracement grid published for Monday sits well beneath the market: the 38.2 percent retracement from the four-week high at 30,314.80, the 50 percent retracement of the four-week range at 30,073.88 and the 38.2 percent retracement from the 13-week high at 29,714.68. No four-hour series was captured, so no four-hour swing is described.
Every average sits beneath the settle. Computed from 260 completed sessions of the December contract, the 5-day stands at 30,846.80, the 9-day at 30,266.42, the 20-day at 29,935.11, the 50-day at 29,660.25, the 100-day at 29,902.29 and the 200-day at 27,964.31. The settle sits 42.45 points above the 5-day, 622.83 above the 9-day, 954.14 above the 20-day, 986.96 above the 100-day, 1,229.00 above the 50-day and 2,924.94 above the 200-day. The 100-day sits above the 50-day because the 50 settles before the most recent 50 averaged higher. The 100-day and 200-day rest partly on thinly traded deferred-contract settlements from before the roll.
The short averages are climbing fast. The 5-day rose 194.40 points from Thursday's 30,652.40 and the 20-day 44.98 from 29,890.14. Monday's crossing prices sit far beneath the market: 30,393.88 for the 9-day, 29,981.73 for the 18-day and 29,917.52 for the 40-day.
Momentum is firm. Relative strength reads 69.18 on the 9-day, 64.03 on the 14-day, 60.22 on the 20-day, 55.55 on the 50-day and 54.84 on the 100-day, and the 14-day grid places its 70 percent line at 31,505.60 and its 50 percent line at 30,020.74. Stochastics run high: the 9-day, 14-day and 20-day raw readings each stand at 89.94 percent, with %K at 85.90 percent and %D at 89.04 percent, and the 50-day reads 94.31 percent. The published 80 percent threshold sits at 30,686.40, 7.40 points above Friday's low.
Direction points up on every horizon read. On the 9-day the directional index reads 26.63 with positive direction at 31.74 over negative at 15.79; on the 14-day, 17.19 with 28.17 over 17.62; on the 20-day, 13.18 with 25.61 over 19.16. The composite multi-indicator read is 88 percent buy for a second session, strength good and direction strengthening. A week ago it read 40 percent buy, and a month ago hold. The short-horizon and medium-horizon groups each average 100 percent buy. The long-horizon group averages 33 percent buy, where the 50-day to 100-day crossover reads sell.
Volatility runs wider than in the broad index. The 14-day average true range is 460.12 points, 1.49 percent of price, and the 14-day average daily range 451.88; the 9-day pair reads 453.42 and 473.28 and the 20-day 477.28 and 428.17. Historic volatility reads 16.74 percent on the 9-day, 16.38 percent on the 14-day and 15.46 percent on the 20-day. One average true range either side of the settle frames 30,429.13 to 31,349.37. The published deviation bands are tighter: 30,775.44 to 31,003.06 at one deviation, 30,728.30 to 31,050.20 at two and 30,692.13 to 31,086.37 at three.
Then the reopen. Delayed public futures quotes read at 07:39 PM ET Sunday put NQ at 30,809.00, inside the 30,800 to 30,860 band, after a reopen low of 30,781.50 that held above Pivot S1 at 30,712.33. November crude read 93.65 at the same time, beneath its 94.75 Friday session high, so the crude line that would have voided the long before entry had not been crossed. The stop and the invalidation were intact at that read. No later Sunday series was captured for NQ.
A 5.18 percent ten-year, a 30,000 concentration and a 30,683 contract short
The artificial-intelligence spending story kept producing headlines. A leading chip designer committed 1 billion dollars to a European compute provider, per an item stamped 09:01 AM ET, and a bank raised its price objective on a major processor maker to 720 from 620 at 09:37 AM ET. A memory maker's storage unit was reported to be weighing a 2027 listing at a valuation near 150 billion dollars. At 10:13 AM ET the news feed quoted a Federal Reserve bank president asking whether the artificial-intelligence ecosystem is becoming too big to fail. No megacap reported on Friday.
Single names carried their own flows. The desk note recorded a megacap platform company falling about 3 percent near its 750 level with single-stock hedging delta of minus 462 million dollars, the largest negative reading in 30 days by its account, after a positive 1.5 billion dollar reading the day before. Provider commentary described strength in chipmakers, but no sector index figure was captured, so its size is not measured. The cash index gained 0.42 percent against 0.51 percent for the broader cash index. Technology trailed slightly.
Duration is the pressure point. The ten-year yield index closed at 5.18 percent, up 2 basis points, after a 5.16 to 5.23 percent session, and the thirty-year at 5.50 percent. The Cleveland Federal Reserve president said between 02:47 PM and 02:58 PM ET, per the news feed, that a good economic outlook is pressuring yields up, that artificial-intelligence investment demand is competing for investors in the bond market and that the United States is on an unsustainable fiscal path. Provider commentary called the New York Federal Reserve president's remarks on returning inflation to target hawkish. The desk note described a volatility spike in long-duration Treasury options around 12:00 PM ET and ten-year and thirty-year yields at two-decade highs this week, by its account.
Friday's data leaned firm. Provider commentary put August nondefense capital goods orders excluding aircraft up 1.6 percent against 0.6 percent expected. For a rate-sensitive index that cuts both ways: firmer investment spending supports the earnings case, and it also argues against any relief in yields. The ten-year's 5.23 percent session high is the number the Monday plan keys off, and it sits 5 basis points above Friday's close.
The Iran timing matters for how Friday is read. Iran's foreign minister described the seven-day plan between 04:19 PM and 04:22 PM ET, after the settle and the 4:00 PM ET cash close, while futures still traded until the 5:00 PM ET end of electronic trading. No later price series was captured, so the session's gain did not follow that announcement. On Saturday the President told reporters the plan was not acceptable, and Iran's foreign minister replied that Iran would not back down on its conditions. That removes the deal hopes behind Friday's crude relief.
The trade side leans the other way, and it leans toward this index. The United States and China agreed after President Xi's visit to cut tariffs on 30 billion dollars of non-sensitive goods in each direction and to extend the truce by two months, from November 10 to about mid-January 2027, alongside a new artificial-intelligence dialogue, per press reports. The review reads the tariff agreement and the dialogue as a partial offset that favours the chip and technology names in the Nasdaq-100.
Across assets Friday ran one direction. The S&P 500 cash index closed at 7,743.41, up 39.28 points or 0.51 percent, and the Nasdaq-100 cash index at 30,608.13, up 129.27 points or 0.42 percent. The volatility index closed at 14.87, down 0.80 points, and the volatility-of-volatility index at 87.84, down 3 percent. The dollar index fell 0.32 percent to 100.97. Crude settled at 92.41, down 2.33 percent, and gold at 4,321.2, up 0.54 percent. The measured basis is 281.12 points, 30,889.25 less 30,608.13.
The cash index map comes from the desk note published at 5:12 PM ET Friday. Its reference column is the prior session's close, and it checks out: the 30,478 reference matches Thursday's 30,478.86 cash close. For the cash index the model reads a modeled volatility threshold at 29,470, a modeled gamma-flip level at 29,947 and a primary gamma concentration at 30,000, with gamma tilt 1.62 and gamma notional 13.77 million dollars. The published call-side and put-side fields, 29,475 and 29,500, sit beneath the close and invert their usual order, so they are recorded and not used.
The mapped key levels are 30,000, 30,500, 29,475 and 31,000, and the mapped confluence levels 30,022, 30,845, 31,271 and 30,631. The cash close sits 108.13 points above 30,500, 391.87 beneath 31,000 and 661.13 above the modeled gamma-flip level. The source publishes these in cash terms only. The futures equivalents on the level map use the measured basis: 31,126.12 for the 30,845 confluence and 31,281.12 for the 31,000 key level, with the gamma-flip level at 30,228.12.
The technology fund used as the flow proxy tells a mixed story. The desk model reads a volatility threshold at 738, a gamma-flip level at 734, a primary concentration at 740, a call-side ceiling at 760 and a put-side base at 730, with gamma tilt 1.073 and gamma notional 274.193 million dollars. Its 741 reference matches the fund's 741.06 previous close. The fund closed at 744.50, 4.50 above the concentration and 6.50 above the threshold. A separate fund console showed a current price of 745.10, a daily change of 0.55 percent, call gamma of minus 1.1 billion dollars, put gamma of minus 2.2 billion dollars and next-expiry gamma at 19.23 percent of the total. The two models carry opposite signs. They are recorded rather than reconciled, and no level here rests on either sign.
Leveraged funds added shorts into the rally. The positioning report as of September 22, 2026 shows them long 54,033 contracts, up 1,353, against short 84,716, up 25,649, a net short of 30,683. Asset managers held 106,240 long against 34,020 short, a net long of 72,220, and dealers 57,512 long against 115,916 short. The report week included Monday's 867.50 point advance, so the rise in Leveraged Funds shorts is consistent with those funds adding short exposure or hedges into it. That is interpretation, not a measured attribution. Open interest stood at 271,967 on the 09/24 row, down from 274,125 on 09/23.
Wednesday is also the quarter end. Quarter-end flows are orders set by the calendar: balanced funds restoring their target mix of stocks and bonds, index funds matching benchmarks at the close and managers tidying books before reports go out. They tend to bunch into the final days and the last hour of trading. The desk note flagged the quarter-end rebalance for Wednesday, and the Nasdaq-100's weight in large technology and semiconductor names means any late trimming or topping-up of those names moves it more than the broad index. The memory-chip maker reports after that same close, with its conference call at 04:30 PM ET.
The trade map for Monday September 28
The first overhead band runs from the 14-day %k stall at 30,998.89 through Friday’s 30,999.50 high to one standard deviation resistance at 31,003.06, a group 4.17 points deep. Pivot R1 at 31,032.83 and two deviations resistance at 31,050.20 sit above it, then three deviations resistance at 31,086.37 and Wednesday’s 31,094.75 high, the one-month and 13-week high. The futures equivalent of the 30,845 cash confluence level at 31,126.12, Pivot R2 at 31,176.42 and the 31,281.12 equivalent of the 31,000 cash key level follow, with Pivot R3 at 31,353.33 and the 31,505.60 relative-strength 70 percent line the extended references.
Beneath the settle, the published target price at 30,867.45 and the Pivot Point at 30,855.92 sit within 33.33 points, with the 5-day average at 30,846.80 beneath them. One deviation support at 30,775.44, Thursday’s 30,766.75 settle, two deviations support at 30,728.30, Pivot S1 at 30,712.33 and three deviations support at 30,692.13 form the next band, closed by the 30,686.40 stochastic 80 percent threshold and Friday’s 30,679.00 low. Pivot S2 at 30,535.42, the 30,482.22 stochastic 70 percent threshold, the 30,393.88 9-day crossing, Pivot S3 at 30,391.83 and Thursday’s 30,370.00 low follow. The 30,314.80 retracement and the 30,228.12 gamma-flip equivalent are the deeper references.
The Monday plan is a long from 30,800 to 30,860, around the Pivot Point. Friday made a higher high and a higher low against Thursday for a second consecutive higher settle, at 65.6 percent of its range. The contract holds above every settlement average, the composite reads 88 percent buy with direction strengthening, and positive direction sits well above negative on the 9-day. The stop at 30,660 sits beneath Friday’s low, the 30,686.40 threshold and three deviations support. Saturday’s rejection meets half of the macro override, so conviction is lower though the levels are unchanged.
The reopen had already reached the band by 07:39 PM ET Sunday, at 30,809.00 after a 30,781.50 low. Through the Globex night the bias is mildly constructive above the 30,855.92 pivot, with an expected band of roughly 30,700 to 31,050. The Bank of Japan minutes and Japanese services producer prices are listed for 07:50 PM ET Sunday, forecast 3.6 percent against 3.6 percent, per the news-feed calendar and unconfirmed.
London carries a Bank of England policymaker at 06:00 AM ET, per the news-feed calendar and unconfirmed, with the dollar and European yields as the cross-reads. Bias neutral to constructive, expected band roughly 30,680 to 31,060. The 30,775.44 one-deviation support is the line whose loss would soften the morning.
New York has no scheduled tier-one release on the captured calendars. Vice Chair for Supervision Bowman speaks at 08:15 AM ET, as reported by the Federal Reserve Board schedule and unconfirmed against the verified forward calendar, and the President of the European Central Bank at 10:00 AM ET, per the news-feed calendar and unconfirmed. The 09:30 AM ET cash open sets the first test against the 31,003.06 to 31,050.20 band. A hold above the pivot keeps Wednesday’s 31,094.75 high in reach, and acceptance beneath 30,712.33 returns the contract toward Friday’s 30,679.00 low. Expected band roughly 30,650 to 31,120.
The afternoon brings a European Central Bank board member at 12:10 PM ET and the Richmond Federal Reserve president at 01:30 PM ET, both per the news-feed calendar and unconfirmed, with Governor Cook at 01:25 PM ET as reported by the Federal Reserve Board schedule and unconfirmed. Expected afternoon band roughly 30,700 to 31,100. No structural expiry falls on Monday; the provider lists the December contract’s expiration as 12/18/26.
The week's anchors follow. The Reserve Bank of Australia decides at 12:30 AM ET Tuesday, per the news-feed calendar and unconfirmed, and job openings print at 10:00 AM ET Tuesday. Personal income and outlays arrive at 08:30 AM ET on September 30, 2026, and the memory-chip maker’s results come after that day’s close, with its conference call at 04:30 PM ET. The employment report lands at 08:30 AM ET on October 2, 2026, all per the verified forward calendar. Press-report previews, unconfirmed, put the payrolls consensus near 100,000 with unemployment seen at 4.2 percent from 4.1 percent.
Three cases frame Monday: 30,760 to 31,020 on the low-range case, 30,650 to 31,120 on the mid-range case, which is the most likely, and 30,430 to 31,350 on the high-range case. In our analyst judgment the reopened session holds above the 30,855.92 pivot through Asia and Europe, with crude and the ten-year yield the main inputs. After the cash open the contract tests 31,003.06 to 31,050.20. A settle between the pivot and Wednesday’s 31,094.75 high is weighted above a settle outside it, because the directional readings and the composite favour the upside while yields near the week’s highs limit the extension. A settle beneath Pivot S1 at 30,712.33 would invalidate the reading and put Friday’s 30,679.00 low and the 30,535.42 Pivot S2 back in play.
Wednesday's 31,094.75 high sits 205.50 points above the settle, and a ten-year yield above 5.23 percent is the one input that voids the approach to it.
The complete data picture
Every number behind Monday’s plan, charted first, then the full level lists, then the complete numeric reference underneath.
Full numeric reference, the remaining figures from the session review
Carried below in the review’s own words: the weekend update, the session review, structure, averages, oscillators and volatility from section 2, the macro drivers from section 4, the flow proxy section 5 and the Monday calendar from section 7.
Weekend update
On Saturday morning, September 26, President Trump told reporters as he left the White House that the seven-day plan Iran's foreign minister described after Friday's settle was not acceptable, saying Iran wanted a deal because it was losing badly. Per press reports, the plan asked the United States to release frozen funds, lift oil sanctions and end the naval blockade of Iranian ports within four to five days, with the Strait of Hormuz reopening and final talks starting by day seven; Iran's foreign minister replied that Iran would not back down on its conditions and was waiting for the mediators. On Sunday, September 27, after the rejection, Iranian media reported multiple missiles and drones fired at vessels near Qeshm Island in the Strait, per press reports, a report that remains unconfirmed with no verified damage count, and Iranian armed forces spokesmen warned the United States against further intervention in the Strait. The Revolutionary Guards also said on Sunday that they had seized a United States underwater drone in the Strait. Saudi Arabia said it intercepted Houthi drones aimed at the Riyadh area and a ballistic missile aimed at Khamis Mushait. Iran's president used the United Nations General Assembly to say Tehran remains open to diplomacy.
On trade, the United States and China agreed after President Xi's visit to cut tariffs on 30 billion dollars of non-sensitive goods in each direction and to extend the trade truce by two months, from November 10 to about mid-January 2027, alongside a new artificial-intelligence dialogue, per press reports.
Week ahead, from the verified forward calendar: JOLTS at 10:00 AM ET Tuesday; the PCE price index with personal income and outlays, and the third estimate of second-quarter GDP, at 08:30 AM ET Wednesday; the weekly petroleum status report at 10:30 AM ET Wednesday; a large memory-chip maker's results after Wednesday's close, with its conference call at 04:30 PM ET per the company's announcement; an athletic-apparel maker's results after Thursday's close; and the September employment situation at 08:30 AM ET Friday. Press-report previews, unconfirmed, put the payrolls consensus near 100,000 with unemployment seen at 4.2 percent from 4.1 percent. Also per press-report previews and unconfirmed against the verified calendar: Conference Board consumer confidence and the Reserve Bank of Australia decision on Tuesday, ADP employment, Chicago PMI and the China official PMIs on Wednesday, ISM manufacturing and weekly jobless claims on Thursday, with Wednesday also the quarter end. On Monday, Vice Chair for Supervision Bowman at 08:15 AM ET, on bank supervision and regulation, and Governor Cook at 01:25 PM ET, on artificial intelligence and emerging technology, are listed as reported by the Federal Reserve Board schedule, unconfirmed against the verified forward calendar. Governor Barr's economic outlook remarks are listed for Tuesday at 12:40 PM ET, as reported by the Federal Reserve Board schedule and unconfirmed against the verified forward calendar.
What changes for NQ. Friday's gain came with lower crude on hopes of a United States and Iran deal, per press reports. Iran's foreign minister described the plan only after Friday's settle and the 4:00 PM ET cash close, between 04:19 PM and 04:22 PM ET per the news feed, while futures still traded until the 5:00 PM ET end of electronic trading, and no later price series was captured, so the session's gain did not follow that announcement. Saturday's rejection removes the deal hopes behind that crude relief; the tariff agreement and the artificial-intelligence dialogue are a partial offset that leans toward the chip and technology names in this index. A large memory-chip maker reports after Wednesday's close, with its conference call at 04:30 PM ET, the first large chip report of the week. The long setup in section 8 is unchanged in its levels but carries lower conviction: its macro override named a rejection that sends crude sharply higher, and the first half of that condition is now met. A crude reopen above Friday's session high would void the long before entry; that session high was 94.75 in November crude.
2.1 Intraday and session review
The completed Friday session opened at 30,726.50, 40.25 points beneath Thursday's settle, marked a high of 30,999.50 and a low of 30,679.00, and settled at 30,889.25. No intraday series was captured this run, so the order in which those extremes were reached is not asserted and no path claim appears anywhere in this review. What the daily bar establishes is geometry: the settle finished 162.75 points above the open, 210.25 points above the low and 110.25 points beneath the high, which places it at 65.6 percent of the 320.50 point range.
The session extremes used here are the completed-session inputs behind the published pivot ladder rather than an independently read bar, back-solved from the outer pivot pairs and verified against every rung. The third resistance point at 31,353.33 minus the third support point at 30,391.83, divided by three, returns 320.50, and the second resistance point at 31,176.42 minus the second support point at 30,535.42, divided by two, returns the same 320.50. Three times the unrounded Pivot Point of 30,855.917, published as 30,855.92, less the 30,889.25 settle gives a high plus low sum of 61,678.50, and the resulting pair of 30,999.50 and 30,679.00 reproduces all seven published rungs. Because Globex does not reopen on a Friday evening, the provider's overview page dated for the Friday session and the chart's daily bar both show the same completed-session open, high and low. The chart's last 30-minute bar closed at 30,921.75, a post-settlement electronic print that is not used as the settle.
2.2 Daily structure
Friday's bar sits above Thursday's on both ends and inside Wednesday's 31,094.75 to 30,642.75 range. The week of September 21 through September 25 spanned 31,094.75 at the high on Wednesday and 29,904.00 at the low on Monday, and settled at 30,889.25. The prior week, September 14 through September 18, spanned 29,993.25 to 29,053.00, and every settle of the week finished above the prior week's 29,993.25 high, with Friday's low at 30,679.00 685.75 points above it.
For the quarterly reference the review uses the 13-week extremes as the available proxy, because no prior-quarter high or low was captured this run. The 13-week and one-month high stands at 31,094.75, set on 09/23/26, and the 13-week low at 27,482.00, set on 07/29/26. The settle sits 205.50 points beneath the 13-week high.
2.3 Swing structure
The daily settlement sequence for the week reads 30,784.75 on Monday, 31,028.50 on Tuesday, 30,764.75 on Wednesday, 30,766.75 on Thursday and 30,889.25 on Friday. After Monday's 867.50 point advance the contract spent four sessions inside a 31,094.75 to 30,370.00 envelope, and Friday's settle is the highest since Tuesday's 31,028.50. Daily ranges ran 958.75 on Monday, 395.50 on Tuesday, 452.00 on Wednesday, 457.50 on Thursday and 320.50 on Friday.
The retracement grid published for Monday places the 38.2 percent retracement from the four-week high at 30,314.80 and the 50 percent retracement of the four-week range at 30,073.88, both beneath the market; the 38.2 percent retracement from the 13-week high sits at 29,714.68. No four-hour series was captured this run, so the four-hour swing sequence is not described.
2.4 Moving averages
The averages cited in this subsection were computed this run from the provider's daily settlement series for the December contract, preserved in the coverage receipt, which holds 260 completed sessions. The 5-day average stands at 30,846.80, the 9-day at 30,266.42, the 20-day at 29,935.11, the 50-day at 29,660.25, the 100-day at 29,902.29 and the 200-day at 27,964.31. The provider's published 5, 20, 50, 100 and 200 day figures reproduce from the same rows. The December contract was a deferred month until the September contract's roll, so the older rows behind the 100-day and 200-day averages are thinly traded deferred-contract settlements, and those two averages carry that caveat.
The 30,889.25 settle sits 42.45 points above the 5-day average, 622.83 above the 9-day, 954.14 above the 20-day, 986.96 above the 100-day, 1,229.00 above the 50-day and 2,924.94 above the 200-day. The 100-day average sits above the 50-day because the 50 settles before the most recent 50 averaged higher than the most recent 50. The 5-day average rose 194.40 points from Thursday's 30,652.40 and the 20-day rose 44.98 points from 29,890.14.
The projection grid gives the prices at which each average would be crossed on Monday: 30,393.88 for the 9-day, 29,981.73 for the 18-day and 29,917.52 for the 40-day, all beneath the market.
2.5 Oscillator and trend readings
The oscillator figures below are as published on the provider's technical page for the Friday session. Relative strength reads 69.18 on the 9-day, 64.03 on the 14-day, 60.22 on the 20-day, 55.55 on the 50-day and 54.84 on the 100-day. The published 14-day relative-strength grid places the 70 percent line at 31,505.60 and the 50 percent line at 30,020.74, so the 14-day reading is firm without reaching an extreme.
Stochastics are high. The 9-day, 14-day and 20-day raw stochastic each read 89.94 percent, with %K at 85.90 percent and %D at 89.04 percent; the 50-day raw stochastic reads 94.31 percent. The published grid places the 14-3 day raw stochastic 80 percent threshold at 30,686.40, 7.40 points above Friday's low.
The directional system points up on every horizon read. On the 9-day the directional index reads 26.63 with positive direction at 31.74 and negative direction at 15.79; on the 14-day it reads 17.19 with positive direction at 28.17 over negative at 17.62, and on the 20-day 13.18 with positive direction at 25.61 over negative at 19.16. Historic volatility reads 16.74 percent on the 9-day, 16.38 percent on the 14-day and 15.46 percent on the 20-day.
The composite multi-indicator read published for Friday is 88 percent buy, with the signal strength described as good and the short-term direction as strengthening. The snapshot history reads 88 percent buy for the prior session, 40 percent buy a week ago and hold a month ago. The short-horizon and medium-horizon groups each average 100 percent buy, and the long-horizon group 33 percent buy, where the 50-day to 100-day crossover reads sell.
2.6 Volatility and expected range
The published 14-day average true range stands at 460.12 points, 1.49 percent of price, and the 14-day average daily range at 451.88 points; the 9-day figures are 453.42 and 473.28, and the 20-day figures 477.28 and 428.17. Friday's realised 320.50 point range was 0.71 times the 14-day average daily range.
A one-range projection from the 30,889.25 settle using the 14-day average true range of 460.12 points frames Monday between 30,429.13 and 31,349.37. The published standard-deviation bands are tighter: one deviation spans 30,775.44 to 31,003.06, two spans 30,728.30 to 31,050.20 and three spans 30,692.13 to 31,086.37.
4.1 Megacap earnings and the capital-spending cycle
The captured calendars carried no megacap earnings report for Friday. The artificial-intelligence capital-spending theme carried items on the news feed: a leading chip designer committed 1 billion dollars to a European compute provider, per an item stamped 09:01 AM ET; a bank raised its price objective on a major processor maker to 720 from 620, per an item stamped 09:37 AM ET; and a memory maker's storage unit was reported to be weighing a 2027 listing at a valuation near 150 billion dollars. The positioning desk note recorded a megacap platform company falling about 3 percent near its 750 level with single-stock hedging delta of minus 462 million dollars, the largest negative reading in 30 days by the desk note's account, after a positive 1.5 billion dollar reading the day before. A news-feed item stamped 10:13 AM ET quoted a Federal Reserve bank president asking whether the artificial-intelligence ecosystem is becoming too big to fail.
4.2 Semiconductors and rotation
Provider commentary described strength in chipmakers and artificial-intelligence stocks on Friday; no sector index figure was captured this run, so the size of that strength is not measured. The cash index gained 0.42 percent against 0.51 percent for the broader cash index, so technology trailed slightly on the day. The next scheduled semiconductor catalyst is the memory-chip maker's results after the close on September 30, 2026, with its conference call at 04:30 PM ET, per the verified forward calendar.
4.3 Fed policy and real yields
The ten-year yield index closed at 5.18 percent, up 2 basis points. Its Friday session range ran from 5.16 to 5.23 percent, and the thirty-year closed at 5.50 percent. The Cleveland Federal Reserve president said between 02:47 PM and 02:58 PM ET, per the news feed, that a good economic outlook is pressuring yields up, that artificial-intelligence investment demand is competing for investors in the bond market and that the United States is on an unsustainable fiscal path. Provider commentary described remarks by the New York Federal Reserve president on returning inflation to target as hawkish. The desk note described a volatility spike in long-duration Treasury options around 12:00 PM ET and ten-year and thirty-year yields at two-decade highs this week, by the desk note's account. For a long-duration equity index, a contract near its highs with yields still rising is the central tension of the week ahead.
4.4 Geopolitical backdrop
The Iran story moved toward de-escalation. Provider commentary tied the crude slide to hopes for diplomacy to end the United States and Iran conflict and reopen the Strait of Hormuz. After the 4:00 PM ET cash close, between 04:19 PM and 04:22 PM ET and while futures were still trading ahead of the 5:00 PM ET end of electronic trading, Iran's foreign minister said Iran had conveyed a concrete seven-day plan to the United States that would end with the Strait open, starting when the United States accepts it. The weekend leaves the proposal unanswered with no market open.
4.5 Cross-asset and volatility
The S&P 500 cash index closed at 7,743.41, up 39.28 points or 0.51 percent, and the Nasdaq-100 cash index at 30,608.13, up 129.27 points or 0.42 percent. The volatility index closed at 14.87, down 0.80 points, and the desk note recorded the volatility-of-volatility index at 87.84, down 3 percent. The dollar index fell 0.32 percent to 100.97. Crude settled at 92.41, down 2.33 percent, and gold at 4,321.2, up 0.54 percent. The measured basis tonight is 30,889.25 less 30,608.13, or 281.12 points, from the futures settlement and the cash close.
4.6 Institutional positioning
The positioning report as of September 22, 2026 shows leveraged funds long 54,033 contracts, up 1,353, against short 84,716, up 25,649, a net short of 30,683. Asset managers held 106,240 long against 34,020 short, a net long of 72,220, and dealers held 57,512 long against 115,916 short. The report week included Monday's 867.50 point advance, so the rise in leveraged-fund shorts is consistent with those funds adding short exposure or hedges into the rally, and that reading is interpretation, not a measured attribution. Open interest on the December contract stood at 271,967 on the latest published row for 09/24, down from 274,125 on 09/23; the 09/25 row carries no open-interest figure yet.
5. Flow proxy
The technology exchange-traded fund and the cash index are the flow surfaces for this contract; this run uses the fund and the cash index as the proxy for the positioning dataset available. Levels from them are cash or fund values and are translated into futures terms only with the measured basis of 281.12 points stated.
The desk note used here is the edition published at 5:12 PM ET on Friday, September 25. Its reference price column is the prior session's close, not Friday's, and this run verified it: the cash index reference of 30,478 matches Thursday's 30,478.86 cash close, and the fund's reference of 741 matches the fund console's previous close of 741.06. For the fund the model reads a modeled volatility threshold at 738, a modeled gamma-flip level at 734, a primary gamma concentration at 740, a call-side ceiling at 760 and a put-side base at 730, with gamma tilt 1.073 and gamma notional 274.193 million dollars. The fund closed at 744.50 on the provider's daily record, 4.50 above the primary gamma concentration and 6.50 above the modeled volatility threshold.
For the cash index the model reads a modeled volatility threshold at 29,470, a modeled gamma-flip level at 29,947 and a primary gamma concentration at 30,000, with gamma tilt 1.62 and gamma notional 13.77 million dollars. The published call-side and put-side fields for the cash index, 29,475 and 29,500, both sit beneath the cash close and invert their usual order, so they are recorded and not used for level structure. The mapped key levels are 30,000, 30,500, 29,475 and 31,000, and the mapped confluence levels are 30,022, 30,845, 31,271 and 30,631. The cash close of 30,608.13 sits 108.13 points above 30,500, 391.87 points beneath 31,000 and 661.13 points above the modeled gamma-flip level. The source publishes these thresholds in cash terms only; the futures equivalents in section 3 use this run's measured basis.
The fund's positioning console, updated on Friday, carries a different model and a different sign. It showed a current price of 745.10 against a previous close of 741.06, a daily change of 0.55 percent, call gamma of minus 1.1 billion dollars, put gamma of minus 2.2 billion dollars and next-expiry gamma at 19.23 percent of the total. That console's aggregate reads negative while the desk table's gamma notional reads positive; the two are recorded rather than reconciled, and no level in section 3 rests on either sign. The console's high-volatility-point and low-volatility-point fields, published as 745 and 520, are excluded as low-confidence per the known defect in that pair of fields.
7. Monday calendar
Two days separate Friday's settle from the Sunday 6:00 PM ET reopen. The captured news-feed calendar lists the Bank of Japan meeting minutes and Japanese services producer prices, forecast 3.6 percent against 3.6 percent, at 07:50 PM ET Sunday, per the news-feed calendar and unconfirmed.
The European morning carries remarks by a Bank of England policymaker at 06:00 AM ET Monday, per the news-feed calendar and unconfirmed. The United States morning carries remarks by the President of the European Central Bank at 10:00 AM ET, per the news-feed calendar and unconfirmed. In the afternoon a European Central Bank board member speaks at 12:10 PM ET and the Richmond Federal Reserve president speaks at 01:30 PM ET, both per the news-feed calendar and unconfirmed. The verified forward calendar carries no Monday release and no Monday earnings report.
The single first-order event for the contract on Monday is not a scheduled release but the crude and yield response to the weekend's Iran diplomacy, with Vice Chair for Supervision Bowman at 08:15 AM ET the first scheduled Federal Reserve voice, as reported by the Federal Reserve Board schedule and unconfirmed against the verified forward calendar, and the Richmond Federal Reserve president's remarks at 01:30 PM ET following, per the news-feed calendar and unconfirmed. No structural expiry falls on Monday; the provider lists the December contract's expiration as 12/18/26.
Sources and methodology
The contract levels, averages, oscillator readings, positioning figures and the Monday plan come from our session review of the December Nasdaq-100 E-mini contract, NQZ26, prepared after Friday’s close for the Monday, September 28, 2026 session and updated on Sunday before the 6:00 PM ET reopen. The chart’s daily bar and the provider’s previous close agree, so chart and levels sit on the same December contract. Friday’s extremes are back-solved from the outer pivot pairs, verified against all seven published rungs and matched by the chart’s daily bar. All six settlement averages were computed from a 260-row daily settlement series; the 100-day and 200-day rest partly on thinly traded deferred-contract settlements and carry that caveat. Oscillator readings are cited as published.
The positioning figures come from the desk note published at 5:12 PM ET on Friday, September 25, whose reference column is Thursday’s close, and from the technology fund’s console. The source publishes the cash index thresholds in cash terms only; futures equivalents use the measured basis of 281.12 points. The Sunday reopen prices are delayed public futures quotes read at 7:39 PM ET. Items marked unconfirmed come from the news-feed calendar or the Federal Reserve Board schedule and were not matched on the verified forward calendar; weekend headlines are press items carried on the news feed and none is independently authenticated. The look-back sets the published lines against the completed bar and asserts no fill and no order of events. Scenario ranges are analyst judgment and carry no calibration.
Not captured, and stated nowhere as a figure: any Friday intraday series, a four-hour series, a prior-quarter high or low, a semiconductor sector index figure and any Sunday futures series after the 7:39 PM ET read.
Friday’s outlook for this contract is here, and Monday’s S&P 500 outlook is here. Outlooks for the equity index, technology index, gold and crude contracts are collected on the market outlook page, and our forward trading record is on the performance statement.



