
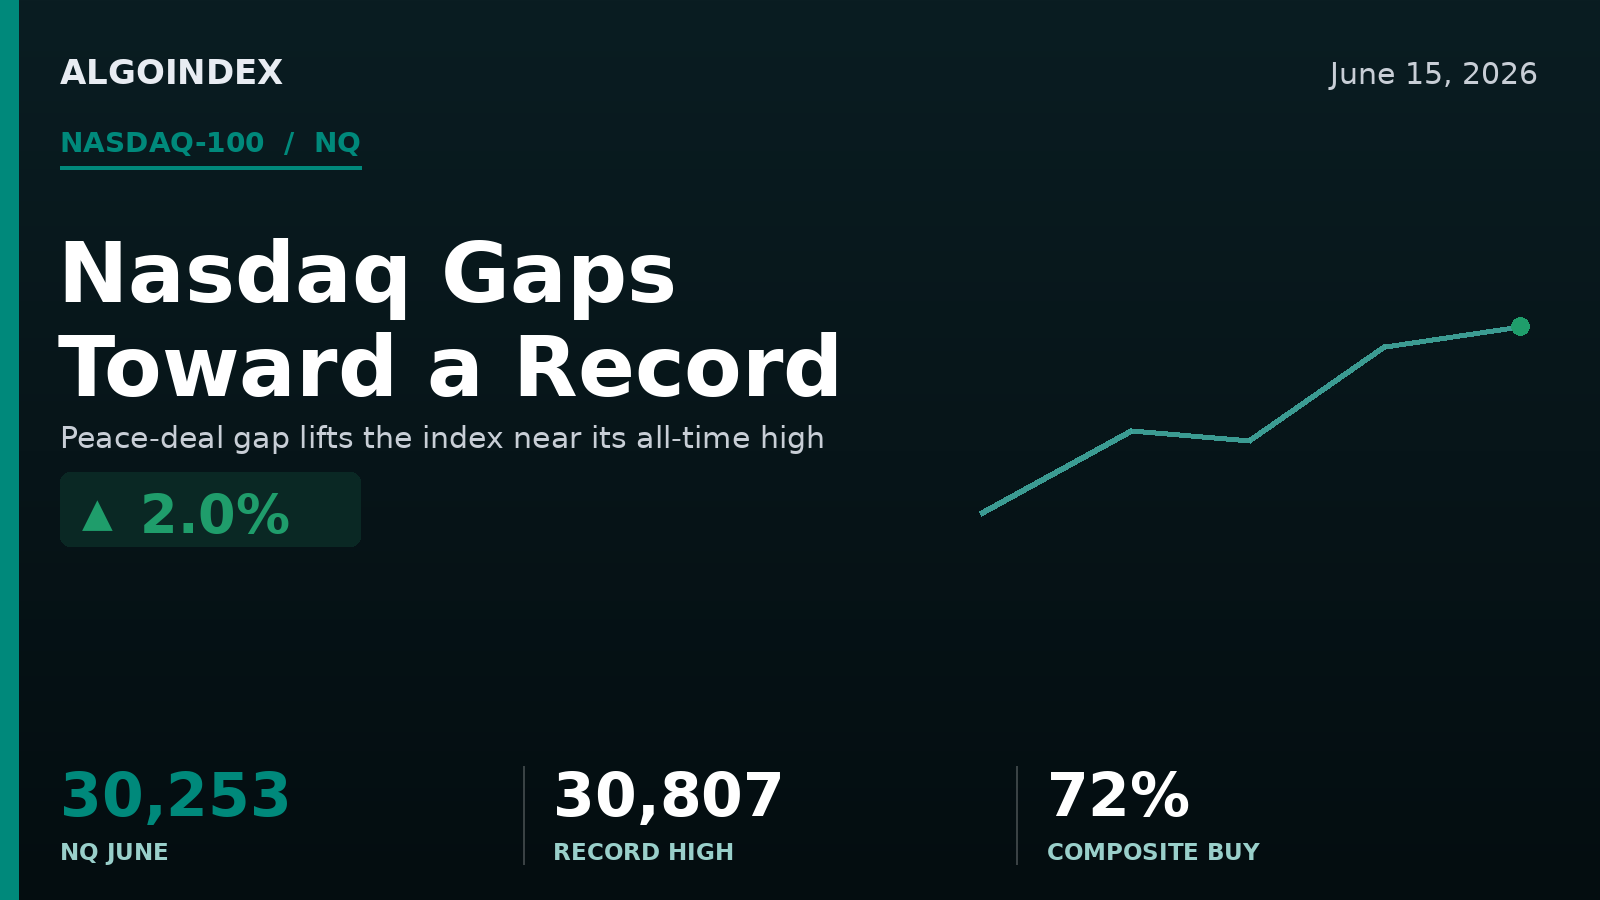
A weekend peace deal has carried the Nasdaq-100 back to within reach of its record high.
The index gapped firmly higher to start the week after the White House confirmed an interim agreement with Iran was complete, paired with authorization to reopen the Strait of Hormuz and remove the naval blockade. Crude sold off, equities and bonds caught a bid, and the relief rally that began late last week extended. The June contract trades near 30,253, up roughly 591 points or 1.99 percent from Friday's 29,662 settle, while the continuous front-month chart prints near 30,595 and the cash index near 30,276.
The technical backdrop is unambiguously constructive. Price sits above every major moving average from the 5-day through the 200-day, the directional trend is positive and strengthening, and the multi-indicator composite reads 72 percent buy with short-term components at 80 percent. The rally has lifted the index to within about 1.8 percent of the all-time high near 30,807. The catch is location and calendar: the index is extended after a two-session vertical move, and a heavy week of event risk sits directly ahead.
Extended, but not yet exhausted
The moving-average stack is in full bullish alignment, shortest above longest, with the 50-day more than 2,000 points beneath spot, the signature of an established uptrend. The nearest meaningful support is the 5-day near 29,411, roughly 800 points below price, which underscores how stretched the index is in the immediate term. Momentum is strong but not terminal: the 14-day stochastic reads near 78.7 percent raw with smoothed components well below that, and relative strength sits near 60, neutral-to-firm with room before a true overbought reading.
The dealer environment reinforces the grind-higher tone. With the Nasdaq fund proxy trading above its volatility-inflection level, the setup is positive-gamma and dip-supported, where dealers buy weakness and sell strength, dampening intraday swings as long as price holds the inflection. A loss of it would flip the environment toward amplified, two-way volatility. This is the same relative-strength lead that powered Friday's grind, now extended on a finished deal.
The calendar caps the runway
Today's data is second-tier and unlikely to override the risk-on impulse. The weight sits a few days out, and it is unusually concentrated: the central-bank rate decision lands Wednesday alongside the volatility-index expiration, the monthly options expiration follows Thursday, and the market is closed Friday for the holiday. The options-flow desk frames that same window as a possible topping timeframe, which is why the upside is best treated as a momentum extension that may stall and reverse around the mid-week decision rather than a clean trend that runs unchecked.
Buy the dip, not the gap
The working bias is long-on-strength, with a preference for buying a controlled pullback into the 30,081 to 30,200 gap structure rather than chasing the open. The first objective is the 30,401 pivot, then the 30,557 cap, then the 30,807 record-high magnet. A sustained loss of 29,871 shifts the bias neutral, and a break of the overnight low at 29,907 is the first warning the gap is being sold. Any headline questioning the durability or implementation of the deal supersedes the technical setup, as does the approach of Wednesday's decision, which caps how far the upside should be pressed into mid-week.
The path of least resistance is higher, but the record high and the Fed are waiting in the same week, and the index has to clear one before it answers to the other.
See how AlgoIndex turns this kind of level-gated read into systematic signals.
View pricing →Foundational guides
New to Nasdaq 100 futures? Start with What Are NQ Futures, the ES, NQ, MES & MNQ point value and contract specs, QQQ gamma exposure (GEX), and market internals: TICK, ADD, VOLD and VIX.



