
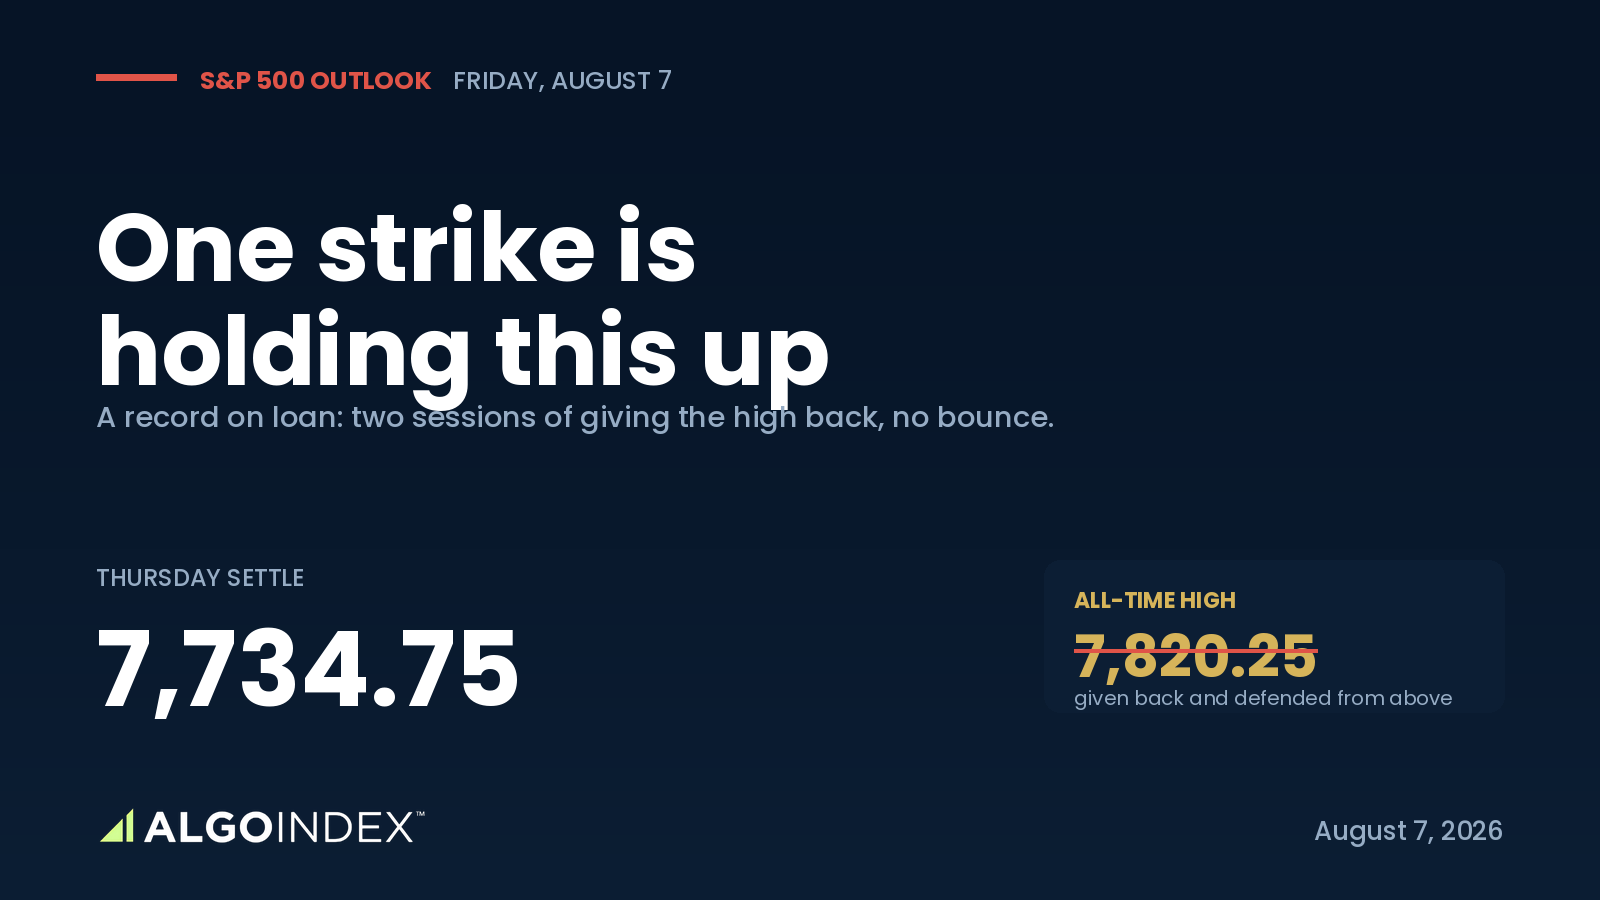
The September E-mini settled 7,734.75 on Thursday, ten and a half points above its low, a single day removed from an all-time high. Roughly 9,000 lots of dealer short puts at one strike are what held it there.
Take that strike away and there is a 54-point stretch beneath with almost nothing in it.
The shape of the session
A range of 46.5 points, 49 per cent of what the contract averages over fourteen days. There was no forceful selling. It leaked, all day, then closed on its lows.
Put together, those describe distribution rather than panic, and the running order tells you why. By 10:13 the cash gauge showed a gain of 0.17 per cent, software already looking ugly: one large enterprise monitoring name had shed roughly 18 per cent on a second-quarter gross margin miss, an advertising technology outfit nearly 20 on light revenue. An hour later that gain had thinned to 0.07 while chipmakers briefly hauled the growth index back up. From noon onward, energy owned the session. Crude climbed on Hormuz reporting, yields backed up, and the whole advance evaporated.
Down 0.85 per cent on the Dow against 0.39 on the Nasdaq. A broader gauge trailing the concentrated growth one by 46 basis points means the typical stock had a worse day than the headline number admits. Puts outtraded calls in the cash index and in the primary tracking fund alike. Internals ran considerably uglier than a decline of 0.18 per cent lets on.
Where the market is standing
Five separate supports sit inside 6.7 points.
The energy shock behind Thursday’s decline is covered separately: Crude Oil (CL): the Strait reopens, just not for everyone, and the growth-index read is in Nasdaq-100 (NQ): sellers didn’t wait for the test.
A stochastic reference marks 7,721.00. The 5-day average lands 7,722.05. Thursday's low came at 7,724.25, the overnight low at 7,726.50. Topping the group, a strike confluence at 7,727.70 scoring 96.15, which the desk note also names as its nearest support and which is where those 9,000 lots of short puts sit.
The contract closed at 7,734.75 and the overnight session has spent all evening pinned around 7,730, probing 7,726.50 twice and failing to reclaim 7,743 either time. The market is compressing on the shelf, not bouncing off it.
Then the ground drops away
This is the part worth sitting with.
Overhead, the confluence ladder is crowded and it is strong. Climbing: 94.10 strength at 7,751.70, then 80.44 at 7,758.70, 82.26 at 7,766.70, 99.32 at 7,774.70, 89.63 at 7,789.70, 99.75 at 7,805.70, 99.71 at 7,828.70. Rung after rung, none of it thin.
Beneath the market there is 7,727.70 at 96.15, and then the next reading of any consequence is 7,673.70 at 73.15. Fifty-four points apart, with a weaker structure at the far end of it.
Technical markers do populate the space. First computed pivot support reads 7,715.75, the positioning pivot 7,707.70, second computed support 7,696.75. Absent from it, though, is the options-driven cushioning that has caught every dip this week. Which is why breaking a seven-point band carries weight far out of proportion to its width.
One number in there carries extra freight: 7,707.70, the desk pivot, lifted on 5 August precisely because mild negative gamma has appeared under the strike. Dealers damp movement above it and amplify beneath. The note states plainly that breaking it flips the posture from carrying longs to leaning short.
Everything says buy, and the direction says weakening
Here is the contradiction, stated plainly.
Composite studies return 100 per cent buy. Not a majority. Every one of thirteen constituents, short, medium and long-term alike, plus the trend component alongside them. Spot trades above each average in the stack from five days out to two hundred. Directional readings at nine days give an index of 33.32, positive movement of 29.42 against 14.40 negative, better than double. Five sessions have put on 2.83 per cent.
Now the opposite column. Stochastic %K has slipped under %D, down to 83.59 from an overbought 88.13, and this advance has produced no such crossover before now. Settlement landed only 22.6 per cent up the daily range. The composite's own direction component, meanwhile, has turned from strong to weakening.
Strong is the current state. Weakening is the derivative. On a session that hands the market a first-order release, the derivative is what to watch.
Nobody is paying for protection
The skew ranking reads 99.60 per cent. The implied volatility ranking reads 16.45 per cent.
Set them beside each other. Upside participation occupies the top half of one per cent of everything this series has ever logged, while insuring against a decline costs less than five sixths of prior readings. Separately, the desk note recorded that a condition of shares and volatility rising together has driven call skew into a 98th percentile across the large-cap, the technology and the industrial tracking funds.
Cheaper again on closer inspection. Implied over one month reads 12.89 per cent where realised gives 14.43. On futures options, implied sits 13.07. At-the-money August pricing has squeezed down near 10 to 12 per cent, and heavy selling on Thursday took a further half point to two points out of the fixed-strike surface.
So a long, crowded, complacent market walks into payrolls with hedges priced about as cheaply as they have been all year. That combination predicts nothing on its own. It does explain why one could travel further than the level structure suggests.
What actually did the damage
Not domestic data. Thursday's numbers were excellent in isolation.
Claims arrived at 199,000 where forecasters wanted 205,000. Continuing claims registered 1.801 million. Productivity, on a preliminary read, jumped to 1.4 per cent against expectations of 0.6 and a prior of 0.3. Unit labour costs, also preliminary, eased to 1.3 per cent where 2.1 had been pencilled in. Rising output per hour alongside falling labour costs is the most disinflationary pairing this data set can generate, and on any normal day it lifts stocks.
Energy buried it. Five basis points came out of the ten-year, lifting it to 4.66 per cent, and the driver was what oil implies for prices rather than any optimism about growth. Currency firmed with it. Yields up, currency up and crude up together makes the least hospitable arrangement a richly valued index can meet.
Airlines wore the direct hit, a pair of majors giving up 2.74 and 2.61 per cent to fuel costs. Energy travelled the other way: a producer added 4.14 per cent, an oil services name 3.27, an integrated major 1.51. Clean rotation on a single theme, entirely coherent.
The weekend problem
Thursday afternoon escalated in stages.
Reporting at 11:49 said American and Israeli hulls would be excluded from the waterway under a prospective deal. Three and a half hours later came word of Iranian strikes on hostile positions inside the waterway, plus two explosions on Qeshm Island by the entrance. Crude accelerated across that whole sequence.
The American president spoke a little before half past four, describing the channel as sort of open, confirming he is personally in the negotiation, doubting Tehran could hold out, forecasting an end to the fighting, and calling munitions supply unlimited. Cutting both ways at once: a live negotiation and a live readiness to escalate.
Worst came last. Just before a quarter to five, Saudi officials reported drones and missiles moving in a way that suggests strikes arriving from two directions, listed the sites at risk as civilian and economic, including power and fuel installations, ports and airports, and said every necessary measure would be taken in response. Separately, Houthi attacks reportedly killed dozens of soldiers in Yemen and injured civilians inside the kingdom.
Frame that for Friday. Carry length past the bell and you own two full days of news risk that cannot be hedged. Which argues for supply arriving in the afternoon whatever the morning's payroll reaction produced, and cheap protection raises the odds that the hedging actually gets done rather than postponed.
Who is holding what
Positioning as of 28 July shows the institutional long concentrated in one category and dealers structurally short against it.
Allocators carry 214,471 short against 1,159,241 long, so 944,770 net long. Dealers and intermediaries run 923,295 short against 166,101 long, 757,194 net short, with 41,446 fresh shorts added over the week. Commercial accounts sit 95,929 net short. Fast-money books remain 297,476 net short, though they trimmed 16,259 of those shorts and put on 9,130 longs, modest covering. Front-contract open interest stands at 2,086,832.
The familiar shape: real money long, dealers on the other side, the fast-money community leaning against the trend and easing that lean.
Concentration is what makes it brittle. One category holding a directional bet approaching a million contracts, at the same moment skew occupies a 99th percentile, leaves few buyers at the margin and plenty of sellers. None of that forecasts anything by itself. It does explain how a decline from these levels gathers pace once it enters thin structure.
What Friday hinges on
Payrolls at 8:30, consensus 80,000 against a 57,000 prior, unemployment expected to hold 4.2 per cent, wages expected at 0.3 per cent monthly.
Wages matter at least as much as the headline count here, and the reason is policy. That 29 July vote split nine to three, the three pressing for an immediate quarter-point rise. Futures have moved a fully priced increase from October out to December following the last weak jobs report. Positioning is built around tightening, not easing.
The asymmetry follows from that. A hot number does more than trim expectations of easing; it drags an actual rise nearer, and this week has already shown how much the index dislikes that channel. Wages printing 0.4 per cent or above does more damage than any headline count could. Soft on both lines is the constructive case.
A secondary item deserves more billing than usual. Twelve-month inflation expectations land at 11:00, forecast 3.65 per cent where the prior read 3.67. Since Thursday's decline came down the inflation channel, that number carries more weight than it normally would.
The trade
Sell the failed retest, never the release itself. Work the band from 7,724.00 up to 7,728.00, entered once a fifteen-minute bar has closed under Thursday's low and price has come back into the band and been rejected there. Nothing before 9:45.
Risk sits at 7,743.00, one placement clearing the computed daily pivot and the overnight high together, roughly 17 points from a fill at 7,726. Book at the positioning pivot, then second computed support, then the first catch under the vacuum, paying about 1.1, 1.7 and 3.1 to one. One fifteen-minute bar closing over 7,747.00 finishes the idea, since one move like that takes back the overnight high, the pivot and the base of the confluence above them.
There is a long, and it is conditional and narrow. Payrolls in line to soft, wages at 0.3 or under, Thursday's low held through the reaction, and a fifteen-minute bar closing over the pivot after 9:45. Buy the zone from 7,743.00 up to 7,748.00, risk to 7,722.00, one placement sitting under the 5-day average, Thursday's low and the stochastic marker, and work toward 7,762.25, then 7,774.70, then 7,803.60.
Stand down completely under four conditions. If the contract opens inside the compression zone and no fifteen-minute bar closes outside it by half past ten. If the opening range measures under 12 points. If a Gulf headline lands inside a quarter hour of a planned entry. Or if the opening range runs past 60 points, which means levels get traversed too fast for these stops to hold any meaning and the whole thing needs rebuilding from what the release leaves behind.
One override outranks everything. A believable story about the waterway reopening, paired with a sharp drop in oil, takes away what caused Thursday's weakness in the first place. Step aside whatever the chart says.
What we are watching
Most probable sequence: payrolls lands near enough to consensus that December pricing barely shifts, the contract holds its support band through the reaction, tries to take the pivot back during the morning, then cannot hold it as weekend hedging accumulates after lunch. Close in the lower half, somewhere around 7,715 to 7,740. Nothing gets resolved and the shelf survives into Monday.
Weight the constructive path 40 per cent, the corrective one 37, the adverse one 23. The daily structure remains whole, and genuine damage needs a close under the weekly low more than 190 points beneath here. With the 20-day average sitting 172 points below spot, you can measure both how stretched this advance has become and how far a mean reversion could run before anyone questions the primary trend.
The number to watch is a seven-point band. Above it, dealers damp and the grind continues. Below it, they amplify and there is very little in the way until 7,673.70.The complete data picture
Every number behind Friday’s plan, charted first; the full numeric reference follows underneath.
Full numeric reference , every remaining figure from the review
Full data reference
Every figure behind the analysis above. September E-mini futures, contract ESU26, session of Thursday 6 August 2026, prepared for Friday 7 August. Index points unless marked otherwise. Cash equivalents use a basis band of 25 to 28 points.
| Reference | Value |
|---|---|
| Settlement | 7,734.75, down 0.18 per cent |
| Session range | 7,724.25 to 7,770.75, derived from the published six-level pivot set |
| Realised range | 46.5 points, 49 per cent of the 14-day average true range |
| Distance above the session low at the settle | 10.5 points |
| Close position in range | 22.6 per cent of the way up |
| Cash index close | approximately 7,710, down 0.18 per cent |
| Dow | down 0.85 per cent |
| Nasdaq 100 | down 0.39 per cent |
| Five-session change | up 2.83 per cent |
| Intraday readings | up 0.17 per cent at 10:13, up 0.07 per cent at 11:12 |
| Reference | Value |
|---|---|
| Reopen | 18:00 Eastern at 7,735.00 |
| Overnight high | 7,742.50 |
| Overnight low | 7,726.50 |
| Late-evening trade | pinned around 7,730 in a 16-point band |
| Overnight volume | 33,420 contracts |
| Four-hour bar | open 7,732.75, high 7,735.25, low 7,726.50, close 7,730.00, under nine points |
| One-hour bar | open 7,732.25, high 7,734.25, low 7,728.50, close 7,729.75, six points |
| Reference | Value |
|---|---|
| All-time and 52-week high | 7,820.25, set Wednesday 5 August; price 1.13 per cent below |
| 52-week low | 6,401.75, set 31 March; price 20.78 per cent above |
| One-month low | 7,324.00, set 29 July |
| 13-week low | 7,292.25 |
| Move from 29 July to 5 August | approximately 496 points over seven sessions |
| One-month change | up 2.40 per cent |
| Three-month change | up 4.21 per cent |
| Weekly bar | open 7,550.00, high 7,820.25, low 7,542.75, current approximately 7,730 |
| Position in the weekly range | approximately 68 per cent of a 277.5-point span, from 100 per cent on Wednesday |
| Weighted alpha | 17.89 |
| Reference | Value |
|---|---|
| 5-day | 7,722.05, spot above by approximately 9 points |
| 20-day | 7,558.70, spot above by approximately 172 points |
| 50-day | 7,546.68, spot above by approximately 184 points |
| 100-day | 7,327.45, spot above by approximately 403 points |
| 200-day | 7,159.32, spot above by approximately 571 points |
| Year-to-date | 7,217.75, spot above by approximately 513 points |
| Reference | Value |
|---|---|
| Relative strength | 62.59 at 14 days, 67.01 at 9, 60.08 at 20, 57.24 at 50, 56.03 at 100 |
| Where 14-day strength reaches 70 | approximately 7,901 |
| Where 14-day strength returns to 50 | approximately 7,557 |
| Raw stochastic | 82.27 per cent on the 9, 14 and 20-day |
| Stochastic %K | 83.59, crossed beneath %D |
| Stochastic %D | 88.13 |
| 100-day raw stochastic | 93.80 per cent |
| Reference | Value |
|---|---|
| 9-day | index 33.32, positive 29.42, negative 14.40 |
| 14-day | index 23.21, positive 24.65, negative 16.20 |
| 50-day | index 9.06 |
| 100-day | index 6.30 |
| Composite | 100 per cent buy across all thirteen constituent studies |
| Composite strength | strong; composite direction weakening |
| Reference | Value |
|---|---|
| 9-day | true range 92.04 or 1.19 per cent, daily range 101.69 or 1.32 per cent |
| 14-day | true range 94.36 or 1.22 per cent, daily range 97.64 or 1.26 per cent |
| 20-day | true range 95.47 or 1.23 per cent, daily range 91.64 or 1.19 per cent |
| 50-day | true range 94.78 or 1.23 per cent, daily range 99.24 or 1.28 per cent |
| 100-day | true range 86.20 or 1.11 per cent, daily range 97.77 or 1.26 per cent |
| Historic volatility | 15.74 per cent at 9 days, 14.84 per cent at 14 |
| Futures options implied | 13.07 per cent |
| Cash one-month implied against realised | 12.89 per cent against 14.43 per cent |
| Implied volatility ranking | 16.45 per cent |
| Generalized autoregressive ranking | 53.86 per cent |
| At-the-money August implied | approximately 10 to 12 per cent |
| One true range envelope | 7,640 to 7,829 |
| Options-implied one-day envelope | 7,684 to 7,786, from a 0.66 per cent move |
| Cash-index implied envelope | 7,672 to 7,798, from a 62.86-point move |
| Five-day implied move | 1.56 per cent |
| Reference | Value |
|---|---|
| 7,742.50 | the overnight high |
| 7,743.25 | the computed daily pivot |
| 7,751.70 | confluence, cash 7,724, strength 94.10 |
| 7,758.70 | confluence, cash 7,731, strength 80.44 |
| 7,762.25 | 1st computed pivot resistance |
| 7,766.70 | confluence, cash 7,739, strength 82.26 |
| 7,770.75 | Thursday's session high |
| 7,774.70 | confluence, cash 7,747, strength 99.32 |
| 7,781.53 | the computed target price |
| 7,788.85 | one deviation of resistance |
| 7,789.70 | confluence, cash 7,762, strength 89.63 |
| 7,789.75 | 2nd computed pivot resistance |
| 7,797.70 | confluence, cash 7,770, strength 90.58 |
| 7,803.60 | the options-implied one-day ceiling |
| 7,805.70 | confluence, cash 7,778, strength 99.75, the highest on the upside ladder |
| 7,808.75 | 3rd computed pivot resistance |
| 7,811.25 | two deviations of resistance |
| 7,820.25 | the all-time and 52-week high |
| 7,827.70 | the desk upper reference, cash 7,800 |
| 7,828.45 | three deviations of resistance |
| 7,828.70 | confluence, cash 7,801, strength 99.71 |
| 7,836.70 / 7,843.70 / 7,851.70 / 7,874.70 | progressively weaker confluences |
| 7,850.25 | where the 3 and 10 day crossover stalls |
| 7,901.14 | where 14-day strength would reach 70 |
| 7,927.70 | the primary call-side concentration, cash 7,900 |
| 8,027.70 | the primary gamma concentration strike, cash 8,000 |
| Reference | Value |
|---|---|
| 7,727.70 | the strike confluence at 96.15 strength, cash 7,700, site of the dealer short-put position |
| 7,726.50 | the overnight low |
| 7,724.25 | Thursday's session low |
| 7,722.05 | the 5-day moving average |
| 7,721.00 | the stochastic reference |
| 7,715.75 | 1st computed pivot support |
| 7,707.70 | the dealer-positioning pivot, cash 7,680, raised 5 August |
| 7,702.70 | the desk second support, cash 7,675 |
| 7,701.70 | the options-implied one-day low |
| 7,696.75 | 2nd computed pivot support |
| 7,680.65 | one deviation of support |
| 7,673.70 | the first catch beneath the vacuum, cash 7,646, strength 73.15 |
| 7,671.38 | the stochastic reference beneath |
| 7,669.25 | 3rd computed pivot support |
| 7,658.25 | two deviations of support |
| 7,650.70 | confluence, cash 7,623, strength 64.82 |
| 7,641.05 | a further reference |
| 7,630.68 | 38.2 per cent retracement of the four-week advance |
| 7,627.70 | the desk third support, cash 7,600, strength 67.66 |
| 7,618.55 / 7,591.25 | further references |
| 7,590.70 | the dealer gamma flip level, cash 7,563 |
| 7,558.70 | 20-day moving average |
| 7,556.57 | the relative strength midpoint |
| 7,552.70 | the volatility inflection level, cash 7,525 |
| 7,546.68 | 50-day moving average |
| 7,542.75 | the weekly low |
| 7,427.70 | the primary put-side concentration, cash 7,400 |
| 7,327.45 | 100-day moving average |
| 7,324.00 | the one-month low |
| 7,292.25 | the 13-week low |
| 7,159.32 | 200-day moving average |
| Reference | Value |
|---|---|
| Upside | 7,724 at 94.10, 7,731 at 80.44, 7,739 at 82.26, 7,747 at 99.32, 7,762 at 89.63, 7,770 at 90.58 |
| Upside, continued | 7,778 at 99.75, 7,785 at 80.14, 7,793 at 90.09, 7,801 at 99.71, 7,809 at 94.16, 7,816 at 91.00, 7,824 at 98.14, 7,847 at 98.79 |
| Downside | 7,700 at 96.15, then 7,646 at 73.15, 7,623 at 64.82, 7,600 at 67.66 |
| Downside, continued | 7,523 at 84.87, 7,515 at 78.97, 7,453 at 76.45, 7,422 at 73.52, 7,399 at 92.51, 7,353 at 86.81 |
| The vacuum | 54 points between 7,700 and 7,646 in cash terms, approximately 7,727.70 to 7,673.70 in futures |
| Reference | Value |
|---|---|
| Cash index gamma index | 4.756 |
| Gamma tilt | 1.449 |
| Gamma notional | 1.101 billion dollars |
| Call gamma | 2.27 billion |
| Put gamma | minus 5.77 billion |
| Put open interest | 13.642 million |
| Call open interest | 10.141 million |
| Put-to-call open interest | 1.28 |
| Heaviest gamma expiry | 20 August, the week of the 21 August monthly expiration |
| Heaviest delta expiry | 18 February 2027 |
| Primary tracking fund | gamma tilt 1.197, gamma notional 467.8 million dollars |
| Small-cap tracking fund | gamma notional minus 335.3 million, the only negative reading in the complex |
| 25-delta risk reversal | minus 0.029 for the cash index, minus 0.035 for the Nasdaq |
| Skew ranking | 99.60 per cent |
| Desk reference level | 7,775 in the cash index |
| Reference | Value |
|---|---|
| Cash index | plus 5 billion dollars of delta notional |
| Composition | approximately plus 7 billion from put selling against minus 2 billion from call selling, mostly same-day expiry |
| Single stocks | relatively flat, muted in either direction |
| Nasdaq complex | minus 2.5 billion dollars, dominated by same-day call selling |
| Fixed-strike surface | declined roughly 0.5 to 2 volatility points across strikes |
| The support mechanism | an approximately 9,000-lot dealer short put position at the 7,700 cash strike |
| Reference | Value |
|---|---|
| Commercials | 1,429,304 long up 41,781, 1,525,233 short up 30,791, net short 95,929 |
| Non-commercials | 257,703 long up 1,553, 274,899 short up 1,965, net short 17,196 |
| Dealers and intermediaries | 166,101 long up 17,117, 923,295 short up 41,446, net short 757,194 |
| Asset managers | 1,159,241 long up 15,518, 214,471 short down 93, net long 944,770 |
| Fast-money funds | 155,964 long up 9,130, 453,440 short down 16,259, net short 297,476 |
| Other reportables | 49,486 long down 2,788, 52,711 short up 3,305 |
| Front-contract open interest | 2,086,832 |
| Reference | Value |
|---|---|
| Initial claims | 199,000 against a 205,000 forecast |
| Continued claims | 1.801 million |
| Preliminary productivity | 1.4 per cent against a 0.6 per cent forecast and a 0.3 per cent prior |
| Preliminary unit labour costs | 1.3 per cent against a 2.1 per cent forecast and a 1.8 per cent prior |
| Ten-year yield | 4.66 per cent, up 5 basis points |
| Volatility index | 15 |
| Volatility-of-volatility index | 88 |
| July policy vote | nine to three, with three dissents in favour of a 25 basis point increase |
| Rate expectations | futures fully price an increase by December, pushed back from October |
| Reference | Value |
|---|---|
| Enterprise monitoring name | down roughly 18 per cent on a second-quarter adjusted gross margin miss |
| Advertising technology name | 335.67, down 19.66 per cent on a revenue shortfall |
| Consumer beverage name | 23.77, down 18.46 per cent |
| Storage name | 1,258.58, down 6.81 per cent |
| Financial software name | down 1.84 per cent |
| Legacy technology name | down 1.06 per cent |
| European lithography name | 1,704.37, up 1.56 per cent |
| Networking and custom silicon name | 420.57, up 0.55 per cent |
| Analog name | up 0.24 per cent |
| Exploration and production name | 56.04, up 4.14 per cent |
| Oil services name | 51.54, up 3.27 per cent |
| Integrated major | 189.23, up 1.51 per cent |
| Airlines | down 2.61 per cent and 2.74 per cent |
| E-commerce and cloud overhang | a 3 August filing to sell 15 million shares, approximately 4 billion dollars; rejected 280, traded near 270, next reference 250 |
| Put against call volume, cash index | 1.28 million against 984,150 |
| Put against call volume, tracking fund | 2.51 million against 1.856 million |
| Policy cross-current | an executive order targeting polysilicon signed at 16:13 |
| Reference | Value |
|---|---|
| China dollar exports | up 23.9 per cent year on year against a 22.2 per cent poll |
| China trade surplus | 112.5 billion dollars against a 107 billion poll |
| China surplus with the United States | 28 billion dollars |
| China yuan exports and imports | up 17.8 per cent and 21.2 per cent |
| Japanese household spending | minus 3.3 per cent year on year against a 0.9 per cent forecast |
| Reference | Value |
|---|---|
| Entry zone | 7,724.00 to 7,728.00 on a failed retest from beneath |
| Entry condition | a fifteen-minute close below 7,724.25, then a retracement into the band that is rejected |
| Stop | 7,743.00, above the computed daily pivot and the overnight high |
| Risk from a 7,726.00 midpoint | approximately 17 points |
| Target 1 | 7,707.70, approximately 18 points |
| Target 2 | 7,696.75, approximately 29 points |
| Target 3 | 7,673.70, approximately 52 points |
| Reward ratios | approximately 1 to 1.1, 1 to 1.7, 1 to 3.1 |
| Invalidation | a fifteen-minute close above 7,747.00 |
| Macro override | a credible reopening headline with a sharp decline in crude; a wage print at 0.4 per cent or higher strengthens the setup |
| Reference | Value |
|---|---|
| Trigger | payrolls in line to soft with wages at or beneath 0.3 per cent, 7,724.25 held, then a fifteen-minute close above 7,743.25 after 09:45 |
| Entry zone | 7,743.00 to 7,748.00 |
| Stop | 7,722.00, approximately 23 points |
| Target 1 | 7,762.25, approximately 17 points |
| Target 2 | 7,774.70, approximately 29 points |
| Target 3 | 7,803.60, approximately 58 points |
| Reward ratios | approximately 1 to 0.7, 1 to 1.2, 1 to 2.5 |
| Invalidation | a fifteen-minute close back beneath 7,727.70 |
| Reference | Value |
|---|---|
| Path A, constructive | 40 per cent. Payrolls 70,000 to 110,000 with wages at or under 0.3 per cent. Holds 7,727.70, reclaims 7,743.25, grinds into 7,762 to 7,775. Close 7,755 to 7,790. |
| Path B, corrective | 37 per cent. Payrolls above 120,000 or wages at 0.4 per cent or higher. Loses 7,721.00 in the first hour, travels to the pivot, opens 7,696.75 then 7,673.70. Close 7,680 to 7,715. |
| Path C, adverse | 23 per cent. A print beneath 40,000, or a Gulf escalation, or both. Gap-down open, the pivot fails, the vacuum is traversed in one impulse toward 7,650.70 and possibly 7,627.70. Close beneath 7,680. |
| Low band | 7,672 to 7,700 |
| Mid band | 7,708 to 7,775, approximately 60 per cent probability |
| High band | 7,786 to 7,812 |
| Working range assumption | 75 to 95 points, against Thursday's 46.5 |
| Overnight band absent headlines | 7,715 to 7,750 |
| Reference | Value |
|---|---|
| Compression | opens inside 7,724 to 7,743 with no fifteen-minute close outside the band by 10:30 |
| Narrow open | opening range width under 12 points |
| Headline | any Gulf headline inside 15 minutes of a planned entry |
| Wide open | opening range exceeding 60 points |
| Opening-range guidance | under 15 points signals absorption, over 40 points signals genuine repricing |
| Standing rules | no entries before 09:45, none after 16:00 |
| Reference | Value |
|---|---|
| 02:00 | German industrial production monthly, forecast 0.2 per cent, prior 0.9 per cent; annual forecast 0.1 per cent |
| 02:00 | German exports monthly, forecast 0.5 per cent, prior 0.9 per cent |
| 02:00 | German imports monthly, forecast 2.0 per cent, prior minus 2.5 per cent |
| 02:00 | German trade balance, forecast 17.2 billion, prior 19.1 billion |
| 08:30 | Nonfarm payrolls, forecast 80,000, prior 57,000, the first-order event |
| 08:30 | Unemployment rate, forecast 4.2 per cent, prior 4.2 per cent |
| 08:30 | Private payrolls, forecast 80,000, prior 49,000 |
| 08:30 | Average hourly earnings, forecast 0.3 per cent monthly and 3.5 per cent annual, both unchanged |
| 08:30 | Average workweek, forecast 34.3, prior 34.3 |
| 08:30 | Canadian employment change, forecast 20,000, prior 18,200; unemployment 6.5 per cent, unchanged |
| 10:00 | A Federal Reserve speaker |
| 10:00 | Canadian purchasing index, prior 56.2 |
| 11:00 | One-year inflation expectations, forecast 3.65 per cent, prior 3.67 per cent |
| 15:00 | Consumer credit, forecast 12.0 billion, prior minus 0.18 billion |
| 12 August | consumer prices, core annual forecast 2.5 per cent against 2.6 prior, headline 3.4 against 3.5 |
| 21 August | the monthly expiration, the heaviest gamma expiry on the board |
| Reference | Value |
|---|---|
| The support band, restated | five distinct supports occupy 6.7 points between 7,721.00 and 7,727.70 |
| Rounded band shorthand | 7,721 to 7,728, and in round terms the 7,727 shelf against the 7,751 and 7,759 confluences above |
| The vacuum, in round terms | approximately 54 points, from the 7,727 shelf down to the 7,673 catch |
| Upside supply band | 7,762 to 7,771, needing absorption before the 7,775 confluence is reachable |
| The heavy support zone | 7,543 to 7,559, containing the weekly low, the 20-day, the strength midpoint, the volatility inflection and the 50-day |
| First genuine structural damage | requires a close beneath 7,542.75, more than 190 points away |
| 4-hour change of character | confirmed by a close beneath 7,724.25; negated by a close back above 7,770.75 |
| The all-time high, rounded | 7,820, shadowed by three further references inside nine points |
| Payroll thresholds | in line to modestly firm at 70,000 to 110,000; hot above 120,000; materially weak beneath 40,000; consensus 80,000 |
| Cash index basis | approximately 25 points at the close, with the desk using 27.7 for its own conversions |
| One true range, restated | 94.36 points on the 14-day, giving an outer envelope rather than a working expectation |
| Overnight probe count | the session tested 7,726.50 twice without reclaiming 7,743 |
| Session volume context | overnight volume of 33,420 contracts against front-contract open interest of 2,086,832 |
| Global demand signal | China dollar exports up 23.9 per cent, alongside reports of added sanctions and drone curbs in a trade retaliation |
| Time note | payrolls prints a full hour before the cash open, so the opening range is a second reading rather than a first |
| Instrument | the S&P 500 E-mini, front month |
| Stochastic crossover context | %K beneath %D from above the 80 threshold is a bearish crossover from overbought territory, the first of this advance |
| Saudi statement window | 16:40 to 16:44 Eastern, minutes before the close |
| Strike reports | 15:24 and 15:25 Eastern |
| 14-day true range, rounded | 94 points |
| Relative strength detail | 57.24 on the 50-day and 56.03 on the 100-day; the 14-day directional set reads 23.21 with positive at 24.65 |



