December crude rose 0.31 on Friday, or 0.34 percent, to settle at 90.83. It was the second higher settle in a row. The session ran from 89.07 to 92.53, a 3.46 point range, and the settle finished at 50.9 percent of it. That range was 0.75 times the 14-day average daily range of 4.61 points, the narrowest since 10/30. Over the week the contract fell 13.29, or 12.76 percent, from the 104.12 settle of 10/30.
Friday's short card traded early. The card, published at Thursday's settle, was a short from 92.00 to 92.30 with a 93.00 stop. The 10:30 PM ET bar on Thursday evening ran to 92.53, through the band. Target 1 at 91.30 traded in the 12:00 AM ET bar. Target 2 at 90.45 followed in the 3:00 AM ET bar, and Target 3 at 89.60 in the 3:30 AM ET bar. The stop did not trade. No fill and no result are asserted.
The dollar index rose 0.74 percent to 102.30 after the employment report. Crude edged higher with it; these moves coincided. The provider's commentary said crude found support and that gains were limited by signs of progress in diplomacy on Iran; this is attributed commentary and unconfirmed. The series does not establish that any single report caused a particular move.
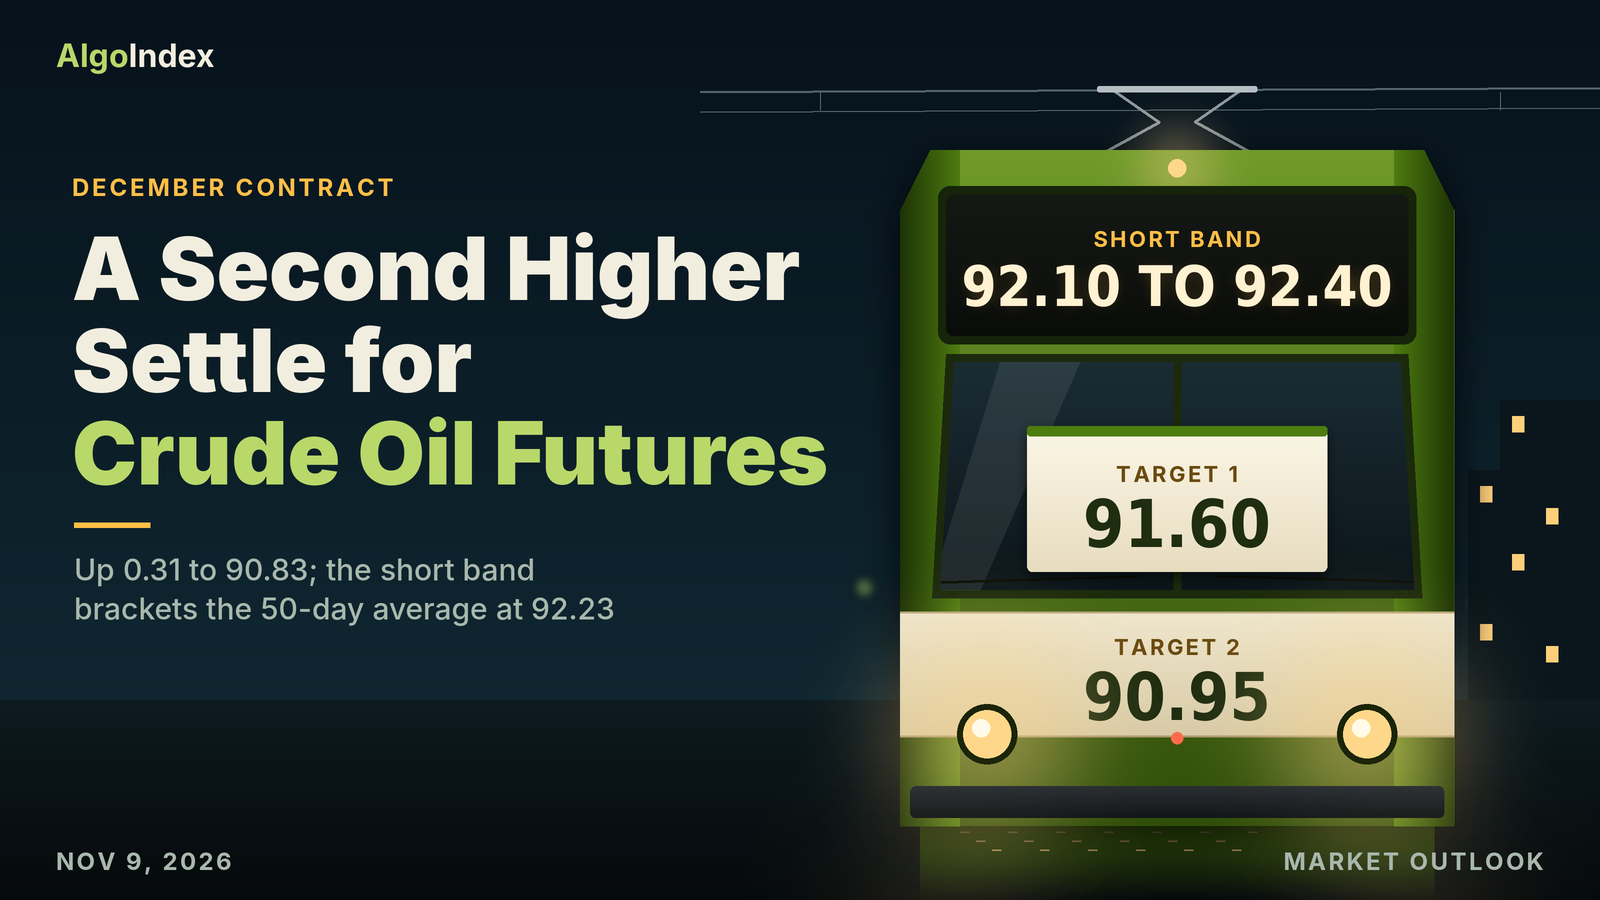
Monday's setup is a short from 92.10 to 92.40, around the 50-day average at 92.23 and beneath Pivot R1 at 92.55, with a 92.90 stop. The whole band sits above the 90.83 settle. Target 1 at 91.60 and Target 2 at 90.95 sit above the settle too. Only Target 3, the extended 90.30, sits beneath it. Globex reopens at 6:00 PM ET on Sunday.
December crude settled at 90.83, up 0.31 or 0.34 percent, at 50.9 percent of an 89.07 to 92.53 range. The settle sits beneath the 5-day, 9-day, 20-day and 50-day averages and above the 100-day and 200-day. Resistance starts at the 91.09 stall price, then the 91.18 cash-hours high and the 91.20 open, with the 50-day average at 92.23 higher up. Support starts at the Pivot Point at 90.81, then Thursday's 90.52 settle and the 90.32 projection. The setup is a short from 92.10 to 92.40, with a 92.90 stop and targets at 91.60, 90.95 and an extended 90.30. Target 1 and Target 2 sit above the settle; only Target 3 sits beneath it.
The Nov 6 short band traded at 10:30 PM ET, and all three targets followed by 3:30 AM ET
First, the grading. In Friday's outlook we set a short on the December contract from 92.00 to 92.30, stop 93.00, with targets at 91.30, 90.45 and an extended 89.60. The card was published at Thursday's settle, so it covers Friday's whole session from the 6:00 PM ET reopen. A settle above the 93.17 stall would negate it. Two consecutive 30-minute closes above 92.30 would remove the edge. The order of events comes from the 30-minute bars.
The session opened at 91.20, 80 cents under the band. The 9:30 PM ET bar reached 91.76. Then came the 10:30 PM ET bar. It ran to 92.53, the session high, through the whole band and 23 cents over its 92.30 top. That print sat 47 cents beneath the 93.00 stop. The bar closed at 91.70.
The targets came overnight. The 11:00 PM ET and 11:30 PM ET bars traded back into the band, to 92.16 and 92.13. The 11:30 PM ET bar then fell to 91.34, 4 cents short of Target 1. The 12:00 AM ET bar fell to 91.06, 24 cents through Target 1 at 91.30. The 1:00 AM ET bar came back up to 92.00, the band's bottom, and closed at 91.75. The 3:00 AM ET bar then fell to 89.75, 70 cents through Target 2 at 90.45. The 3:30 AM ET bar fell to 89.53, 7 cents through Target 3 at 89.60.
The low came an hour later. The 4:30 AM ET bar printed 89.07, 53 cents beneath Target 3. No 30-minute bar closed above 92.30 at any point. The highest close was 91.95, in the 11:00 PM ET bar. So the card's acceptance condition never printed, and the stop never traded. The 2:30 PM ET settle came at 90.83, 38 cents above Target 2 and 2.34 beneath the 93.17 line. No fill and no result are asserted.
The session bands mostly held. The night band of 89.80 to 92.40 met bars from 90.89 to 92.53, 13 cents over its top. London traded 89.07 to 91.14 against 89.60 to 92.20, 53 cents through its bottom. The morning traded 89.62 to 91.09, inside 89.20 to 92.60. The afternoon traded 89.55 to 91.12, inside 89.20 to 92.40.
The scenario cases split. The low-range case of 89.60 to 92.20 broke at both ends, by 53 cents at the low and 33 cents at the high. The most likely case, 88.70 to 92.90, held the session. It had 37 cents to spare at each end. The high-range case, 87.60 to 94.20, held too. So did one average true range around Thursday's settle, 86.02 to 95.02.
The weighted path had the contract holding between the Pivot Point at 89.50 and Pivot R1 at 92.34. It called for a test of the 92.01 to 92.34 band that stalls beneath R1. The 10:30 PM ET bar reached 92.53, 19 cents above R1, and closed at 91.70. The 4:30 AM ET low of 89.07 sat 43 cents beneath the Pivot Point. The settle came back inside, at 90.83. The alternative, a settle above 93.17, did not print. Nor did the other side, a move beneath Pivot S1 at 87.67 before any rebound; the low held 1.40 above it.
The macro override named a weaker employment report that pulls the dollar lower, or weekend headline risk on diplomacy. Payrolls came in at 165 thousand against a forecast of 70 thousand, per the news-feed calendar. The dollar index rose 0.74 percent.
A 0.34 percent gain to 90.83 inside a 3.46 point range, the narrowest since 10/30
The high came first. From the 6:00 PM ET reopen to 3:00 AM ET the bars held between 90.89 and 92.53. They closed that window at 91.00. The 92.53 high printed in the 10:30 PM ET bar on Thursday evening.
The decline came in the London session. The 3:00 AM ET bar fell 66 cents to 90.34. The 4:00 AM ET bar fell 79 cents, from 90.01 to 89.22, the largest decline of any 30-minute bar. The 89.07 low printed in the 4:30 AM ET bar. The 5:00 AM ET bar then rose 98 cents, from 89.22 to 90.20. That was the largest gain of any bar.
The employment report bar was contained. The 8:30 AM ET bar traded between 90.71 and 91.41 and closed at 90.79. From 3:00 AM ET to the 9:30 AM ET cash open the contract traded between 89.07 and 91.41. The 9:00 AM ET bar closed that window at 90.71.
The cash hours were narrower. From 9:30 AM ET to 4:00 PM ET the bars held between 89.55 and 91.18. The 1:00 PM ET bar made the 89.55 low. The 1:30 PM ET bar rose 55 cents to 90.51, and the 2:00 PM ET bar closed at 90.88. The settle was fixed at 2:30 PM ET at 90.83. The 91.18 high of the window came in the 3:00 PM ET bar, after the settle. The 4:30 PM ET bar closed at 90.34, 49 cents beneath the settle; that is a post-settlement quote.
Friday printed a higher high and a higher low. Its 92.53 high sat 1.21 above Thursday's 91.32. Its 89.07 low sat 2.42 above Thursday's 86.65. Settlements over six sessions read 104.12, 96.46, 96.09, 88.12, 90.52 and 90.83. The two higher settles recovered 2.71 of the 16.00 points lost from 10/30 through Wednesday. Over five sessions the contract is down 13.29, which the provider publishes as a 12.76 percent five-day change.
Ranges narrowed again. Ten sessions of daily ranges from 10/26 read 2.80, 3.38, 3.80, 3.21, 2.56, 7.60, 5.23, 10.02, 4.67 and 3.46. Friday's 3.46 was the narrowest since the 2.56 of 10/30. No 30-minute bar moved more than 98 cents from open to close.
The swing highs stepped down until Friday. The 104.99 high of 10/30 gave way to 102.75 on Monday, 98.82 on Tuesday, 97.15 on Wednesday and 91.32 on Thursday. Friday's 92.53 is the first higher high of the week. The provider publishes 104.99 as the 52-week, 13-week and one-month high. It lists Thursday's 86.65 as the one-month low and 72.90 as the 13-week low. The settle sits 1.89 above the 88.94 midpoint of the 13-week range and 4.70 above the 86.13 retracement from the 52-week low. The grid puts the 38.2 percent retracement from the 13-week high at 92.73. The 38.2 percent retracement from the four-week low sits at 93.66 and the 50 percent retracement of the four-week range at 95.82.
Resistance starts 26 cents up, at the 91.09 stall of the 14-day %K. The 91.18 cash-hours high and the 91.20 open sit just above it, then the 91.41 high of the 8:30 AM ET bar. The review's list leaves out the open and the 91.41 print. The 92.15 projection, the 50-day average at 92.23 and the 5-day at 92.40 lead into the 92.53 high and Pivot R1 at 92.55. The 92.60 stall and the 92.73 retracement sit just above. The 93.66 retracement, the 93.70 crossing price and the 93.90 stall form the next band. Pivot R2 at 94.27 sits beyond.
Support starts 2 cents down, at the Pivot Point at 90.81. Thursday's 90.52 settle, the 90.34 post-settlement close and the 90.32 projection follow. The 89.55 cash-hours low comes next. Pivot S1 at 89.09, Friday's 89.07 low, the 89.04 target price and the 88.94 midpoint form the next band. Pivot S2 at 87.35 and one standard deviation support at 87.14 follow. Thursday's 86.65 low, the 86.40 bottom of one average true range and the 86.13 retracement are the deeper references. The review's list leaves out 90.52, 90.34, 89.55 and 86.40.
The settle sits beneath four averages. It is 1.57 beneath the 5-day at 92.40, 5.93 beneath the 9-day at 96.76 and 6.38 beneath the 20-day at 97.21. It is 1.40 beneath the 50-day at 92.23, the third settle in a row beneath it. It sits 7.12 above the 100-day at 83.71 and 12.37 above the 200-day at 78.46. The 5-day fell 2.66 from Thursday's 95.06. The 104.12 settle of 10/30 left its window.
The stack beneath stays in order. The 30 older settlements in the 50-day window averaged 88.90. The 50 older ones in the 100-day window averaged 75.20, and the 100 older ones in the 200-day window 73.20. The grid gives 93.70 as the price that would cross the 40-day average on Monday. It gives 92.60 as the price at which that crossing stalls, and 93.90 for the 18-day average.
Momentum stayed soft. Relative strength reads 38.10 on the 9-day, 43.19 on the 14-day and 46.83 on the 20-day. The 9-day, 14-day and 20-day raw stochastics all read 22.79 percent. The 14-day %K at 16.48 percent sits 2.57 beneath %D at 19.05 percent. Negative direction leads on both directional systems. On the 9-day it reads 27.68 against 13.91, with the ADX at 47.38. On the 14-day it reads 23.36 against 16.46, with the ADX at 38.23. Historic volatility reads 62.38 percent and 56.04 percent.
The composite read for the Friday session is 24 percent sell, unchanged from a session earlier. It read 100 percent buy a week ago and 72 percent buy a month ago. Its signal strength is described as minimum and its direction as weakest. The short horizon group averages 60 percent sell, the medium 25 percent sell and the long 67 percent buy. The trend composite reads sell. These are the provider's published readings, read at 6:20 PM ET on Friday with Globex closed.
Average ranges stay wide. The 14-day average true range stands at 4.43 points, about 4.9 percent of the settle. The 14-day average daily range stands at 4.61. The 9-day figures are 4.75 and 4.88 and the 20-day 4.16 and 4.27. One average true range either side of the settle spans 86.40 to 95.26. The deviation bands, built from five settlements and centred on the settle, run 87.14 to 94.52, 85.61 to 96.05 and 84.44 to 97.22. They describe dispersion only.
Products split, the dollar rose 0.74 percent, and one report came after the settle
Friday brought no weekly inventory figures. The weekly rig survey item in the macro feed at 2:00 PM ET put the US oil rig count at 463 from 462; that is a feed item. The Short-Term Energy Outlook is scheduled for 12:00 PM ET on Tuesday, November 10, as the calendar lists it. The next weekly government report is scheduled for 12:00 PM ET on Thursday, November 12, delayed by the Veterans Day holiday, as the calendar lists it. The producer group's monthly report is listed for Wednesday, November 11, 2026 at 8:00 AM ET by the news-feed calendar, unconfirmed.
Products split. Brent's January contract settled at 98.32, up 0.03 dollars, per the news feed and the settlement record. December heating oil settled at 4.3317 dollars a gallon, down 0.46 percent. December gasoline settled at 2.7767, up 0.48 percent, against crude's 0.34 percent. The heating oil margin over December WTI narrowed to 91.10 dollars a barrel from 92.26. The gasoline margin widened to 25.79 from 25.54. Natural gas's December contract settled at 2.9980, per the news feed.
The dollar firmed. Its daily record closed at 102.30, up 0.74 percent, and the ten-year yield index closed at 4.86 percent, up three basis points, after the employment report. Gold's December contract fell 0.94 percent and silver's 0.83 percent. The S&P 500 cash index rose 0.31 percent, the Nasdaq-100 1.35 percent and the semiconductor index 4.21 percent. The volatility index closed at 25.64, down 9.01 percent. Crude edged higher while the dollar firmed; these moves coincided, and no series in the review separates their effects.
One report came after the settle. At 2:40 PM ET the news feed carried a report that oil traders were in talks with the US about using sanctioned vessels to ease freight costs. That is a report carried by the feed, not an event confirmed for this review. A tentative diplomatic meeting on Russia and Ukraine is listed for Tuesday, November 10, per the news-feed calendar, unconfirmed.
Friday's US data came early. The employment situation report was released at 8:30 AM ET, as the calendar lists it. Payrolls came in at 165 thousand against a forecast of 70 thousand, per the news-feed calendar. The unemployment rate came in at 4.1 percent against a forecast of 4.2 percent, per the news-feed calendar. Remarks by a Federal Reserve Board official were scheduled for 12:15 PM ET, as the calendar lists them. Consumer credit, scheduled for 3:00 PM ET, rose 27.84 billion dollars against a forecast of 13.8 billion, per the news-feed calendar.
Volume fell again. December volume was 253,859 contracts on Friday against 335,754 on Thursday. Thursday's open interest, in the revised 11/05 row, stood at 212,960, against 222,982 on Wednesday. Friday's open interest has not yet been reported. December's premium over January narrowed to 1.24 from 1.32. Brent's January premium over January WTI narrowed to 8.73 from 9.09. No dealer-positioning dataset was read for crude.
The weekly positioning report for the week to Tuesday, November 3, 2026 was released after the close. The macro feed's item put non-commercial net positions in crude at 80.3 thousand from 74.3 thousand. The provider's overview listed managed money at 147,382 long, down 10,051, against 125,654 short, down 651. These are figures as published by the two sources and were not recomputed.
The trade map for Monday
The review's setup for Monday is a short on the December contract from 92.10 to 92.40, as published at the settle. The contract settled beneath the 50-day average for a third session. The composite reads 24 percent sell, with its direction described as weakest. Negative direction leads on both directional systems. Friday's rebound stopped at 92.53, beside Pivot R1 at 92.55. In the review's reading, a test of the band, around the 50-day average at 92.23 and beneath Pivot R1, offers a short with a defined risk point above Friday's high and Pivot R1. The review notes that two higher settles and weekend headline risk can carry price through the band. It calls the setup an analyst judgment that tests of the 50-day average are sold, not a measured edge.
Now the arithmetic. From the 92.25 midpoint the risk to the stop is 0.65, 14.7 percent of the 14-day average true range of 4.43. The targets sit 0.65, 1.30 and 1.95 beneath the midpoint. That is exactly 1, 2 and 3 times the risk. The band's bottom sits 1.27 over the settle and its top 1.57 over it. Its top sits 13 cents beneath the 92.53 high and 15 cents beneath Pivot R1. Target 1 sits 77 cents above the settle and 42 cents above the 91.18 high. Target 2 sits 12 cents above the settle and 14 cents above the Pivot Point. Target 3 sits 53 cents beneath the settle. The stop sits 35 cents above Pivot R1.
Scenario ranges in the review are analyst judgment. The low-range case runs 89.80 to 92.20, the most likely 89.10 to 92.90 and the high-range case 87.90 to 94.30. The most likely case tops out at the 92.90 stop. For the night session from 6:00 PM ET on Sunday the review's bias is neutral beneath the 50-day average. Its expected band runs roughly 89.60 to 92.30, its top inside the setup band. Gap references run both ways. Above sit the 50-day at 92.23, Friday's 92.53 high and Pivot R1 at 92.55. Beneath sit the Pivot Point at 90.81, Pivot S1 at 89.09 and Friday's 89.07 low.
London starts at 3:00 AM ET and runs roughly 89.40 to 92.20, with a neutral bias between Pivot S1 at 89.09 and Pivot R1 at 92.55. A European investor confidence survey at 4:30 AM ET is listed by the news-feed calendar, unconfirmed. The morning band runs roughly 89.30 to 92.50. The setup band sits in its upper end, its top 10 cents beneath the band's 92.50 top.
The calendar lists wholesale trade data at 10:00 AM ET on Monday, November 9. The review sees little direct bearing on crude. Remarks by Federal Reserve officials at 8:40 AM ET and 10:00 AM ET are listed by the news-feed calendar, unconfirmed. So are a consumer inflation-expectations survey at 11:00 AM ET and a three-year note auction at 1:00 PM ET. The afternoon runs roughly 89.30 to 92.40, its top level with the setup band's top. The 2:30 PM ET settlement fixes the reference ahead of Tuesday's inflation data.
Globex reopens at 6:00 PM ET on Sunday, after two days of weekend headline risk. Chinese inflation data at 8:30 PM ET on Sunday is listed by the news-feed calendar, unconfirmed. In the review's judgment the first-order event for crude on Monday is the Sunday reopen, which prices the weekend's headlines together. Tuesday's inflation data is the first scheduled test of the dollar. The calendar lists the consumer price index at 8:30 AM ET and the Short-Term Energy Outlook at 12:00 PM ET on Tuesday, November 10.
The review also weighs the path. In the review's analyst judgment, the most probable path holds the contract between Pivot S1 at 89.09 and Pivot R1 at 92.55. A test of the 92.23 to 92.55 band that stalls beneath Pivot R1 is weighted above a settle through it. The composite reads 24 percent sell. Negative direction leads on both systems, and the settle sits beneath the 5-day, 9-day, 20-day and 50-day averages. Two higher settles and a higher low describe a rebound attempt. In the review's interpretation, that favours selling a test of the 50-day average over a renewed decline from the reopen. The alternative that would invalidate this reading is a settle above the 93.66 retracement. That could bring the 93.90 stall and Pivot R2 at 94.27 into play. On the other side, weekend headlines could open the contract beneath Pivot S1 at 89.09. That could bring Friday's 89.07 low and Pivot S2 at 87.35 into play without the rebound the setup needs.
The settle sits 1.27 beneath the band. The setup needs that gap closed first.
The complete data picture
Every number behind Monday’s plan, charted first, then the full level lists, then the complete numeric reference underneath. Every price is the December contract unless January is named.
Full numeric reference, every remaining figure from the session review
1. Executive Summary
The December crude contract settled at 90.83 on Friday, up 0.31 or 0.34 percent from Thursday's settle of 90.52, after trading between 92.53 and 89.07, a 3.46 point daily range. The settle finished at 50.9 percent of the range, and the range was 0.75 multiples of the 14-day average daily range of 4.61 points. Friday printed a higher high, 1.21 above Thursday's 91.32, and a higher low, 2.42 above Thursday's 86.65, and settled higher for a second session. The 3.46 point range is the narrowest since the 2.56 point range of 10/30/26. Over the week the contract fell 13.29 from the 104.12 settle of 10/30/26, a decline of 12.76 percent.
The high came on Thursday evening and the low during the London session. The contract reached 92.53 in the 10:30 PM ET bar on Thursday, fell to 89.07 in the 4:30 AM ET bar on Friday, and held between 89.55 and 91.18 through the cash hours. The provider's commentary said crude found support and that gains were limited by signs of progress in diplomacy on Iran; this is attributed commentary and unconfirmed. The series does not establish that any single report caused a particular move.
Brent's January contract settled at 98.32, up 0.03 dollars, per the news feed and the settlement record, while heating oil's December contract eased 0.46 percent and gasoline's December contract rose 0.48 percent. The dollar index rose 0.74 percent to 102.30 after the employment report showed payrolls of 165 thousand against a forecast of 70 thousand, per the news-feed calendar. At 2:40 PM ET the news feed carried a report that oil traders were in talks with the US about using sanctioned vessels to ease freight costs; this is a report carried by the feed, not an event confirmed for this review.
The composite multi-indicator read published for the Friday session is "24% SELL" with strength "Minimum" and direction "Weakest", unchanged in percentage from "24% SELL" a session earlier. The settle sits beneath the 5-day, 9-day, 20-day and 50-day settlement averages and above the 100-day and 200-day. The Primary Setup in section 8 is a short from the 92.10 to 92.40 band, around the 50-day average at 92.23 and beneath Pivot R1 at 92.55, stopped at 92.90, with objectives at 91.60, 90.95 and an extended 90.30. Two days of weekend headline risk separate Friday's settle from the Sunday reopen at 6:00 PM ET.
2. Price Action & Technical Structure
2.1 Intraday and Session Review
The Friday session opened at 91.20 at the Thursday 6:00 PM ET reopen, 0.68 above Thursday's settle, and the 30-minute series on the continuous symbol places the high of 92.53 in the 10:30 PM ET bar on Thursday and the low of 89.07 in the 4:30 AM ET bar on Friday. Between the 6:00 PM ET reopen and 3:00 AM ET the bars held between 90.89 and 92.53 and closed that window at 91.00. The 3:00 AM ET bar fell 0.66 to 90.34 and the 4:00 AM ET bar fell 0.79, from 90.01 to 89.22, the largest decline of any 30-minute bar in the session; the 5:00 AM ET bar rose 0.98, from 89.22 to 90.20, the largest gain of any 30-minute bar.
From 3:00 AM ET to the 9:30 AM ET cash open the contract traded between 89.07 and 91.41, with the 9:00 AM ET bar closing that window at 90.71. The 8:30 AM ET bar, which carried the employment report, traded between 90.71 and 91.41 and closed at 90.79. Across the cash hours, from 9:30 AM ET to 4:00 PM ET, the bars held between 89.55 and 91.18; the 1:00 PM ET bar made the 89.55 low of that window, the 1:30 PM ET bar rose 0.55 to 90.51 and the 2:00 PM ET bar rose to 90.88. The settle was fixed at 2:30 PM ET at 90.83, and the 4:30 PM ET bar closed at 90.34, 0.49 beneath the settle.
On a Friday evening Globex stays closed until the Sunday reopen, so the provider's overview page for Friday carries the completed Friday session itself, with an open of 91.20, a high of 92.53 and a low of 89.07. The completed range is still checked against the published pivot ladder. Pivot R3 at 96.01 minus Pivot S3 at 85.63, divided by three, returns 3.46, and Pivot R2 at 94.27 minus Pivot S2 at 87.35, divided by two, returns the same 3.46. Three times the Pivot Point of 90.81 less the 90.83 settle gives a high plus low sum of 181.60, which with the 3.46 range solves to a high of 92.53 and a low of 89.07; that pair reproduces all seven published rungs. These are the completed-session inputs behind the published pivot ladder rather than an independently read bar, and they are corroborated by the provider's settlement row and the chart's completed daily bar, which carry the same 91.20 open, 92.53 high, 89.07 low and 90.83 settle.
2.2 Daily Structure
Friday printed a higher high and a higher low against Thursday and settled 0.31 higher, the second consecutive higher settle after Thursday's 2.40 point gain. Settlements over the last six sessions read 104.12, 96.46, 96.09, 88.12, 90.52 and 90.83, so the two higher settles recovered 2.71 of the 16.00 points lost from Friday 10/30 through Wednesday. Over five sessions the contract is down 13.29 from the 104.12 settle of 10/30, which the provider also publishes as a 12.76 percent five-day change.
The provider publishes 104.99 as the 52-week, 13-week and one-month high, Thursday's 86.65 as the one-month low and 72.90 as the 13-week low. The Friday settle sits 1.89 above the 88.94 midpoint of the 13-week range, published as the 50 percent retracement from the 13-week high and low, and 4.70 above the 86.13 level published as the 61.8 percent retracement from the 52-week low.
2.3 4-Hour and Swing Structure
Daily ranges for the last ten sessions, from 10/26, ran 2.80, 3.38, 3.80, 3.21, 2.56, 7.60, 5.23, 10.02, 4.67 and 3.46, so the ranges have narrowed for two sessions after Wednesday's 10.02 points and Friday's range was the narrowest since 10/30. In the 30-minute series no bar moved more than 0.98 from open to close.
The swing sequence since the 104.99 high of 10/30 shows lower highs at 102.75 on Monday, 98.82 on Tuesday, 97.15 on Wednesday and 91.32 on Thursday, and Friday's 92.53 high is the first higher high of the week. The published grid places the 38.2 percent retracement from the 13-week high at 92.73, the 38.2 percent retracement from the four-week low at 93.66 and the 50 percent retracement of the four-week range at 95.82.
2.4 Moving Averages
The averages cited here were computed for this review from the provider's daily settlement series for the December contract, which holds 260 completed sessions from 10/27/25 through Friday; with Globex closed for the weekend there is no reopened-session row to exclude, and each average is carried at full precision and rounded once to the cent. The 5-day average stands at 92.40, the 9-day at 96.76, the 20-day at 97.21, the 50-day at 92.23, the 100-day at 83.71 and the 200-day at 78.46.
The 90.83 settle sits 1.57 beneath the 5-day average, 5.93 beneath the 9-day, 6.38 beneath the 20-day and 1.40 beneath the 50-day, and 7.12 above the 100-day and 12.37 above the 200-day. It is the third consecutive settle beneath the 50-day average. The 5-day average fell from Thursday's 95.06 as Friday's settle replaced the 10/30 settle of 104.12.
The 20-day average sits above the 50-day because the 30 older settlements in the 50-day window averaged lower, at 88.90. The 50-day sits above the 100-day because the 50 older settlements in the 100-day window averaged lower, at 75.20, and the 100-day sits above the 200-day because the 100 older settlements in the 200-day window averaged lower, at 73.20. The projection grid gives 93.70 as the price at which the 40-day average would be crossed on Monday and 92.60 as the price at which that crossing stalls.
2.5 Oscillator and Trend Readings
The oscillator figures below are as published on the provider's technical page, read at 6:20 PM ET on Friday with Globex closed; they are the provider's readings, not this review's computations. The 9-day relative strength reads 38.10, the 14-day relative strength 43.19 and the 20-day relative strength 46.83.
The 9-day, 14-day and 20-day raw stochastic all read 22.79 percent, while the 14-day stochastic %K reads 16.48 percent and the 14-day stochastic %D 19.05 percent. The 9-day directional index ADX reads 47.38 with the 9-day +DI at 13.91 and the 9-day -DI at 27.68, and the 14-day directional index ADX reads 38.23 with the 14-day +DI at 16.46 and the 14-day -DI at 23.36, so negative direction leads on both systems. The 9-day historic volatility reads 62.38 percent and the 14-day historic volatility 56.04 percent.
The composite multi-indicator read published for the Friday session is "24% SELL", with signal strength "Minimum" and direction "Weakest". The snapshot history reads "24% SELL" for the prior session, "100% BUY" a week ago and "72% BUY" a month ago. The short horizon group averages "60% SELL", the medium group "25% SELL" and the long group "67% BUY", and the trend composite reads "SELL".
2.6 Volatility and Expected Range
The published 14-day average true range stands at 4.43 points and the 14-day average daily range at 4.61 points; the 9-day average true range is 4.75 with a 9-day average daily range of 4.88, and the 20-day average true range is 4.16 with a 20-day average daily range of 4.27. Friday's 3.46 point range was 0.75 multiples of the 14-day average daily range.
Adding and subtracting the 14-day average true range of 4.43 from the 90.83 settle frames Monday between 86.40 and 95.26. The published standard-deviation bands, built from five settlements, span 87.14 to 94.52 at one deviation, 85.61 to 96.05 at two and 84.44 to 97.22 at three. These bands describe dispersion, not intraday reach, and the weekend adds headline risk that a single-session band does not reflect.
3. Key Levels
3.1 Resistance
Above the 90.83 settle, the first references are the 91.18 high of the cash hours, with the 91.09 price at which the 14-day stochastic %K stalls just beneath it. The 92.15 projection for the 30 percent raw stochastic, the 50-day average at 92.23 and the 5-day average at 92.40 lead into Friday's 92.53 high and Pivot R1 at 92.55, with the 92.60 stall of the 40-day crossing and the 92.73 retracement from the 13-week high just above. The 93.66 retracement from the four-week low, the 93.70 price that would cross the 40-day average and the 93.90 stall of the 18-day average form the next band, with Pivot R2 at 94.27 beyond.
3.2 Support
Beneath the settle sits the Pivot Point at 90.81, with the 90.32 projection for the 20 percent raw stochastic beneath it. Pivot S1 at 89.09, Friday's 89.07 low, the 89.04 published target price and the 88.94 midpoint of the 13-week range form the next band. Pivot S2 at 87.35 and one standard deviation support at 87.14 follow, with Thursday's 86.65 low, now the one-month low, and the 86.13 retracement from the 52-week low as the deeper references.
4. Macro Drivers
4.1 OPEC and Supply Policy (Quotas, Compliance)
The feeds for Friday contain commentary, with no producer-group decisions. The producer group's monthly report is listed for Wednesday, November 11, 2026 at 8:00 AM ET by the news-feed calendar, unconfirmed.
4.2 EIA and API Inventory (Crude Stocks, Gasoline, Distillates, Cushing, SPR)
The calendars carry no weekly inventory release for Friday. The weekly rig survey item in the macro feed at 2:00 PM ET put the US oil rig count at 463 from 462, which is a feed item. The Short-Term Energy Outlook is scheduled for 12:00 PM ET on Tuesday, November 10, 2026, as the calendar lists it, and the next weekly government report for 12:00 PM ET on Thursday, November 12, 2026, delayed by the Veterans Day holiday, as the calendar lists it.
4.3 Diplomacy and Supply Reports
The news feed carried at 2:40 PM ET a report that oil traders were in talks with the US about using sanctioned vessels to ease freight costs. The provider's commentary said crude found support and that gains were limited by signs of progress in diplomacy on Iran; this is attributed commentary and unconfirmed. These are a report and commentary carried by the feeds, not events confirmed for this review. A tentative diplomatic meeting on Russia and Ukraine is listed for Tuesday, November 10, 2026, per the news-feed calendar, unconfirmed. The weekend carries two days of headline risk before the Sunday reopen at 6:00 PM ET.
4.4 Demand and Refining (Refinery Utilization, Crack Spreads, Seasonal Pattern)
Heating oil's December contract settled at 4.3317 dollars a gallon, down 0.46 percent, and gasoline's December contract at 2.7767, up 0.48 percent, against crude's 0.34 percent. Measured on the December contracts, the heating oil margin over December WTI narrowed to 91.10 dollars a barrel from 92.26, while the gasoline margin widened to 25.79 from 25.54. Natural gas's December contract settled at 2.9980, per the news feed.
4.5 Dollar and Cross-Asset (DXY, Commodities Complex, Equity Risk-On/Off)
The dollar index's daily record closed at 102.30, up 0.74 percent, and the ten-year yield index closed at 4.86 percent, up three basis points, after the employment report. Gold's December contract fell 0.94 percent and silver's December contract 0.83 percent. The S&P 500 cash index rose 0.31 percent, the Nasdaq-100 1.35 percent and the semiconductor index 4.21 percent, and the volatility index closed at 25.64, down 9.01 percent. Crude edged higher while the dollar firmed; these moves coincided, and no series in this review separates their effects.
4.6 Institutional Positioning (COT, Money Manager vs Commercial Hedger, Speculator Length)
The weekly positioning report for the week to Tuesday, November 3, 2026 was released after the close. The macro feed's item put non-commercial net positions in crude at 80.3 thousand from 74.3 thousand, and the provider's overview listed managed money at 147,382 long, down 10,051, against 125,654 short, down 651; these are figures as published by the two sources and were not recomputed. Friday's December volume was 253,859 contracts against 335,754 on Thursday, per the settlement record. December's premium over January narrowed to 1.24 from 1.32, and Brent's January premium over January WTI narrowed to 8.73 from 9.09.
5. No Liquid Options Proxy
This review covers crude without a positioning dataset. There is no dealer-positioning surface read for this instrument in this review, no gamma map, no options concentration levels and no flow attribution, and none is inferred from any other instrument. Every level in section 3 originates in published pivot arithmetic, published standard-deviation bands, published retracement and moving-average projections, settlement averages computed from the provider's daily record, or the completed-session extremes described in section 2.1.
This is a statement about coverage, not about the existence of listed crude options. No such dataset was read for this review, so no claim resting on one appears anywhere in this review or in this outlook. The positioning inputs used for crude are the Brent spread, the front calendar spread, the product margins, the volume record and the weekly positioning figures in section 4.6.
6. Forecast
6.1 Night Session (6:00 PM ET Sunday to 3:00 AM ET Monday, Globex/Asia)
Globex halted at 5:00 PM ET on Friday and reopens at 6:00 PM ET on Sunday, November 8, 2026, so two days of weekend headline risk separate Friday's settle from the reopen. Gap references run both ways: above, the 50-day average at 92.23, Friday's 92.53 high and Pivot R1 at 92.55; beneath, the Pivot Point at 90.81, Pivot S1 at 89.09 and Friday's 89.07 low. Chinese inflation data at 8:30 PM ET on Sunday is listed by the news-feed calendar, unconfirmed. Bias neutral beneath the 50-day average, expected band roughly 89.60 to 92.30.
6.2 London Session (3:00 AM ET to 8:00 AM ET Monday)
A European investor confidence survey at 4:30 AM ET on Monday is listed by the news-feed calendar, unconfirmed. Bias neutral between Pivot S1 at 89.09 and Pivot R1 at 92.55, expected band roughly 89.40 to 92.20.
6.3 Morning Session (9:00 AM ET to 12:00 PM ET Monday, US Open / Pit Session)
Wholesale trade data is scheduled for 10:00 AM ET on Monday, November 9, 2026, as the calendar lists it, with little direct bearing on crude. Remarks by Federal Reserve officials at 8:40 AM ET and 10:00 AM ET on Monday are listed by the news-feed calendar, unconfirmed. Expected band roughly 89.30 to 92.50; the 92.10 to 92.40 setup band sits in its upper end, its top 0.10 beneath the 92.50 band top.
6.4 Afternoon Session (12:00 PM ET to 2:30 PM ET Monday, NYMEX Pit Close)
A three-year note auction at 1:00 PM ET on Monday is listed by the news-feed calendar, unconfirmed, and the settlement at 2:30 PM ET fixes the reference ahead of Tuesday's inflation data. Expected band roughly 89.30 to 92.40.
6.5 Night Session Forward (6:00 PM ET Monday)
The Monday evening session carries into the consumer price index scheduled for 8:30 AM ET on Tuesday, November 10, 2026 and the Short-Term Energy Outlook scheduled for 12:00 PM ET that day, both as the calendar lists it.
6.6 Expected Range (Monday Full Session)
Low-range scenario: 89.80 to 92.20
Mid-range scenario (most likely): 89.10 to 92.90
High-range scenario: 87.90 to 94.30
6.7 Most Likely Path
In this review's analyst judgment, the most probable path holds the contract between Pivot S1 at 89.09 and Pivot R1 at 92.55, with a test of the 92.23 to 92.55 band that stalls beneath Pivot R1 at 92.55 weighted above a settle through it. The composite reads "24% SELL" with direction "Weakest", negative direction leads on both directional systems and the settle sits beneath the 5-day, 9-day, 20-day and 50-day averages, while two higher settles and a higher low describe a rebound attempt, which in this review's interpretation favours selling a test of the 50-day average rather than a renewed decline from the reopen.
The alternative that would invalidate this reading is a settle above the 93.66 retracement from the four-week low, which would bring the 93.90 stall of the 18-day average and Pivot R2 at 94.27 into play. On the other side, weekend headlines could open the contract beneath Pivot S1 at 89.09, which could bring Friday's 89.07 low and Pivot S2 at 87.35 into play without the rebound the setup needs.
7. Monday Economic Calendar
Friday's releases are complete. The employment situation report was released at 8:30 AM ET on Friday, November 6, 2026, as the calendar lists it, with payrolls of 165 thousand against a forecast of 70 thousand and an unemployment rate of 4.1 percent against a forecast of 4.2 percent, per the news-feed calendar. Remarks by a Federal Reserve Board official were scheduled for 12:15 PM ET and consumer credit for 3:00 PM ET on Friday, November 6, 2026, as the calendar lists it, and consumer credit rose 27.84 billion dollars against a forecast of 13.8 billion, per the news-feed calendar. December WTI settled at 2:30 PM ET, per the news feed's settlement item.
Over the weekend, Chinese inflation data at 8:30 PM ET on Sunday, November 8, 2026 is listed by the news-feed calendar, unconfirmed. On Monday, November 9, 2026, wholesale trade data is scheduled for 10:00 AM ET, as the calendar lists it; remarks by Federal Reserve officials, a consumer inflation-expectations survey at 11:00 AM ET and a three-year note auction at 1:00 PM ET are listed by the news-feed calendar, unconfirmed.
Later in the week, the consumer price index is scheduled for 8:30 AM ET and the Short-Term Energy Outlook for 12:00 PM ET on Tuesday, November 10, 2026, the delayed weekly petroleum report for 12:00 PM ET on Thursday, November 12, 2026 and the producer price index for 8:30 AM ET on Friday, November 13, 2026, all as the calendar lists it. In this review's judgment the first-order event for crude on Monday is the Sunday reopen at 6:00 PM ET, which prices the weekend's headlines together, with Tuesday's inflation data the first scheduled test of the dollar.
8. Primary Trade Setup
Direction: Short
Rationale: The contract settled beneath the 50-day average for a third session, the composite reads "24% SELL" with direction "Weakest" and negative direction leads on both directional systems, while Friday's rebound stopped at 92.53, beside Pivot R1 at 92.55. A test of the 92.10 to 92.40 band, around the 50-day average at 92.23 and beneath Pivot R1 at 92.55, offers a short with a defined risk point above Friday's high and Pivot R1. Two higher settles and weekend headline risk can carry price through the band, so the setup is an analyst judgment that tests of the 50-day average are sold, not a measured edge.
Entry Zone: 92.10 to 92.40
Stop Loss: 92.90 (above Pivot R1 at 92.55 and Friday's 92.53 high, beneath the 93.66 retracement)
Target 1 (T1): 91.60 (above the 91.18 cash-hours high)
Target 2 (T2): 90.95 (above the Pivot Point at 90.81 and the 90.83 settle)
Target 3 (T3, extended): 90.30 (beneath the 90.32 raw stochastic projection)
Risk-to-Reward: Approximately 1:1 to T1, 1:2 to T2, 1:3 to T3
Invalidation: A settle above the 93.66 retracement from the four-week low negates the thesis. Short of that, the edge is removed by acceptance above the entry band, defined as two consecutive 30-minute closes above 92.40; a touch alone does not remove it.
Macro override: Weekend headline risk could lift the contract or weigh on it. If it lifts the contract, a move through the 92.90 stop invalidates the short before the targets, and the 93.66 retracement becomes the reference, 0.76 beyond the stop and well inside one 14-day average true range of 4.43.
Sources and methodology
This outlook is built from our session review of the December WTI crude contract (CLZ26), prepared after Friday's close on November 6, 2026 for the Monday, November 9, 2026 session, which opens at the Sunday 6:00 PM ET Globex reopen. December is the contract the chart's continuous symbol tracks. Friday's completed extremes are the inputs behind the published pivot ladder: Pivot R3 at 96.01 less Pivot S3 at 85.63, divided by three, and Pivot R2 at 94.27 less Pivot S2 at 87.35, divided by two, both return 3.46. Three times the 90.81 Pivot Point less the 90.83 settle gives 181.60, which solves to the 92.53 high and the 89.07 low. The provider's settlement row and the chart's completed Friday bar carry the same 91.20 open, extremes and settle.
Friday's card was written on the December contract and published at Thursday's settle. It is graded across Friday's whole session, on the 30-minute bars of the continuous symbol: 46 bars from the Thursday 6:00 PM ET reopen to the 4:30 PM ET bar, labelled in Eastern standard time. The provider's December settlement row for 11/06 reads open 91.20, high 92.53, low 89.07, settle 90.83, volume 253,859. No price move is tied to a headline by this outlook.
The moving averages were computed from the provider's daily settlement series for December, 260 completed sessions from 10/27/25 through Friday; with Globex closed for the weekend there is no reopened-session row. The oscillators and range averages are cited as published, read at 6:20 PM ET on Friday. Thursday's 11/05 row has been revised: December volume now reads 335,754 against the 308,350 cited in Friday's outlook, and open interest, not reported then, reads 212,960. Friday's open interest had not yet been reported. The review places the low before the European open; the 4:30 AM ET bar that holds it falls inside the London session, from 3:00 AM ET, so this outlook says the low came during the London session.
No dealer-positioning dataset was read for crude; the positioning inputs are the Brent spread, the front calendar spread, the product margins, the volume record and the weekly positioning figures. Scenario ranges are analyst judgment, and items marked unconfirmed come from the news feed or its calendar. Clock times are Eastern standard time, as the review and the calendar state them.
Friday’s outlook for this contract is here, and the gold contract’s Friday outlook covers the metal whose December contract settled at 4,074.9 on Friday, down 0.94 percent. Outlooks for ES, NQ, GC and CL are collected on the market outlook page, and our forward trading record is on the performance statement.
Tuesday’s follow-up outlook for crude oil, written after Monday’s close, is here.