Monday’s gold card was a long from 4,115 to 4,125 with a stop at 4,095. Tuesday filled the band and then took the stop. The 9:30 PM ET bar on Monday evening traded down to 4,119.3, inside the band. The best print in the bars after it was 4,136.4, in the 12:30 AM ET bar, 8.6 short of the 4,145 first target.
The 4:00 AM ET bar fell to 4,096.0, a point above the stop. The next bar, at 4:30 AM ET, went through it to 4,089.1. Measured on the card’s own levels, that is a loss of 20 to 30 points depending on where in the band a position was opened. We called the direction wrong.
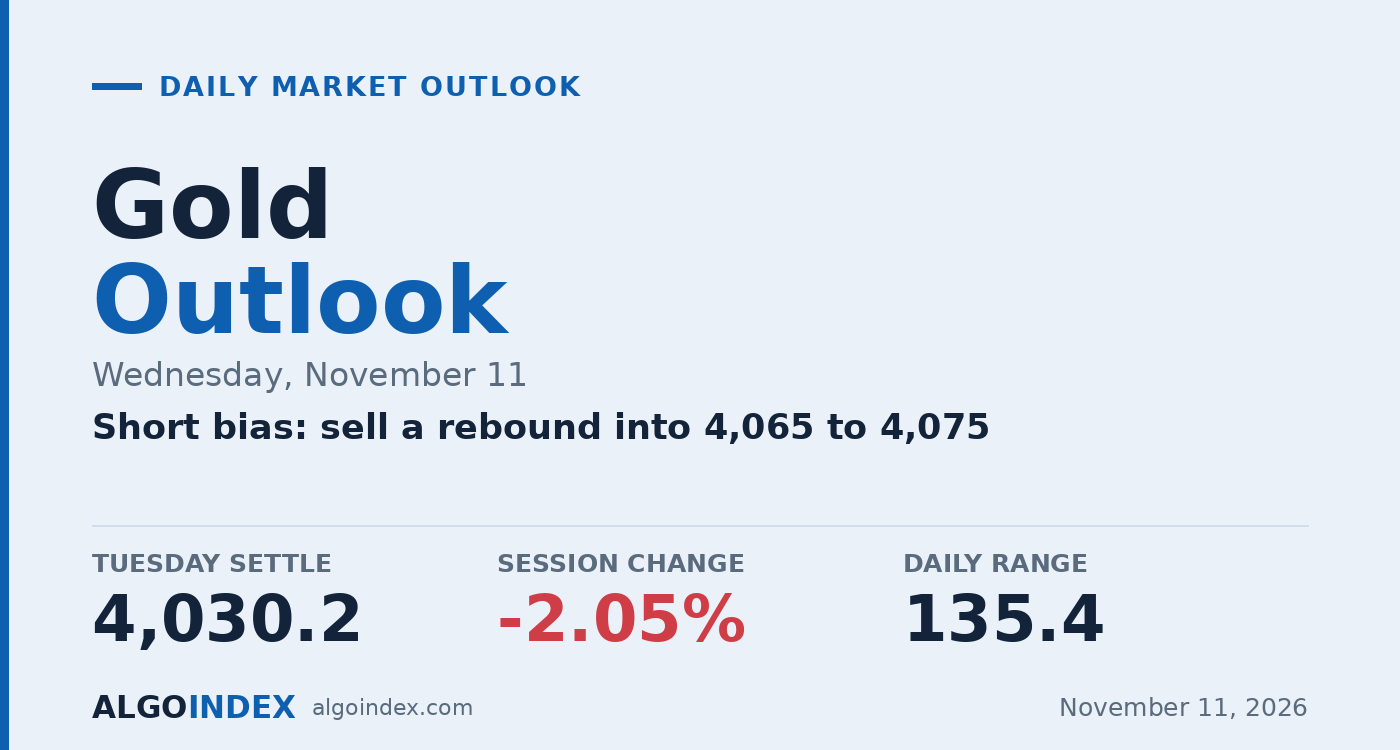
The selling never really stopped. December gold settled at 4,030.2, down 84.3 or 2.05 percent, its largest one-day percentage decline since the 3.29 percent drop of 10/30/26. The 135.4 point range from 4,020.8 to 4,156.2 was the widest since 11/04/26, 1.43 multiples of the 14-day average daily range, and the settle finished at 6.9 percent of it.
- Settle 4,030.2: above the 9-day average at 4,027.4, beneath the 5-day, 20-day, 50-day, 100-day and 200-day; lowest settle since 11/03/26.
- Monday’s long: band traded in the 9:30 PM ET bar, stop hit in the 4:30 AM ET bar, no target reached.
- Wednesday’s setup: short 4,065 to 4,075, stop 4,095, targets 4,045, 4,020 and an extended 3,995.
- Thesis negated on a settle above Pivot R1 at 4,117.3; acceptance above the band means two consecutive 30-minute closes above 4,075.
- Wednesday is Veterans Day: CME Globex keeps normal hours and normal settlement times, and banks are closed.
How Tuesday traded: a third failure near 4,157, then a slide
The high came first. Gold reopened at 4,149.0 at 6:00 PM ET on Monday and printed 4,156.2 in that opening bar. That is the third time in five sessions the contract has stalled within 2.0 points of 4,157, after 4,155.8 on Thursday and 4,157.7 on Monday. The overnight window held between 4,117.2 and 4,156.2 and closed at 4,120.8.
Europe did the first damage. The 4:00 AM ET bar fell 23.3, from 4,121.9 to 4,098.6, the largest decline of any bar, as a Fed Governor said a half-point hike may be needed in December if October core inflation came in around 0.3 percent. Between 4:30 AM ET and 8:00 AM ET the bars held between 4,075.6 and 4,099.1.
Then the data. Core inflation printed 0.3 percent at 8:30 AM ET, and that bar spanned 44.1 points, from 4,090.5 down to 4,046.4, closing 20.3 lower at 4,060.1. The cash open managed only 4,065.8 before rolling over. The 11:00 AM ET bar dropped 18.9 to 4,031.3 and the 11:30 AM ET bar printed the 4,020.8 low.
The afternoon went flat. From 12:00 PM ET the bars held between 4,022.4 and 4,044.4, and the 4:30 PM ET bar closed at 4,040.5, 10.3 above the settle. Globex reopened at 4,043.7.
The dollar and yields carried the day
The dollar index closed at 102.23, up 0.57 percent from 101.65, after trading between 101.49 and 102.41. The ten-year yield index rose 12 basis points to 4.98 percent after a 5.02 percent high. The two moves coincided with gold’s slide; the price series alone cannot separate their effects.
Fed speakers kept pressing. A news-feed headline at 11:15 AM ET said a Fed official sees two more hikes, an item unconfirmed against the verified calendar. From 3:31 PM ET the Fed Vice Chair for Supervision said the data suggest inflation pressures may persist, and at 4:28 PM ET that inflation not being on a downward trend should give pause.
Silver fell harder. Its December contract dropped 2.79 percent to 51.225, lifting the gold-silver ratio to 78.68 from 78.08. The gold fund tracked on the positioning console closed at 369.58, down 2.62 percent, and finished 0.42 beneath its 370 hedging-pressure reference and 19.58 above its 350 put side support base. That is a read on the fund’s own options, never a futures level.
The composite multi-indicator read is “40% SELL”, strength “Weak”, direction “Strengthening”, up from “16% SELL” a session earlier but well short of the “88% SELL” of a week ago. Negative direction leads both systems, narrowly on the 9-day at 22.71 against 21.54 and more clearly on the 14-day at 23.57 against 19.45.
The trade map for Wednesday
The setup sells a rebound into 4,065 to 4,075. Three references meet there: the Pivot Point at 4,069.1, the 20-day average at 4,069.6 and the 4,075.1 MACD projection stall, with the 4,065.8 cash-hours high and the 4,065.1 one-deviation band at its lower edge. The stop at 4,095 clears the 4,090.6 three-deviation band and stays beneath the 4,103.6 retracement.
The first target, 4,045, sits beneath the 4,046.4 low of the 8:30 AM ET bar. The second, 4,020, sits beneath Tuesday’s 4,020.8 low. The extended 3,995 sits at one standard deviation support of 3,995.3. Reward runs roughly 1:1, 1:2 and 1:3.
A settle above Pivot R1 at 4,117.3 negates the thesis and would put the 4,156 to 4,158 shelf of recent highs back in play. Before that, two consecutive 30-minute closes above 4,075 remove the edge. A reversal lower in yields or the dollar, or a geopolitical headline, could lift gold through the stop first.
Our base case holds gold between 3,995.3 and the 4,069.1 Pivot Point. The mid-range scenario runs 3,980 to 4,080, the low-range one 4,005 to 4,065 and the high-range one 3,940 to 4,117. The composite’s “Strengthening” direction and the 10.3 point recovery after the settle argue against stretching the downside objectives. The setup is an analyst judgment, not a measured edge.
The complete data picture
Every figure behind Wednesday’s plan, charted first; the full numeric reference follows underneath.
| December silver | 51.225 | down 2.79% |
| Gold-silver ratio | 78.68 | from 78.08 |
| Dollar index | 102.23 | up 0.57%, range 101.49 to 102.41 |
| Ten-year yield index | 4.98% | up 12 basis points, high 5.02% |
| December crude | 86.04 | down 0.93% |
| S&P 500 cash index | down 0.38% | |
| Volatility index | 19.46 | down 2.31% |
| February gold | 4,063.5 | premium 33.3 from 33.9 |
| Thu, Nov 12, 8:30 AM ET | Weekly jobless claims | listed by the news-feed calendar, unconfirmed |
| Thu, Nov 12, 12:00 PM ET | Weekly government petroleum report | moved for the holiday |
| Fri, Nov 13, 8:30 AM ET | Producer price index | scheduled |
| Wed, Dec 9, 2:00 PM ET | Fed rate statement | listed by the news-feed calendar, unconfirmed |
Full numeric reference, every figure from the review
Executive Summary
The December gold contract settled at 4,030.2 on Tuesday, down 84.3 or 2.05 percent from Monday's settle of 4,114.5, after trading between 4,156.2 and 4,020.8, a 135.4 point daily range. The settle finished at 6.9 percent of the range, and the range was 1.43 multiples of the 14-day average daily range of 94.8 points. Tuesday printed a lower high, 1.5 beneath Monday's 4,157.7, and a lower low, 41.7 beneath Monday's 4,062.5.
The settle is the lowest since 11/03/26, when the contract settled at 3,940.4, and the 2.05 percent decline is the largest one-day percentage decline since the 3.29 percent decline of 10/30/26. The 135.4 point range is the widest since the 153.0 point range of 11/04/26. Over five sessions the contract is still up 89.8 from the 3,940.4 settle of 11/03/26, a gain of 2.28 percent.
The high came at the Monday evening reopen and the decline ran through the European morning and the US morning. The contract made the 4,156.2 high in the 6:00 PM ET bar on Monday, fell 23.3 in the 4:00 AM ET bar, which contained remarks from a Fed Governor that a half-point hike may be needed in December if October core inflation came in around 0.3 percent, and fell 20.3 in the 8:30 AM ET bar as the October consumer price index printed hotter than forecast. The 4,020.8 low printed in the 11:30 AM ET bar. The declines and those items coincided; the series does not separate the effect of the data from the dollar's and yields' response.
The consumer price index rose 0.4 percent in October against a 0.3 percent forecast and the core index 0.3 percent against 0.2 percent, per the news-feed calendar's actual values for the release scheduled on the verified forward calendar. The provider's commentary said the dollar index rallied to a 1.5-week high as Treasury yields jumped on the inflation data and hawkish Fed remarks, which is attributed commentary. The dollar index's daily record closed at 102.23, up 0.57 percent, and the ten-year yield index closed at 4.98 percent after a 5.02 percent high.
Silver's December contract fell 2.79 percent to 51.225, and the gold-silver ratio rose to 78.68 from 78.08. The gold fund tracked on the positioning console closed at 369.58 against a 379.53 previous close, a 2.62 percent decline, which is used qualitatively only.
The composite multi-indicator read published on Tuesday evening is "40% SELL" with strength "Weak" and direction "Strengthening", against "16% SELL" a session earlier. The settle sits above the 9-day settlement average and beneath the 5-day, 20-day, 50-day, 100-day and 200-day. The primary setup is a short from the 4,065 to 4,075 band, around the Pivot Point at 4,069.1 and the 20-day average, stopped at 4,095, with objectives at 4,045, 4,020 and an extended 3,995. Wednesday, November 11, 2026 is the Veterans Day holiday with CME Globex on normal hours, per the verified forward calendar.
Price Action & Technical Structure
Intraday and Session Review
The Tuesday session opened at 4,149.0 at the Monday 6:00 PM ET reopen, 34.5 above Monday's settle, and the 30-minute series places the high of 4,156.2 in the 6:00 PM ET bar on Monday and the low of 4,020.8 in the 11:30 AM ET bar on Tuesday. The 8:00 PM ET bar on Monday rose 16.5 to 4,148.8, the largest gain of any 30-minute bar in the session. Between the 6:00 PM ET reopen and 3:00 AM ET the bars held between 4,117.2 and 4,156.2 and closed that window at 4,120.8, with the 10:30 PM ET bar making the 4,117.2 low of that window.
From 3:00 AM ET to the 9:30 AM ET cash open the contract traded between 4,046.4 and 4,130.2 and closed the window at 4,060.3. The 4:00 AM ET bar fell 23.3, from 4,121.9 to 4,098.6, the largest decline of any 30-minute bar in the session, and the bars from 4:30 AM ET to 8:00 AM ET held between 4,075.6 and 4,099.1. The 8:30 AM ET bar, which contained the release of the consumer price index at 8:30 AM ET on Tuesday, November 10, 2026, per the verified forward calendar, traded between 4,090.5 and 4,046.4, a 44.1 point span, the widest of any bar in the session, and fell 20.3 to 4,060.1.
Across the cash hours, from 9:30 AM ET to 4:00 PM ET, the bars held between 4,020.8 and 4,065.8. The 9:30 AM ET bar reached 4,065.8, the high of the cash hours, and fell to 4,047.0, the 10:00 AM ET bar rose 10.1 to 4,057.1, and the 11:00 AM ET bar fell 18.9 to 4,031.3. The 11:30 AM ET bar made the 4,020.8 low and closed at 4,030.2. From 12:00 PM ET the bars held between 4,022.4 and 4,044.4, and the 4:30 PM ET bar closed at 4,040.5, 10.3 above the settle.
The provider's overview page, read at 6:26 PM ET, carries an open of 4,043.7, a high of 4,043.8 and a low of 4,040.3 that belong to the Globex session that reopened at 6:00 PM ET on Tuesday, not to Tuesday's completed session; its previous close field reads 4,030.2. Tuesday's completed range is instead recovered from the published pivot ladder. Pivot R3 at 4,252.7 minus Pivot S3 at 3,846.5, divided by three, returns 135.4, and Pivot R2 at 4,204.5 minus Pivot S2 at 3,933.7, divided by two, returns the same 135.4.
Three times the Pivot Point at 4,069.1, less the 4,030.2 settle, gives a high plus low sum of 8,177.1, within the rounding of the published Pivot Point at 4,069.1, which with the 135.4 range solves to a high of 4,156.25 and a low of 4,020.85, or 4,156.2 and 4,020.8 against the 8,177.0 sum of the recorded extremes. That pair, with the 4,030.2 settle, reproduces all seven published rungs. These are the completed-session inputs behind the published pivot ladder rather than an independently read bar, and they are corroborated by the provider's settlement row, the chart's completed daily bar and the 30-minute series, which carry the same 4,149.0 open, 4,156.2 high, 4,020.8 low and 4,030.2 settle.
Daily Structure
Tuesday printed a lower high and a lower low against Monday and settled 84.3 lower, ending Monday's one-session rebound. Settlements over the last six sessions read 3,940.4, 4,073.0, 4,113.5, 4,074.9, 4,114.5 and 4,030.2, so Tuesday gave back more than Monday's 39.6 point gain and settled beneath Thursday's 4,113.5, Friday's 4,074.9 and Wednesday's 4,073.0. Over five sessions the contract is up 89.8 from the 3,940.4 settle of 11/03, which the provider also publishes as a 2.28 percent five-day change.
The settle is the lowest since the 3,940.4 settle of 11/03/26, and the 2.05 percent decline is the largest one-day percentage decline since the 3.29 percent decline of 10/30/26. The provider publishes 5,781.8 as the 52-week high, 4,755.0 as the 13-week high and 4,242.3 as the one-month high, and 3,879.3, dated 10/30/26, as the 52-week, 13-week and one-month low.
The settle finished at 6.9 percent of the day's range, 9.4 above the 4,020.8 low and 126.0 beneath the 4,156.2 high. In our reading a close near the low of a range 1.43 times the 14-day average describes selling that persisted into the settlement rather than a single morning move, although the 4:30 PM ET bar closed 10.3 above the settle.
4-Hour and Swing Structure
Daily ranges for the last ten sessions, from 10/28, ran 60.3, 65.4, 158.9, 91.8, 77.6, 153.0, 88.8, 81.1, 95.2 and 135.4, so the range expanded on Tuesday to the widest since the 153.0 point range of 11/04/26. In the 30-minute series no bar moved more than 23.3 from open to close, and the three largest bar declines came at 4:00 AM ET, 8:30 AM ET and 11:00 AM ET.
The swing lows since the 3,879.3 low of 10/30 read 3,889.0, 3,904.1 and 3,928.2 through 11/04, then 4,067.0, 4,035.1 and 4,062.5 through Monday, and 4,020.8 on Tuesday, which is beneath Friday's 4,035.1 low. The highs read 4,155.8 on Thursday, 4,157.7 on Monday and 4,156.2 on Tuesday, so the contract has failed three times within 2.0 points of 4,157 in five sessions. The published grid places the 50 percent retracement from the four-week high and low at 4,060.8, the 38.2 percent retracement from the four-week low at 4,018.0 and the 38.2 percent retracement from the four-week high at 4,103.6.
Moving Averages
The averages cited here were computed for this outlook from the provider's daily settlement series for the December contract, which holds 259 completed sessions from 10/30/25 through Tuesday; the partial row dated Wednesday, opened by the 6:00 PM ET Globex reopen, was excluded before counting, and each average is carried at full precision and rounded once to the tenth. The 5-day average stands at 4,081.2, the 9-day at 4,027.4, the 20-day at 4,069.6, the 50-day at 4,213.1, the 100-day at 4,244.8 and the 200-day at 4,558.3.
The 4,030.2 settle sits 51.0 beneath the 5-day average, 2.8 above the 9-day, 39.4 beneath the 20-day, 182.9 beneath the 50-day, 214.6 beneath the 100-day and 528.1 beneath the 200-day. It is back beneath the 20-day average after one settle above it on Monday, the fifth consecutive settle above the 9-day, and the 35th consecutive settle beneath the 50-day, the last settle above it on 09/22/26. The 5-day average rose from Monday's 4,063.3 as Tuesday's settle replaced the 11/03 settle of 3,940.4, and the 20-day fell from 4,076.9.
The 20-day average sits beneath the 50-day because the 30 older settlements in the 50-day window averaged higher, at 4,308.8. The 50-day sits beneath the 100-day because the 50 older settlements in the 100-day window averaged higher, at 4,276.5, and the 100-day sits beneath the 200-day because the 100 older settlements in the 200-day window averaged higher, at 4,871.8. The 5-day sits above the 20-day because the 15 older settlements in the 20-day window averaged lower, at 4,065.7.
Oscillator and Trend Readings
The oscillator figures below are as published on the provider's technical page, read at 6:26 PM ET on Tuesday after the Globex reopen, so they may include the live price of the reopened session; they are the provider's readings, not our computations. The 9-day relative strength reads 45.40, the 14-day relative strength 44.26 and the 20-day relative strength 43.72.
The 9-day raw stochastic reads 54.20 percent and the 14-day raw stochastic 52.95 percent, while the 14-day stochastic %K reads 67.21 percent and the 14-day stochastic %D 68.27 percent. The 9-day directional index ADX reads 26.91 with the 9-day +DI at 21.54 and the 9-day -DI at 22.71, and the 14-day directional index ADX reads 25.22 with the 14-day +DI at 19.45 and the 14-day -DI at 23.57, so negative direction leads on both systems, narrowly on the 9-day. The 9-day historic volatility reads 30.49 percent and the 14-day historic volatility 27.06 percent.
The composite multi-indicator read published on Tuesday evening, on a page titled for Tuesday, November 10, 2026, is "40% SELL", with signal strength "Weak" and direction "Strengthening". The snapshot history reads "16% SELL" for the prior session, "88% SELL" a week ago and "48% SELL" a month ago. The short horizon group averages "20% SELL", the medium group "25% SELL" and the long group "67% SELL", and the trend composite reads "SELL".
Volatility and Expected Range
The published 14-day average true range stands at 90.7 points and the 14-day average daily range at 94.8 points; the 9-day average true range is 94.3 with a 9-day average daily range of 105.2, and the 20-day average true range is 90.1 with a 20-day average daily range of 84.7. Tuesday's 135.4 point range was 1.43 multiples of the 14-day average daily range.
Adding and subtracting the 14-day average true range of 90.7 from the 4,030.2 settle frames Wednesday between 3,939.5 and 4,120.9. The published standard-deviation bands, built from five settlements, span 3,995.3 to 4,065.1 at one deviation, 3,980.9 to 4,079.5 at two and 3,969.8 to 4,090.6 at three. These bands describe dispersion, not intraday reach, and the five-day window carries the 3,940.4 settle of 11/03, which the next settlement drops.
Key Levels
Resistance
Above the 4,030.2 settle, the first references are the 4,031.4 stall of the 9-day average projection and the 4,040.5 close of the 4:30 PM ET bar. The 4,060.8 midpoint of the four-week range, the 4,065.1 one standard deviation resistance and the 4,065.8 cash-hours high lead into the Pivot Point at 4,069.1 and the 20-day average at 4,069.6. The 4,075.1 stall of the 3-10-16 day MACD projection, the 4,079.5 two-deviation band and the 5-day average at 4,081.2 follow, with the 4,090.6 three-deviation band, the 4,103.6 retracement from the four-week high and Pivot R1 at 4,117.3 beyond.
Support
Beneath the settle sits Tuesday's 4,020.8 low, with the 4,018.0 retracement from the four-week low and the 4,015.9 published target price just beneath it. One standard deviation support at 3,995.3, Pivot S1 at 3,981.9 and the 3,980.9 two-deviation band form the next band, with the 3,969.8 three-deviation band, the 3,940.4 settle of 11/03, Pivot S2 at 3,933.7 and the 3,879.3 52-week low as the deeper references.
Macro Drivers
Dollar and Real Yields
The dollar index's daily record closed at 102.23, up 0.57 percent from 101.65, after trading between 101.49 and 102.41, and the ten-year yield index closed at 4.98 percent, up 12 basis points from 4.86, after a 5.02 percent high. The news feed reported a ten-year note auction high yield of 5.02 percent at 1:00 PM ET, a feed item unconfirmed against the verified calendar. The data captured no inflation-protected yield series, so the real-yield component is not measured here; gold fell while the dollar and nominal yields rose, and these moves coincided.
Fed and Monetary Policy
At 4:00 AM ET the market-moving feed carried remarks from a Fed Governor that a half-point rate hike may be needed in December if October core inflation came in around 0.3 percent or higher, and the core print matched that threshold at 0.3 percent. At 11:15 AM ET the macro feed carried a headline that a Fed official sees two more hikes, a news-feed item unconfirmed against the verified calendar. From 3:31 PM ET the bonds feed carried remarks from the Fed Vice Chair for Supervision, in an appearance scheduled for 3:30 PM ET on Tuesday, November 10, 2026, per the verified forward calendar, that the data suggest inflation pressures may persist, and at 4:28 PM ET that inflation not being on a downward trend should give pause. The provider's commentary described a debate over a half-point December hike, which is attributed commentary.
Geopolitical backdrop
Feeds carried reports on Iran diplomacy through the afternoon. These are reports carried by the feeds, and the settlement series does not establish that any single item caused a particular move.
China and Structural Demand (Central Bank Buying, PBOC, ETF Flows)
The data captured no central-bank purchase figure and no fund-holdings series, so structural demand is not measured here. The gold fund tracked on the positioning console closed at 369.58, down 2.62 percent from 379.53, on volume of 2,404,445 shares as listed on the console, which describes participation in the fund on the day but not a holdings change.
Energy and Cross-Asset
Silver's December contract fell 2.79 percent to 51.225, so silver fell further than gold in percentage terms and the gold-silver ratio rose to 78.68 from 78.08. December crude fell 0.93 percent to 86.04. The S&P 500 cash index fell 0.38 percent, the Nasdaq-100 0.60 percent, and the volatility index closed at 19.46, down 2.31 percent. A macro feed headline at 2:30 PM ET described gold moving toward 4,000 as Treasury yields rose above 5 percent, which is attributed commentary.
Institutional Positioning (COT, ETF Holdings, Speculator Length)
Tuesday's December volume was 181,306 contracts against 190,642 on Monday, per the settlement record, and the overview lists open interest of 245,394 contracts, the latest published figure. The February contract settled at 4,063.5, so its premium over December narrowed to 33.3 from 33.9. The run did not capture a weekly positioning report for gold, so speculator length is not cited.
Positioning on the gold fund
The gold fund is used here qualitatively only and is never translated into futures prices: the fund's price runs at roughly one eleventh of the futures price, with a fee drag, and it has no clean basis to the December contract. The positioning console, read at 6:30 PM ET, lists the fund at 369.58 against a 379.53 previous close, with its largest gamma concentration at 400, a hedging-pressure reference at 370, its primary call side ceiling at 400 and its primary put side support base at 350.
In our reading the fund's close sits 0.42 beneath its 370 hedging-pressure reference and 19.58 above its 350 put side base, so the fund ended Tuesday at the reference that separates the upper and lower parts of its positioning map rather than near either outer level. That is a statement about the fund's own options positioning, not a futures level, and no futures level is derived from it.
The console's high and low volatility point fields can render inverted and are excluded from the analysis. No dealer-positioning flow series for the fund was read this analysis, so no statement about the timing of hedging flows during the session is made.
Forecast
Night Session (6:00 PM ET Tuesday to 3:00 AM ET Wednesday, Globex/Asia)
Globex reopened at 6:00 PM ET on Tuesday with the overview showing a 4,043.7 open, above the 4,030.2 settle. Remarks by the Fed Vice Chair for Supervision are scheduled for 6:30 PM ET on Tuesday, November 10, 2026, per the verified forward calendar. Bias neutral to lower beneath the Pivot Point at 4,069.1, expected band roughly 4,005 to 4,065.
London Session (3:00 AM to 8:00 AM ET Wednesday)
Remarks by the European Central Bank President are listed for 3:45 AM ET on Wednesday, November 11, 2026 by the news-feed calendar, unconfirmed. Bias neutral to lower beneath the 4,065.1 one-deviation band, expected band roughly 4,000 to 4,070.
Morning Session (9:30 AM to 12:00 PM ET Wednesday, US Open)
The 9:30 AM ET equity cash open falls on the Veterans Day holiday, when CME Globex keeps normal hours and banks are closed, per the verified forward calendar, so dollar liquidity may be thinner than on Tuesday. Expected band roughly 3,995 to 4,075, with the 4,065 to 4,075 setup band at the top.
Afternoon Session (12:00 PM to 4:00 PM ET Wednesday)
The weekly government petroleum report moves to 12:00 PM ET on Thursday, November 12, 2026, per the verified forward calendar, which places that release after Wednesday. The 4:00 PM ET equity cash close is the last reference of the session in the analysis. Expected band roughly 4,000 to 4,070.
Night Session Forward (6:00 PM ET Wednesday)
The Wednesday evening session carries into weekly jobless claims, listed for 8:30 AM ET on Thursday, November 12, 2026 by the news-feed calendar, unconfirmed, and the producer price index at 8:30 AM ET on Friday, November 13, 2026, per the verified forward calendar. Japanese producer prices are listed for 6:50 PM ET on Wednesday by the news-feed calendar, unconfirmed.
Expected Range (Wednesday Full Session)
- Low-range scenario: 4,005 to 4,065
- Mid-range scenario (most likely): 3,980 to 4,080
- High-range scenario: 3,940 to 4,117
Most Likely Path
In our analyst judgment, the most probable path holds the contract between one standard deviation support at 3,995.3 and the Pivot Point at 4,069.1, with a rebound toward the 4,065 to 4,075 band that stalls beneath the 5-day average at 4,081.2 weighted above a settle through it. The composite reads "40% SELL" with direction "Strengthening", the settle sits beneath the 5-day, 20-day and 50-day averages after a close at 6.9 percent of the range, and the dollar and yields rose on the inflation data, which in our reading favours selling a rebound rather than buying the first test of Tuesday's low.
The alternative that would invalidate this reading is a settle above Pivot R1 at 4,117.3, which would bring the 4,156 to 4,158 area of three recent highs back into play. On the other side, a further rise in yields could carry the contract through the 3,995.3 band toward Pivot S2 at 3,933.7 without the rebound the setup needs. The composite's direction reads "Strengthening" and the snapshot a week ago read "88% SELL", so the composite is less negative than a week earlier, which argues against extending the downside objectives.
Calendar
Tuesday's releases are complete. The consumer price index was released at 8:30 AM ET on Tuesday, November 10, 2026, per the verified forward calendar, and the news-feed calendar records a monthly headline rise of 0.4 percent against a 0.3 percent forecast and a core rise of 0.3 percent against 0.2 percent. Remarks by a Fed Governor were scheduled for 4:00 AM ET on Tuesday, November 10, 2026, per the verified forward calendar. The news feed reported a ten-year note auction high yield of 5.02 percent at 1:00 PM ET, a feed item unconfirmed against the verified calendar.
Remarks by the Fed Vice Chair for Supervision were scheduled for 3:30 PM ET on Tuesday, November 10, 2026, per the verified forward calendar, with a second appearance at 6:30 PM ET. Wednesday, November 11, 2026 is the Veterans Day holiday, with CME Globex on normal hours and normal settlement times and banks closed, per the verified forward calendar. Remarks by the European Central Bank President at 3:45 AM ET on Wednesday are listed by the news-feed calendar, unconfirmed.
Later in the week, the producer price index is scheduled for 8:30 AM ET on Friday, November 13, 2026, per the verified forward calendar, and weekly jobless claims are listed for 8:30 AM ET on Thursday by the news-feed calendar, unconfirmed. The news-feed calendar lists the Fed's rate statement for 2:00 PM ET on Wednesday, December 9, 2026, unconfirmed. In our judgment the first-order input for gold on Wednesday is the dollar's follow-through on Tuesday's inflation data in holiday-thinned trade, with the producer price index on Friday the next confirmed test.
Primary setup
Direction: Short
Rationale: The contract settled at 6.9 percent of a 135.4 point range, beneath the 20-day average again and beneath the 50-day for a 35th session, while the dollar and yields rose on the inflation data and the composite reads "40% SELL". A rebound into the 4,065 to 4,075 band, around the Pivot Point at 4,069.1, the 20-day average at 4,069.6 and the 4,075.1 projection stall, offers a short with a defined risk point above the 4,090.6 three-deviation band. The composite's "Strengthening" direction and the post-settle recovery to 4,040.5 are the main risks to a short, so the setup is an analyst judgment that rebounds into the Pivot Point are sold, not a measured edge.
Entry Zone: 4,065 to 4,075
Stop Loss: 4,095 (above the 4,090.6 three-deviation band, beneath the 4,103.6 retracement)
Target 1 (T1): 4,045 (beneath the 4,046.4 low of the 8:30 AM ET bar)
Target 2 (T2): 4,020 (beneath Tuesday's 4,020.8 low)
Target 3 (T3, extended): 3,995 (at one standard deviation support of 3,995.3)
Risk-to-Reward: Approximately 1:1 to T1, 1:2 to T2, 1:3 to T3
Invalidation: A settle above Pivot R1 at 4,117.3 negates the thesis. Short of that, the edge is removed by acceptance above the entry band rather than by a touch, defined as two consecutive 30-minute closes above 4,075.
Macro override: A reversal lower in yields or the dollar, or a geopolitical headline, would lift the contract. In that scenario a move through the 4,095 stop invalidates the short before the targets, and the 4,103.6 retracement becomes the reference, 8.6 beyond the stop and well inside one 14-day average true range of 90.7.
Sources and methodology
Prices, settlements, volume and open interest come from the exchange settlement record and the provider’s daily series for the December contract (GCZ26). Session timing comes from the 30-minute bar series of Tuesday’s Globex session, from the 6:00 PM ET reopen on Monday. Moving averages were computed from 259 completed daily settlements; oscillators, the composite read and the pivot ladder are quoted as published. The gold fund’s positioning is used qualitatively and never converted to a futures level. Economic-calendar times come from the verified forward calendar unless marked as listed and unconfirmed.
The prior card is graded only on its own levels, with the full Tuesday session from the reopen; no fill price is assumed beyond the band.
Three tries at 4,157 have failed in five sessions, and the next test sits much lower, at 4,069.