At the 6:00 PM ET reopen on Wednesday, the December Nasdaq-100 contract opened at 28,663.00, inside the 28,640 to 28,680 short band we had set at the settle. That bar made the session high. All three targets traded within the next two hours, the second and third in the 8:00 PM ET bar. The stop never did.
Then came the cash session. The contract settled at 26,752.00 on Thursday, down 1,814.75 points or 6.35 percent, after a 2,098.50 point range. The decline is the largest one-session point decline, and the range the widest, in the 259 completed settlements in the series. Friday's card is another short, from 27,280 to 27,320. It sits above the settle. So do all three of its targets.
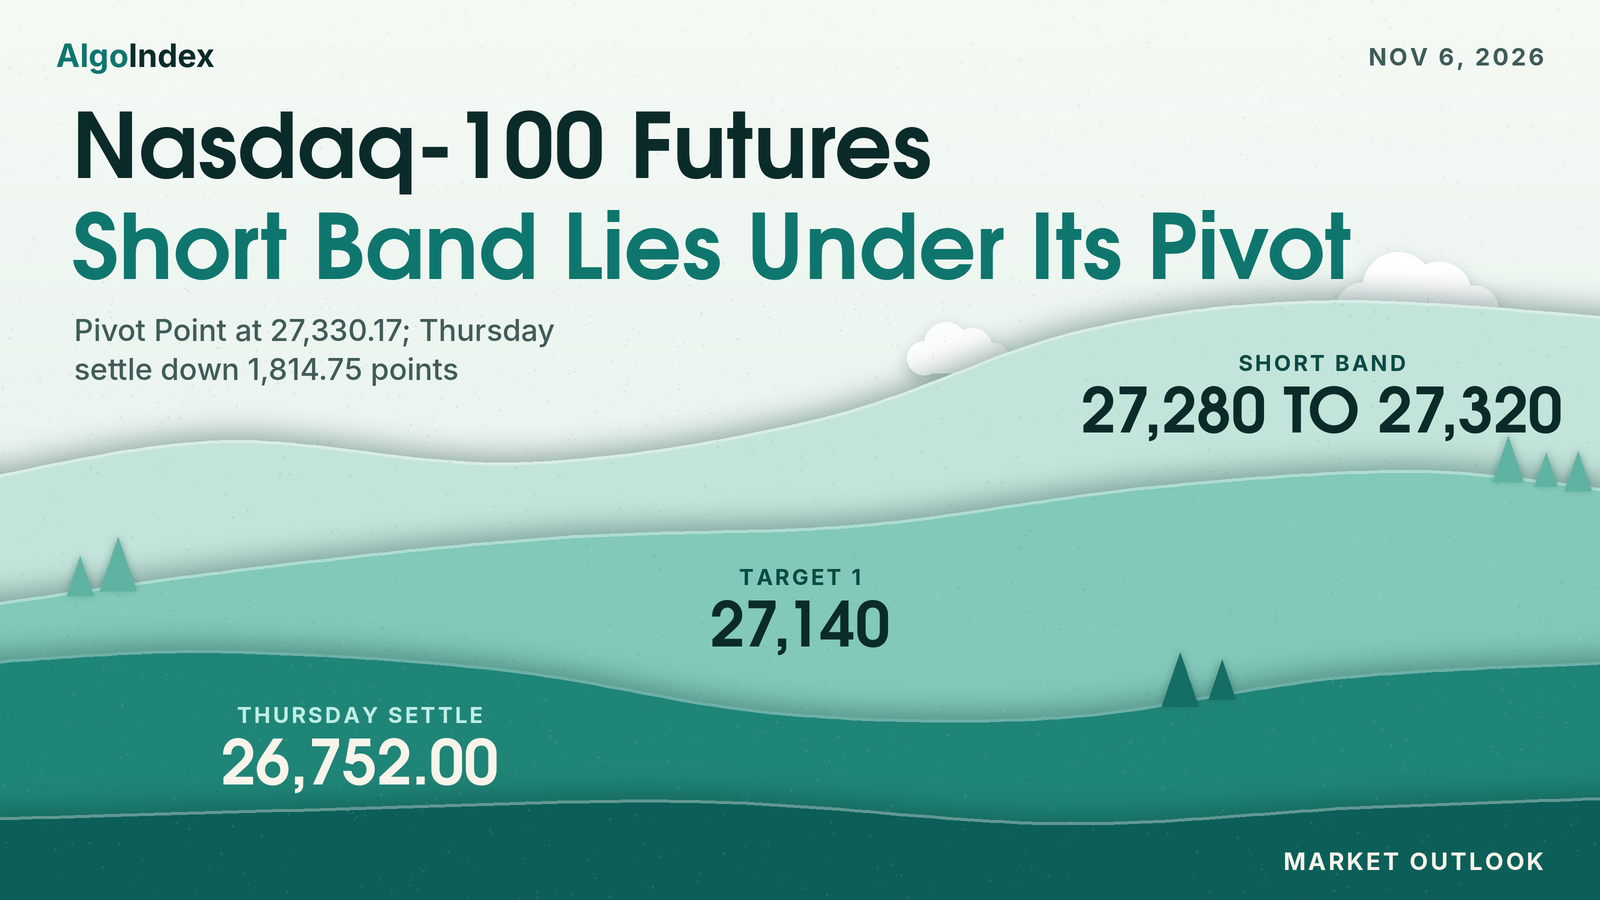
December Nasdaq-100 futures settled at 26,752.00 on Thursday, down 1,814.75 points or 6.35 percent, after a range between 26,570.00 and 28,668.50, and beneath every settlement average from the 5-day to the 200-day. Scored from Wednesday's settle, when it was set, Thursday's short band at 28,640 to 28,680 traded in the 6:00 PM ET bar, which opened inside it. All three targets traded by the 8:00 PM ET bar, and the 28,800 stop never traded. No fill or result is asserted. The primary setup for Friday is a short from 27,280 to 27,320, a band 528.00 points above the settle and just beneath the 27,330.17 Pivot Point, stop 27,460, targets 27,140, 26,980 and an extended 26,820, all three above the settle, so the setup needs a rebound first. The employment situation report is scheduled for 8:30 AM ET, as the calendar lists it.
Thursday’s card: the band traded at the reopen, all three targets by 8:00 PM ET
In Thursday’s outlook we set a short from 28,640 to 28,680, stop 28,800, at Wednesday's settle of 28,566.75. Its targets sat at 28,520, 28,380 and an extended 28,240. A settle above the 28,920.38 stochastic projection would negate it. Thursday's bar, from the review and the provider's 2026-11-05 settlement row, opened at 28,663.00 at the Wednesday 6:00 PM ET reopen, made a high of 28,668.50 and a low of 26,570.00, and settled at 26,752.00.
The band traded at once. The 6:00 PM ET bar opened at 28,663.00, 23.00 points above the band bottom. Its 28,668.50 high was the session high, 11.50 beneath the band top and 131.50 beneath the stop. It closed at 28,571.00, 69.00 points beneath the band. No 30-minute bar closed higher all session. No later bar returned to the band.
The targets went quickly. The 6:30 PM ET bar reached 28,518.25, through the 28,520 first target by 1.75 points. The 7:30 PM ET bar traded through the 28,488.88 retracement. Then the 8:00 PM ET bar opened at 28,457.00 and fell to 28,180.00. On the way it traded through the 28,380 second target, the Pivot Point at 28,383.83 and the 28,240 third target. Its low sat 60.00 points beneath the third.
The stop never traded. No 30-minute bar closed above 28,680, so the acceptance the card defined as removing the edge never came. The settle finished 2,168.38 points beneath the 28,920.38 invalidation level and 1,488.00 beneath the third target. No fill and no result are asserted.
The card's macro override named two scenarios that could lift the contract: a rebound in semiconductors, or a fall in yields after the 8:30 AM ET data. Yields did ease, to 4.84 percent from 4.89. The semiconductor index fell 12.25 percent. Neither the stop nor the override's 28,920.38 reference traded, and no series here separates the effects of yields and chips on the contract.
The 30-minute series also scores each range over its own window. None held. Every scenario and session band was exceeded on the downside. The high-range case of 27,800 to 29,150 came closest, and the session low still sat 1,230.00 points beneath its bottom. The night band of 28,350 to 28,750, scored to 3:00 AM ET, held the 28,668.50 high. Its bottom gave way by 182.25 points, at the 28,167.75 low of the 12:30 AM ET bar.
London missed by the least. Its 28,300 to 28,750 band met a window that traded between 28,267.25 and 28,465.00, the low 32.75 points under the band. The morning band of 28,150 to 28,850 met a window of 26,732.00 to 28,228.25. From 12:00 PM to 4:00 PM ET the contract traded between 26,718.00 and 27,180.00. All of it sat beneath the afternoon band of 28,150 to 28,850.
The base case, an analyst judgment, held the contract between the Pivot Point at 28,383.83 and Wednesday's 28,969.00 high, with rebounds into the 28,629.58 to 28,664.58 equivalents that stall. Price sat among those equivalents at the reopen. The 6:00 PM ET bar opened between them and turned lower. The range did not hold: the 8:00 PM ET bar traded 203.83 points beneath the Pivot Point.
That made the ranked third case the one that printed: a move beneath the Pivot Point that could bring the 28,129.58 key strike equivalent into play. The band had traded first. The night low of 28,167.75 held 38.17 points above that equivalent. It gave way in the 9:30 AM ET bar.
A 1,814.75 point decline: a 2,098.50 point range and a settle at 8.7 percent of it
The decline came in the cash session. From the 6:00 PM ET reopen to 3:00 AM ET the bars held between 28,167.75 and 28,668.50. The 8:00 PM ET bar fell 186.75 points, from 28,457.00 to 28,270.25, and the window closed at 28,298.75. From 3:00 AM ET to the 9:30 AM ET cash open the contract traded between 28,200.25 and 28,465.00. It closed that window at 28,205.25.
Then the open. The 9:30 AM ET bar fell 669.75 points, from 28,203.25 to 27,533.50, with a low of 27,457.50. No bar fell further. The 10:00 AM ET bar fell 309.00 to 27,226.00, and the 10:30 AM ET bar 251.75 to 26,974.50, with a low of 26,732.00. That low sat 1,471.25 points beneath the 9:30 AM ET open, three bars earlier.
A rebound followed. The 11:00 AM ET bar rose 339.75 points, from 26,974.25 to 27,314.00, the largest gain of any bar. The 11:30 AM ET bar made the 27,358.00 rebound high. The 10:00 AM ET through 11:30 AM ET bars all traded inside Friday's 27,280 to 27,320 band. From 12:00 PM ET to 2:00 PM ET the bars held between 26,816.00 and 27,151.25.
The afternoon swung twice. The 2:30 PM ET bar rose 210.75 to 27,116.75, and the 3:00 PM ET bar fell 226.75 to 26,888.50. The 3:30 PM ET bar closed at 26,742.50, 9.50 beneath the 26,752.00 settle. After the cash close the 4:00 PM ET bar made the 26,570.00 low. The 4:30 PM ET bar closed at 26,604.00, 148.00 points beneath the settle.
The daily bar sets two marks. The 1,814.75 point decline is the largest one-session point decline, and the 2,098.50 point range the widest, in the 259 completed settlements in the series, which run from 10/28/25 and include thinly traded early rows. The settle is the lowest since the 26,452.00 settle of 04/14/26. The low is the lowest since the 26,425.00 low of 04/15/26.
The settle finished at 8.7 percent of the range. That range was 2.70 times the 14-day average daily range of 777.29, and 745.25 points wider than Wednesday's. Thursday printed a lower high, 300.50 beneath Wednesday's 28,969.00, and a lower low, 1,045.75 beneath Wednesday's 27,615.75. The settle sat 863.75 beneath that low.
The pivot ladder rests on that bar. The overview's open, high and low already belong to the reopened Friday session, so the review takes Thursday's range from the settlement record and the published ladder. Pivot R3 at 30,188.83 less Pivot S3 at 23,893.33, divided by three, returns 2,098.50. So does Pivot R2 at 29,428.67 less Pivot S2 at 25,231.67, divided by two. Three times the 27,330.17 Pivot Point less the settle gives 55,238.51, the sum of the high and the low within published rounding.
The five-session picture is lower too. The last six settles read 29,562.00, 28,534.00, 28,127.50, 28,305.75, 28,566.75 and 26,752.00. Thursday's decline more than reversed the 439.25 points gained over Tuesday and Wednesday. Over five sessions the contract is down 2,810.00 points, or 9.51 percent, from the 29,562.00 settle of 10/29. The 31,616.50 52-week high of 10/06 sits 4,864.50 points up, with the settle 15.39 percent beneath it.
Resistance starts close. The 26,814.18 oscillator stall sits 62.18 points up. The 27,034.38 projection for a 30 percent relative strength and the 27,122.19 conversion of the NDX 27,000 key strike follow. The Pivot Point at 27,330.17 and the 27,358.00 rebound high sit 27.83 apart. One standard deviation resistance at 27,503.21, the one-ATR line at 27,522.03 and the 27,522.75 midpoint of the 52-week range lie within 19.54 points.
Higher up sit Wednesday's 27,615.75 low and two deviations at 27,814.37. Three deviations at 28,053.13, the 5-day average at 28,057.25, Pivot R1 at 28,090.33 and the 28,122.19 conversion of the NDX 28,000 put side support base lie within 69.06 points. A tighter group follows. The 200-day at 28,488.75, the 61.8 percent retracement from the 52-week low at 28,488.88 and the 38.2 percent retracement from the four-week low at 28,497.76 lie within 9.01. Wednesday's 28,566.75 settle, Thursday's 28,668.50 high, the 28,697.19 threshold conversion, the 9-day crossing price at 28,704.94 and the 9-day average at 28,786.25 close the ladder.
Support sits closer. The 3:30 PM ET close of 26,742.50 sits 9.50 beneath the settle and the 4:30 PM ET close of 26,604.00 sits 148.00 beneath it. Thursday's 26,570.00 low, now the one-month and 13-week low, sits 13.37 above the 26,556.63 38.2 percent retracement from the 52-week low. The 26,452.00 settle of 04/14/26, the 26,425.00 low of 04/15/26 and the published target price at 26,404.22 come next.
Further down, one standard deviation support at 26,000.79, Pivot S1 at 25,991.83 and the one-ATR line at 25,981.97 lie within 18.82 points. Two deviations at 25,689.63, three at 25,450.87 and Pivot S2 at 25,231.67 follow. Pivot S3 at 23,893.33 and the 23,429.00 52-week low are the extended references.
The settle sits beneath every average. It sits 1,305.25 points beneath the 5-day at 28,057.25 and 1,736.75 beneath the 200-day at 28,488.75. The 9-day at 28,786.25 sits 2,034.25 up and the 20-day at 29,463.00 sits 2,711.00 up. The 100-day at 29,847.75 and the 50-day at 29,936.50 sit 3,095.75 and 3,184.50 up. The review computed the averages from 259 completed daily settlements and rounded each once to the 0.25 tick.
The contract settled beneath the 200-day on Monday and Tuesday, above it on Wednesday and beneath it again on Thursday. One caveat applies. The 200-day window starts on 01/23/26 and holds 47 sessions, through 04/27/26, with no recorded volume. Those thinly traded early rows carry quoted settlement prices, so the 200-day rests on thin history. The 5-day fell 562.00 points from Wednesday's 28,619.25 as the 10/29 settle of 29,562.00 left the window.
The order of the longer averages comes from their older settlements. The 30 older ones in the 50-day window averaged 30,252.18, above the 20-day, so the 20-day sits beneath the 50-day. The 50 older ones in the 100-day window averaged 29,758.99, and the 100 older ones in the 200-day window 27,129.82. Both run lower. Friday's crossing price for the 9-day average is 28,704.94.
The oscillators sit low on their scales. Relative strength reads 22.06 on the 9-day, 26.51 on the 14-day and 30.59 on the 20-day. The 9-day and 14-day raw stochastics both read 5.04 percent and the 20-day 3.86 percent. The 14-day %K at 17.91 percent sits 3.72 points above %D at 14.19 percent. Sellers lead. On the 9-day, negative direction at 33.10 tops positive at 12.45 by 20.65, with the ADX at 37.60; on the 14-day, 31.89 tops 13.43 by 18.46, with the ADX at 28.79.
Historic volatility reads 38.84 percent on the 9-day and 34.91 percent on the 14-day. These readings are as published, read at 6:25 PM ET on Thursday after the Globex reopen, and may already reflect the reopened session's price. A composite multi-indicator read published for Friday sits at 88 percent sell, unchanged from the prior session. Strength is described as maximum and direction as strongest. A week ago it read 16 percent sell. A month ago, 88 percent buy. The short and medium-horizon groups average 100 percent sell and the long group 33 percent sell, and the trend composite reads sell.
One average true range either side of the settle spans 25,981.97 to 27,522.03, on the 14-day figure of 770.03. The 9-day average true and daily ranges read 885.92 and 880.89, the 20-day 698.42 and 714.96. The deviation bands, built from five settlements and centred on the settle, run 26,000.79 to 27,503.21, 25,689.63 to 27,814.37 and 25,450.87 to 28,053.13. They describe settlement dispersion only. After a decline of this size they are wide. Ten sessions of daily ranges, from 10/23, read 339.00, 548.00, 593.25, 503.75, 683.25, 947.25, 789.50, 411.25, 1,353.25 and 2,098.50 points.
A 6.36 percent cash decline, a 12.25 percent chip decline and a close beneath every positioning level
The cash market fell with the contract. The Nasdaq-100 cash index closed at 26,629.81, down 1,807.36 points or 6.36 percent. The S&P 500 fell 4.36 percent and the Dow industrials 3.44 percent. The semiconductor index fell 12.25 percent, or 1,257.51 points, to 9,011.14. The volatility index closed at 28.18, up 69.66 percent from 16.61.
Commentary filled in the picture, all of it attributed. Commentary carried by the news feed on the post-election policy outlook, which it tied to artificial-intelligence and data-centre spending, described a broad selloff led by technology shares and a continuing rotation. That is attributed commentary, and the series does not establish that any single report caused a particular move. An investment-bank note carried by the feed described recent breadth as positioning-driven. At 9:57 AM ET the equities news feed carried an investment-bank cut to its price target for a chip-design licensor.
Company items ran through the day, per the equities news feed. At 9:27 AM ET it carried a report of a ratings agency saying a major share of planned data-centre capacity may face regulatory hurdles. It also carried a report that a large software company was increasing oversight of neocloud providers amid data-centre delays and costs. Two financing items followed. At 12:01 PM ET the feed carried a 17 billion dollar data-centre investment by a search company, and at 1:39 PM ET 31 billion dollars of orders for a consumer-hardware company's bond sale.
At 2:52 PM ET the equities news feed carried a request from lawmakers for a briefing from a chip designer's chief executive on links to China. These are reports carried by the feed. This article ties no price move to any of them.
Yields eased. The ten-year yield index closed at 4.84 percent, down five basis points, and the dollar index at 101.55 against 101.57. Yields fell while the contract fell, and no series here separates the effects. Preliminary productivity, released at 8:30 AM ET as the calendar lists it, read 3.6 percent against a forecast of 2.7 percent, per the news-feed calendar. At 9:24 AM ET the news feed carried a Federal Reserve official saying productivity gains reflected adaptation to labour shortages.
Reports on US and Iran diplomacy also ran. The news feed carried a report of a nuclear proposal sent to the US through an intermediary. That is a report carried by the feed, not a confirmed event, and no move is attributed to it. Elsewhere, December WTI crude rose 2.72 percent to 90.52 and December gold 0.99 percent to 4,113.5. Each move is reported on its own. None is presented here as the cause of another, or of the index's decline.
The cash close sits beneath every positioning level. The dataset's reference prices are Wednesday's closes: NDX 28,437 corresponds to Wednesday's 28,437.17 cash close, and SPX 7,688 to Wednesday's 7,688.62. Its levels were computed before Thursday's session. The dataset does not state how they shifted during the decline. Against Thursday's 26,629.81 close, the index sits 370.19 points beneath the 27,000 key strike, the nearest level overhead.
Further up, the 28,000 put side support base, also the largest gamma concentration, sits 1,370.19 above the close. The 28,575 modeled volatility threshold sits 1,945.19 up and the 28,579 modeled gamma-flip level 1,949.19. The call side ceiling at 29,675 sits 3,045.19 up. The dataset lists 28,000, 29,000, 27,000 and 29,675 as key index strikes and 27,954, 27,527, 28,352 and 27,755 as combination levels.
Gamma tilt, a model output, reads 0.896 for the index and 0.606 for the QQQ fund proxy. Gamma notional reads minus 3.17 million dollars and minus 924.191 million. The 25-delta risk reversal reads minus 0.052 and minus 0.037. All are model outputs.
On the QQQ proxy the call side ceiling sits at 705, the secondary dealer level and largest gamma concentration at 700 and the put side support base at 680. Those are proxy levels. The console, read at 6:18 PM ET, carried Wednesday's 691.82 as its previous close and a console price of 644.60. The review treats that as a console reading, not Thursday's close. Call gamma reads minus 1.54 billion against put gamma of minus 2.54 billion.
Call volume of 1.39 million ran against put volume of 1.71 million; options volume carries no direction here. One-month implied volatility reads 22.22 percent against realised volatility of 22.24 percent. The implied-volatility rank reads 50.17 percent, the skew rank 82.40 percent and the put-to-call open-interest ratio 1.2.
The basis narrowed to 122.19 points, the 26,752.00 settle less the 26,629.81 cash close, from 129.58 on Wednesday. The review converts three positioning levels at it. The NDX 27,000 key strike becomes 27,122.19 and the NDX 28,000 base 28,122.19. The modeled volatility threshold at NDX 28,575 becomes 28,697.19. The conversions are the review's own.
In the review's interpretation, a close beneath every index level in the dataset leaves no dataset reference beneath the price, so the support levels rest on published pivot arithmetic, standard-deviation bands and retracements. Gamma stays a damping lens here. It carries no direction. No directional read is drawn from options volume or modeled gamma. Friday's band sits 157.81 points above the 27,122.19 conversion, the nearest dataset reference overhead.
Activity rose. Volume came to 1,242,866 contracts on the 2026-11-05 row, against Wednesday's 1,004,813 on the 2026-11-04 row, a figure revised from the 980,905 carried in Thursday's outlook. Open interest reads 285,573 on that 2026-11-04 row, which Thursday's outlook listed as not yet reported. That is 4,473 beneath the 290,046 on the 2026-11-03 row. Thursday's open interest is not yet reported. No weekly positioning report figure is carried.
The trade map for Friday
The primary setup is a short from 27,280 to 27,320. The contract settled at 8.7 percent of the widest range in the series, beneath every settlement average. The composite reads 88 percent sell with direction strongest, and negative direction leads on both directional systems. The whole band sits above the settle, its bottom 528.00 points up and its top 568.00. Its top sits 10.17 beneath the Pivot Point at 27,330.17 and 38.00 beneath the 27,358.00 rebound high.
Then the stop. At 27,460 it sits 140 points above the band top, 102.00 above the rebound high and 708.00 above the settle. One standard deviation resistance at 27,503.21 sits 43.21 beyond it. All three targets sit above the settle as well. The first, 27,140, sits 17.81 above the 27,122.19 key strike conversion. The second, 26,980, sits 54.38 beneath the 27,034.38 projection. Then the extended third. At 26,820 it sits 5.82 above the 26,814.18 oscillator stall and 68.00 above the settle.
The setup needs a rebound first. Price would have to rise 528.00 points, or 1.97 percent, from the settle to reach the band. Oscillators are stretched after a 1,814.75 point decline, and a rebound can run through the band after the 8:30 AM ET report. So the review calls the setup an analyst judgment that rebounds into the Pivot Point are sold, with no measured edge behind it. Price has been there before. The 10:00 AM ET through 11:30 AM ET bars on Thursday traded inside the band, and the 11:00 AM ET bar closed at 27,314.00, inside it.
Now the arithmetic. From the 27,300 midpoint the risk to the stop is 160 points, 20.8 percent of the 14-day average true range of 770.03. The targets sit 160, 320 and 480 points beneath the midpoint. Exact multiples. The first target sits 140 points beneath the band bottom.
The scenario ranges are analyst judgment. The low-range case runs 26,300 to 27,100, its top 180.00 beneath the band bottom. The most likely case runs 26,000 to 27,400, its bottom 8.17 above Pivot S1 and its top 60.00 beneath the stop. The high-range case runs 25,700 to 27,800. Its bottom sits 10.37 above two deviations support, its top 14.37 beneath two deviations resistance.
Session by session, the review expects roughly 26,200 to 27,000 through the night to 3:00 AM ET, with a bias lower beneath the Pivot Point. That top sits 280.00 beneath the band bottom. London follows from 3:00 AM ET at 26,300 to 27,100, with a bias lower to neutral beneath the 27,122.19 conversion. The morning band runs 26,100 to 27,400, with the setup band near its top. The afternoon band runs 26,200 to 27,300, its top 20.00 above the band bottom.
Friday's calendar starts overnight. Remarks by a Federal Reserve official at 7:00 PM ET on Thursday, and by Federal Reserve officials at 4:30 AM ET and 9:10 AM ET, are listed by the news-feed calendar, unconfirmed. Then the data. The employment situation report is scheduled for 8:30 AM ET, as the calendar lists it. The preliminary consumer sentiment survey at 10:00 AM ET is listed by the news-feed calendar, unconfirmed. Remarks by the Federal Reserve vice chair for supervision at 12:15 PM ET and consumer credit at 3:00 PM ET are scheduled, as the calendar lists them.
The scenarios are ranked. In the review's analyst judgment the base case holds the contract between Pivot S1 at 25,991.83 and the Pivot Point at 27,330.17. Within it, a rebound toward the 27,122.19 conversion and the band that stalls beneath the Pivot Point is weighted above a recovery through it. No measured frequency backs it. In the review's interpretation the 9-day relative strength at 22.06 and raw stochastics at 5.04 percent favour a rebound attempt that is sold over an immediate extension.
Second comes a settle above one standard deviation resistance at 27,503.21. That would invalidate this reading and could bring Pivot R1 at 28,090.33 into play. Third, a move beneath the 26,404.22 target price before any rebound could bring Pivot S1 at 25,991.83 into play without the rebound the setup needs. The band would stay untraded. In the review's judgment a deeper correction toward Pivot S2 at 25,231.67 is the worst-case scenario.
In the review's judgment the first-order influence on Friday is the 8:30 AM ET employment report and the reaction at the 9:30 AM ET cash open, after a session in which semiconductors led the decline. Globex reopens on Sunday at 6:00 PM ET, after two days of weekend headline risk on diplomacy. The consumer price index follows on Tuesday, November 10, at 8:30 AM ET, as the calendar lists it.
Friday's band sits 528.00 points above the settle, just beneath the 27,358.00 high where Thursday's rebound stopped.
The complete data picture
Every number behind Friday’s plan, charted first, then the full level lists, then the complete numeric reference underneath.
Both lists are classified against the 26,752.00 settle. Friday’s band, 27,280 to 27,320, sits above the settle, between the 27,122.19 key strike conversion and the 27,330.17 Pivot Point.
Full numeric reference, every remaining figure from the session review
1. Executive Summary
The December Nasdaq-100 contract settled at 26,752.00 on Thursday, down 1,814.75 or 6.35 percent from Wednesday's settle of 28,566.75, after trading between 28,668.50 and 26,570.00, a 2,098.50 point daily range. The settle finished at 8.7 percent of the range, and the range was 2.70 multiples of the 14-day average daily range of 777.29 points. Thursday printed a lower high, 300.50 beneath Wednesday's 28,969.00, and a lower low, 1,045.75 beneath Wednesday's 27,615.75. The 1,814.75 point decline is the largest one-session point decline and the 2,098.50 point range the widest in the 259 completed settlements in the series, which run from 10/28/25 and include thinly traded early rows. The 26,752.00 settle is the lowest since the 26,452.00 settle of 04/14/26, and the 26,570.00 low the lowest since the 26,425.00 low of 04/15/26.
The decline came in the cash session. The overnight hours held between 28,167.75 and 28,668.50, and the 9:30 AM ET bar fell 669.75, from 28,203.25 to 27,533.50, the largest decline of any 30-minute bar in the session; the 10:00 AM ET and 10:30 AM ET bars fell a further 309.00 and 251.75. The Nasdaq-100 cash index closed at 26,629.81, down 6.36 percent, and the semiconductor index fell 12.25 percent. Commentary carried by the news feed on the post-election policy outlook, which it tied to artificial-intelligence and data-centre spending, described a broad selloff led by technology shares; that is attributed commentary, and the series does not establish that any single report caused a particular move.
The S&P 500 cash index fell 4.36 percent, the volatility index closed at 28.18, up 69.66 percent, the ten-year yield eased to 4.84 percent and the dollar index held at 101.55. The settle sits beneath every settlement average from the 5-day to the 200-day, and it is back beneath the 200-day average after one session above it.
The composite multi-indicator read published for Friday is "88% SELL" with strength "Maximum" and direction "Strongest", unchanged in percentage from "88% SELL" a session earlier. The Primary Setup in section 8 is a short from the 27,280 to 27,320 band beneath the Pivot Point at 27,330.17, stopped at 27,460, with objectives at 27,140, 26,980 and an extended 26,820.
2. Price Action & Technical Structure
2.1 Intraday and Session Review
The Thursday session opened at 28,663.00 at the Wednesday 6:00 PM ET reopen, 96.25 above Wednesday's settle, and the 30-minute series places the high of 28,668.50 in the 6:00 PM ET bar and the low of 26,570.00 in the 4:00 PM ET bar. Between the 6:00 PM ET reopen and 3:00 AM ET the bars held between 28,167.75 and 28,668.50; the 8:00 PM ET bar fell 186.75, from 28,457.00 to 28,270.25, and the window closed at 28,298.75.
From 3:00 AM ET to the 9:30 AM ET cash open the contract held between 28,200.25 and 28,465.00 and closed that window at 28,205.25. The 9:30 AM ET bar fell 669.75 to 27,533.50 with a low of 27,457.50, the 10:00 AM ET bar fell 309.00 to 27,226.00 and the 10:30 AM ET bar fell 251.75 to 26,974.50 with a low of 26,732.00. The 11:00 AM ET bar rose 339.75, from 26,974.25 to 27,314.00, the largest gain of any 30-minute bar in the session, and the 11:30 AM ET bar made the 27,358.00 rebound high. From 12:00 PM ET to 2:00 PM ET the bars held between 26,816.00 and 27,151.25; the 2:30 PM ET bar rose 210.75 to 27,116.75 and the 3:00 PM ET bar fell 226.75 to 26,888.50. The 3:30 PM ET bar closed at 26,742.50, 9.50 beneath the 26,752.00 settle, and after the cash close the 4:00 PM ET bar made the 26,570.00 low; the 4:30 PM ET bar closed at 26,604.00.
The open, high and low on the provider's overview page now belong to the Globex session that reopened at 6:00 PM ET for Friday, so Thursday's completed range is taken from the settlement record and the published pivot ladder. Pivot R3 at 30,188.83 minus Pivot S3 at 23,893.33, divided by three, returns 2,098.50, and Pivot R2 at 29,428.67 minus Pivot S2 at 25,231.67, divided by two, returns the same 2,098.50. Three times the Pivot Point of 27,330.17 less the 26,752.00 settle gives a high plus low sum of 55,238.51, which solves to 28,668.51 and 26,570.01, within the ladder's published rounding of the settlement row's 28,668.50 high and 26,570.00 low; that pair reproduces all seven published rungs. These are the completed-session inputs behind the published pivot ladder rather than an independently read bar, and they are corroborated by the provider's settlement row and the chart's completed daily bar, which carry the same 28,663.00 open, 28,668.50 high, 26,570.00 low and 26,752.00 settle.
2.2 Daily Structure
Thursday printed a lower high and a lower low against Wednesday and settled 1,814.75 lower, beneath Wednesday's 27,615.75 low. Settlements over the last six sessions read 29,562.00, 28,534.00, 28,127.50, 28,305.75, 28,566.75 and 26,752.00, so Thursday's decline more than reversed the 439.25 points gained over Tuesday and Wednesday. Over five sessions the contract is down 2,810.00 from the 29,562.00 settle of 10/29, which the provider also publishes as a 9.51 percent five-day change.
The provider publishes 31,616.50 as the 52-week, 13-week and one-month high, and Thursday's 26,570.00 low now stands as the one-month and 13-week low; the 52-week low is 23,429.00. The Thursday settle sits 195.37 above the 26,556.63 level published as the 38.2 percent retracement from the 52-week low and 770.75 beneath the 27,522.75 midpoint of the 52-week range.
2.3 4-Hour and Swing Structure
Daily ranges for the last ten sessions, from 10/23, ran 339.00, 548.00, 593.25, 503.75, 683.25, 947.25, 789.50, 411.25, 1,353.25 and 2,098.50, so Thursday's range was the widest of the ten and exceeded Wednesday's by 745.25. In the 30-minute series the three largest declines came in the 9:30 AM ET bar, 669.75, the 10:00 AM ET bar, 309.00, and the 10:30 AM ET bar, 251.75, and the largest gains in the 11:00 AM ET bar, 339.75, and the 2:30 PM ET bar, 210.75.
Thursday's 28,668.50 high sits 300.50 beneath Wednesday's 28,969.00 and 2,948.00 beneath the 10/06 high of 31,616.50. The published grid places the 38.2 percent retracement from the four-week and 13-week low at 28,497.76, the 61.8 percent retracement from the 52-week low at 28,488.88 and the 50 percent retracement of the 52-week range at 27,522.75.
2.4 Moving Averages
The averages cited here were computed from the provider's daily settlement series for the December contract, which holds 259 completed sessions from 10/28/25 through Thursday; the partial row of the reopened Friday session is excluded, and each average is carried at full precision and rounded once to the quarter point. The 200-day window includes 47 zero-volume rows from the contract's thinly traded early months, which carry quoted settlement prices; the 200-day figure is computed as published and carries that limitation. The 5-day average stands at 28,057.25, the 9-day at 28,786.25, the 20-day at 29,463.00, the 50-day at 29,936.50, the 100-day at 29,847.75 and the 200-day at 28,488.75.
The 26,752.00 settle sits 1,305.25 beneath the 5-day average, 2,034.25 beneath the 9-day, 2,711.00 beneath the 20-day, 3,184.50 beneath the 50-day, 3,095.75 beneath the 100-day and 1,736.75 beneath the 200-day. The contract settled beneath the 200-day on Monday and Tuesday, above it on Wednesday, and beneath it again on Thursday. The 5-day average fell from Wednesday's 28,619.25 as Thursday's settle replaced the 10/29 settle of 29,562.00.
The 20-day average sits beneath the 50-day because the 30 older settlements in the 50-day window averaged higher, at 30,252.18. The 50-day sits above the 100-day because the 50 older settlements in the 100-day window averaged lower, at 29,758.99, and the 100-day sits above the 200-day because the 100 older settlements in the 200-day window averaged lower, at 27,129.82. The projection grid gives 28,704.94 as the price at which the 9-day average would be crossed on Friday.
2.5 Oscillator and Trend Readings
The oscillator figures below are as published on the provider's technical page, read at 6:25 PM ET on Thursday after the Globex reopen; they are the provider's readings and were not computed here, and the page may already reflect the reopened session's price. The 9-day relative strength reads 22.06, the 14-day relative strength 26.51 and the 20-day relative strength 30.59.
The 9-day and 14-day raw stochastic both read 5.04 percent and the 20-day raw stochastic 3.86 percent, while the 14-day stochastic %K reads 17.91 percent and the 14-day stochastic %D 14.19 percent. The 9-day directional index ADX reads 37.60 with the 9-day +DI at 12.45 and the 9-day -DI at 33.10, and the 14-day directional index ADX reads 28.79 with the 14-day +DI at 13.43 and the 14-day -DI at 31.89, so negative direction leads on both systems. The 9-day historic volatility reads 38.84 percent and the 14-day historic volatility 34.91 percent.
The composite multi-indicator read published for the Friday session is "88% SELL", with signal strength "Maximum" and direction "Strongest". The snapshot history reads "88% SELL" for the prior session, "16% SELL" a week ago and "88% BUY" a month ago. The short horizon group averages "100% SELL", the medium group "100% SELL" and the long group "33% SELL", and the trend composite reads "SELL".
2.6 Volatility and Expected Range
The published 14-day average true range stands at 770.03 points and the 14-day average daily range at 777.29 points; the 9-day average true range is 885.92 with a 9-day average daily range of 880.89, and the 20-day average true range is 698.42 with a 20-day average daily range of 714.96. Thursday's 2,098.50 point range was 2.70 multiples of the 14-day average daily range.
Adding and subtracting the 14-day average true range of 770.03 from the 26,752.00 settle frames Friday between 25,981.97 and 27,522.03. The published standard-deviation bands, built from five settlements, span 26,000.79 to 27,503.21 at one deviation, 25,689.63 to 27,814.37 at two and 25,450.87 to 28,053.13 at three. These bands describe dispersion, not intraday reach, and after a decline of this size they are wide.
3. Key Levels
3.1 Resistance
Above the 26,752.00 settle, the first references are the 27,034.38 price published as the 30 percent relative-strength projection and the 27,122.19 conversion of the NDX 27,000 dealer-positioning key strike. The Pivot Point at 27,330.17, the 27,358.00 rebound high of the 11:30 AM ET bar and one standard deviation resistance at 27,503.21 form the next band, with the 27,522.75 midpoint of the 52-week range beside it. Pivot R1 at 28,090.33, the 28,122.19 conversion of the NDX 28,000 put side support base and the 28,488.75 200-day average are the extended references.
3.2 Support
Beneath the settle sit the 26,570.00 session low and one-month low and the 26,556.63 retracement from the 52-week low. The published target price at 26,404.22, one standard deviation support at 26,000.79 and Pivot S1 at 25,991.83 form the next band. Two standard deviation support at 25,689.63 and Pivot S2 at 25,231.67 are the deeper references.
4. Macro Drivers
4.1 Largest-Company Results and the AI Spending Cycle
The equities news feed carried items on artificial-intelligence spending through the session: at 9:27 AM ET a ratings agency saying a major share of planned data-centre capacity may face regulatory hurdles, a report that a large software company was increasing oversight of neocloud providers amid data-centre delays and costs, at 12:01 PM ET a 17 billion dollar data-centre investment by a search company, at 1:39 PM ET 31 billion dollars of orders for a consumer-hardware company's bond sale, and at 2:52 PM ET a request from lawmakers for a briefing from a chip designer's chief executive on links to China. These are reports carried by the feed. The calendars carry no results entry for the largest companies on Friday.
4.2 Semiconductor Cycle and Tech Sector Rotation
The semiconductor index closed at 9,011.14, down 12.25 percent, against the Nasdaq-100 cash index's 6.36 percent decline and the S&P 500's 4.36 percent. The Dow industrials fell 3.44 percent. Commentary carried by the news feed on the post-election policy outlook described a continuing rotation, and an investment-bank note carried by the feed described recent breadth as positioning-driven rather than a fundamental rotation; both are attributed commentary. The equities news feed carried at 9:57 AM ET an investment-bank cut to its price target for a chip-design licensor.
4.3 Fed Policy and Real Yields (Duration Sensitivity)
The ten-year yield index closed at 4.84 percent, down five basis points, and the dollar index at 101.55. The news feed carried at 9:24 AM ET a Federal Reserve official saying productivity gains reflected adaptation to labour shortages rather than artificial intelligence. Preliminary productivity was released at 8:30 AM ET on Thursday, November 5, 2026, as the calendar lists it, at 3.6 percent against a forecast of 2.7 percent, per the news-feed calendar. Yields fell while the contract fell, and no series here separates the effects.
4.4 Diplomacy Reports
The news feed carried a report on US and Iran diplomacy: a senior Iranian official saying a nuclear proposal had been sent to the US through an intermediary. This is a report carried by the feed, not an event confirmed here, and no move is attributed to it.
4.5 Cross-Asset and Volatility
The volatility index closed at 28.18, up 69.66 percent on the session. December crude rose 2.72 percent and gold 0.99 percent. The cash basis, the settle less the Nasdaq-100 cash close of 26,629.81, is 122.19 points, against 129.58 on Wednesday; both legs are completed-session daily records from the provider, read between 6:21 PM ET and 6:23 PM ET.
4.6 Institutional Positioning
No weekly positioning report figure is carried. Thursday's December volume was 1,242,866 contracts on the 2026-11-05 row of the provider's settlement record, against 1,004,813 on Wednesday's 2026-11-04 row, revised from the 980,905 carried in Thursday's outlook. Thursday's open interest is not yet reported; Wednesday's reads 285,573 on the 2026-11-04 row.
5. QQQ Options Flow Context (Proxy)
The dealer-positioning dataset used here, the edition timed 5:12 PM ET on Thursday, uses Wednesday's closes as its reference prices, not Thursday's: NDX 28,437 corresponds to Wednesday's 28,437.17 cash close and SPX 7,688 corresponds to Wednesday's 7,688.62. Wednesday's 28,437.17 less 1,807.36 points, a 6.36 percent decline, gives the provider's 26,629.81 Thursday close, and every level below is read against that close.
On the index the call side ceiling sits at NDX 29,675, the modeled gamma-flip level at NDX 28,579, the modeled volatility threshold at NDX 28,575 and both the largest gamma concentration and the put side support base at NDX 28,000. The close sits 3,045.19 points beneath the ceiling, 1,949.19 beneath the flip level, 1,945.19 beneath the threshold and 1,370.19 beneath the 28,000 base. The dataset's key strikes for NDX are 28,000, 29,000, 27,000 and 29,675, so the nearest, NDX 27,000, sits 370.19 above the close, and its NDX combination levels are 27,954, 27,527, 28,352 and 27,755. Gamma tilt reads 0.896 for NDX and 0.606 for QQQ, gamma notional minus 3.17 million dollars for NDX and minus 924.191 million for QQQ, and the 25-delta risk reversal minus 0.052 for NDX and minus 0.037 for QQQ, all model outputs; the QQQ figures are proxy readings. These levels were computed before Thursday's session from Wednesday's closes, and the dataset does not state how they shifted during the decline.
At the measured 122.19 point basis the NDX 27,000 key strike converts to 27,122.19, the NDX 28,000 base to 28,122.19 and the NDX 28,575 threshold to 28,697.19. The modeled threshold and flip level are model outputs, not option strikes.
The QQQ console, read at 6:18 PM ET, carried Wednesday's 691.82 as its previous close and a console price of 644.60, which is a console reading rather than Thursday's close. It lists the call side ceiling at 705, the put side support base at 680 and a secondary dealer level and largest gamma concentration at 700, and shows call gamma of minus 1.54 billion against put gamma of minus 2.54 billion, call volume of 1.39 million against put volume of 1.71 million, a put-to-call open-interest ratio of 1.2, one-month implied volatility of 22.22 percent against realised volatility of 22.24 percent, an implied-volatility rank of 50.17 percent and a skew rank of 82.40 percent, all proxy readings, with options volume carrying no direction here.
In this review's interpretation a close beneath every NDX level in the dataset leaves no NDX dataset reference beneath the price, so the levels in section 3.2 rest on published pivot arithmetic, standard-deviation bands and retracements, and the nearest NDX dataset reference overhead is the 27,000 key strike. Statements in the dataset about the order of intraday moves are not used; the session path in section 2.1 comes from the 30-minute futures series, and gamma is read as a damping lens with no direction.
6. Forecast
6.1 Night Session (6:00 PM ET Thursday to 3:00 AM ET Friday, Globex and Asia)
Globex reopened at 6:00 PM ET. Remarks by a Federal Reserve official at 7:00 PM ET on Thursday are listed by the news-feed calendar, unconfirmed. Bias lower beneath the Pivot Point at 27,330.17, expected band roughly 26,200 to 27,000.
6.2 London Session (3:00 AM to 8:00 AM ET Friday)
Remarks by a Federal Reserve official at 4:30 AM ET are listed by the news-feed calendar, unconfirmed. Bias lower to neutral beneath the 27,122.19 key-strike conversion, expected band roughly 26,300 to 27,100.
6.3 Morning Session (9:30 AM to 12:00 PM ET Friday, RTH Open)
The employment situation report is scheduled for 8:30 AM ET on Friday, November 6, 2026, as the calendar lists it, and the cash open at 9:30 AM ET is the first directional test after Thursday's decline. The preliminary consumer sentiment survey at 10:00 AM ET is listed by the news-feed calendar, unconfirmed. Expected band roughly 26,100 to 27,400, with the 27,280 to 27,320 setup band near the top.
6.4 Afternoon Session (12:00 PM to 4:00 PM ET Friday)
Remarks by the Federal Reserve vice chair for supervision are scheduled for 12:15 PM ET and consumer credit for 3:00 PM ET on Friday, November 6, 2026, as the calendar lists them. Expected band roughly 26,200 to 27,300 into the weekend.
6.5 Night Session Forward (6:00 PM ET Sunday reopen)
Globex reopens at 6:00 PM ET on Sunday, after two days of weekend headline risk on diplomacy. Chinese inflation data at 8:30 PM ET on Sunday is listed by the news-feed calendar, unconfirmed.
6.6 Expected Range (Friday Full Session)
Low-range scenario: 26,300 to 27,100; Mid-range scenario (most likely): 26,000 to 27,400; High-range scenario: 25,700 to 27,800.
6.7 Most Likely Path
In this review's analyst judgment, the most probable path holds the contract between Pivot S1 at 25,991.83 and the Pivot Point at 27,330.17, with a rebound toward the 27,122.19 conversion and the 27,280 to 27,320 band that stalls beneath the Pivot Point at 27,330.17 weighted above a recovery through it. The composite reads "88% SELL" with direction "Strongest", negative direction leads on both directional systems and the settle sits beneath every settlement average, while the 9-day relative strength at 22.06 and raw stochastics at 5.04 percent describe a contract that is stretched after a 1,814.75 point decline, which in this review's interpretation favours a rebound attempt that is sold rather than an immediate extension.
The alternative that would invalidate this reading is a settle above one standard deviation resistance at 27,503.21, which would bring Pivot R1 at 28,090.33 into play. On the other side, a move beneath the 26,404.22 target price before any rebound would bring Pivot S1 at 25,991.83 into play without the rebound the setup needs; a deeper correction toward Pivot S2 at 25,231.67 is the worst-case scenario in this review's judgment.
7. Friday Economic Calendar
Thursday's releases are complete. Preliminary productivity and costs were released at 8:30 AM ET on Thursday, November 5, 2026, as the calendar lists it, with productivity at 3.6 percent against a forecast of 2.7 percent and unit labour costs at minus 0.7 percent against a forecast of 0.4 percent, per the news-feed calendar. Weekly jobless claims of 189 thousand against a forecast of 196 thousand were listed by the news-feed calendar, unconfirmed against the calendar.
On Friday, November 6, 2026, the employment situation report is scheduled for 8:30 AM ET, remarks by the Federal Reserve vice chair for supervision for 12:15 PM ET and consumer credit for 3:00 PM ET, as the calendar lists them. The preliminary consumer sentiment survey at 10:00 AM ET and remarks by a Federal Reserve official at 9:10 AM ET are listed by the news-feed calendar, unconfirmed.
Next week, the consumer price index is scheduled for 8:30 AM ET on Tuesday, November 10, 2026 and the producer price index for 8:30 AM ET on Friday, November 13, 2026, as the calendar lists them. In this review's judgment the first-order influence on the contract for Friday is the 8:30 AM ET employment report and the reaction at the 9:30 AM ET cash open, after a session in which semiconductors led the decline.
8. Primary Trade Setup
Direction: Short
Rationale: The contract settled at 8.7 percent of the widest range in the settlement series, beneath every settlement average, the composite reads "88% SELL" with direction "Strongest" and negative direction leads on both directional systems. A rebound into the 27,280 to 27,320 band, beneath the Pivot Point at 27,330.17 and the 27,358.00 rebound high, offers a short with a defined risk point above that high. Oscillators are stretched after a 1,814.75 point decline and a rebound can run through the band after the 8:30 AM ET report, so the setup is an analyst judgment that rebounds into the Pivot Point are sold, not a measured edge.
Entry Zone: 27,280 to 27,320
Stop Loss: 27,460 (above the 27,358.00 rebound high and beneath one standard deviation resistance at 27,503.21)
Target 1 (T1): 27,140 (above the 27,122.19 key-strike conversion)
Target 2 (T2): 26,980 (beneath the 27,034.38 relative-strength projection)
Target 3 (T3, extended): 26,820 (above the 26,814.18 oscillator stall)
Risk-to-Reward: Approximately 1:1 to T1, 1:2 to T2, 1:3 to T3
Invalidation: A settle above one standard deviation resistance at 27,503.21 negates the thesis. Short of that, the edge is removed by acceptance above the entry band and not by a touch, defined as two consecutive 30-minute closes above 27,320.
Macro override: Two scenarios could lift the contract: a softer employment report that pulls yields lower, or a rebound in semiconductors. In either scenario a move through the 27,460 stop invalidates the short before the targets, and one standard deviation resistance at 27,503.21 becomes the reference, 43.21 beyond the stop and well inside one 14-day average true range of 770.03.
Sources and methodology
This outlook is built from our session review of the December E-mini Nasdaq-100 contract, the December ’26 contract, prepared after Thursday's close on November 5, 2026 for the Friday, November 6, 2026 session; its setup is the review's as published at the settle. Thursday's open, high, low and settle come from the provider's daily settlement record for the December contract, the 2026-11-05 row, and match the chart's completed daily bar; the partial 2026-11-06 row of the reopened Friday session is excluded from every count and average and is not quoted, nor is the reopened session's range. Thursday's session opened at the Wednesday 6:00 PM ET reopen. The overview's open, high and low already belong to the session that reopened at 6:00 PM ET on Thursday, so Thursday's range comes from the settlement record and the published pivot ladder: Pivot R3 at 30,188.83 less Pivot S3 at 23,893.33, divided by three, and Pivot R2 at 29,428.67 less Pivot S2 at 25,231.67, divided by two, both return 2,098.50, and three times the 27,330.17 Pivot Point less the settle gives 55,238.51, the sum of the 28,668.50 high and the 26,570.00 low within published rounding. Every time of day given for Thursday's prices comes from the 30-minute series for Thursday's session, which starts at the Wednesday 6:00 PM ET reopen, read as Eastern standard-time clock labels. Thursday's card was set at Wednesday's settle, so it is scored over the whole Thursday session from the 6:00 PM ET reopen; where two levels traded in the same 30-minute bar, the order inside that bar is not asserted. Session windows are scored over the bars that open inside each window.
The moving averages are the review's, computed from the provider's daily settlement series for the December contract, 259 completed sessions, and rounded once to the 0.25 tick; 47 of the 200 sessions in the 200-day window carry no recorded volume. The oscillators and the average true and daily ranges are cited as published, read at 6:25 PM ET on Thursday after the Globex reopen. Volume and open interest come from the provider's daily record: the 2026-11-05 row reads 1,242,866 contracts, and Thursday's open interest is not yet reported; the 2026-11-04 row now reads 1,004,813 contracts and open interest of 285,573, where Thursday's outlook carried 980,905 contracts and open interest not yet reported; the 2026-11-03 row reads open interest of 290,046. No weekly positioning report figure is carried. The dealer-positioning dataset carries Wednesday's closes in its reference column, and its levels were computed before Thursday's session; every Nasdaq futures conversion is the review's, at the 122.19 point measured basis, the December settlement less the cash close, against 129.58 on Wednesday. The QQQ fund is a proxy read alongside the index levels. Its levels and gamma figures, like the index model's, are model outputs; gamma is read as a damping lens with no direction, and options volume carries no direction. The fund console was read at 6:18 PM ET. Company items and reports are described per the news feed with generic descriptions; the investment-bank note and the commentary carried by the news feed on the post-election policy outlook are attributed commentary, and no move is attributed to them. Cross-asset moves are reported side by side, and none is presented as the cause of another. The volume and open-interest changes, the session-window highs and lows and the distances in this article are computed. Scenario ranges are analyst judgment, and items marked unconfirmed come from the news-feed calendar.
Thursday’s outlook for this contract is here, and the S&P 500 contract’s Thursday outlook covers the index that fell 4.36 percent in cash on Thursday. Outlooks for ES, NQ, GC and CL are collected on the market outlook page, and our forward trading record is on the performance statement.
Monday’s follow-up outlook for Nasdaq-100, written after Friday’s close, is here.