
Market Outlook
Short-cycle tactical market commentary, daily and weekly views, level-specific setups.
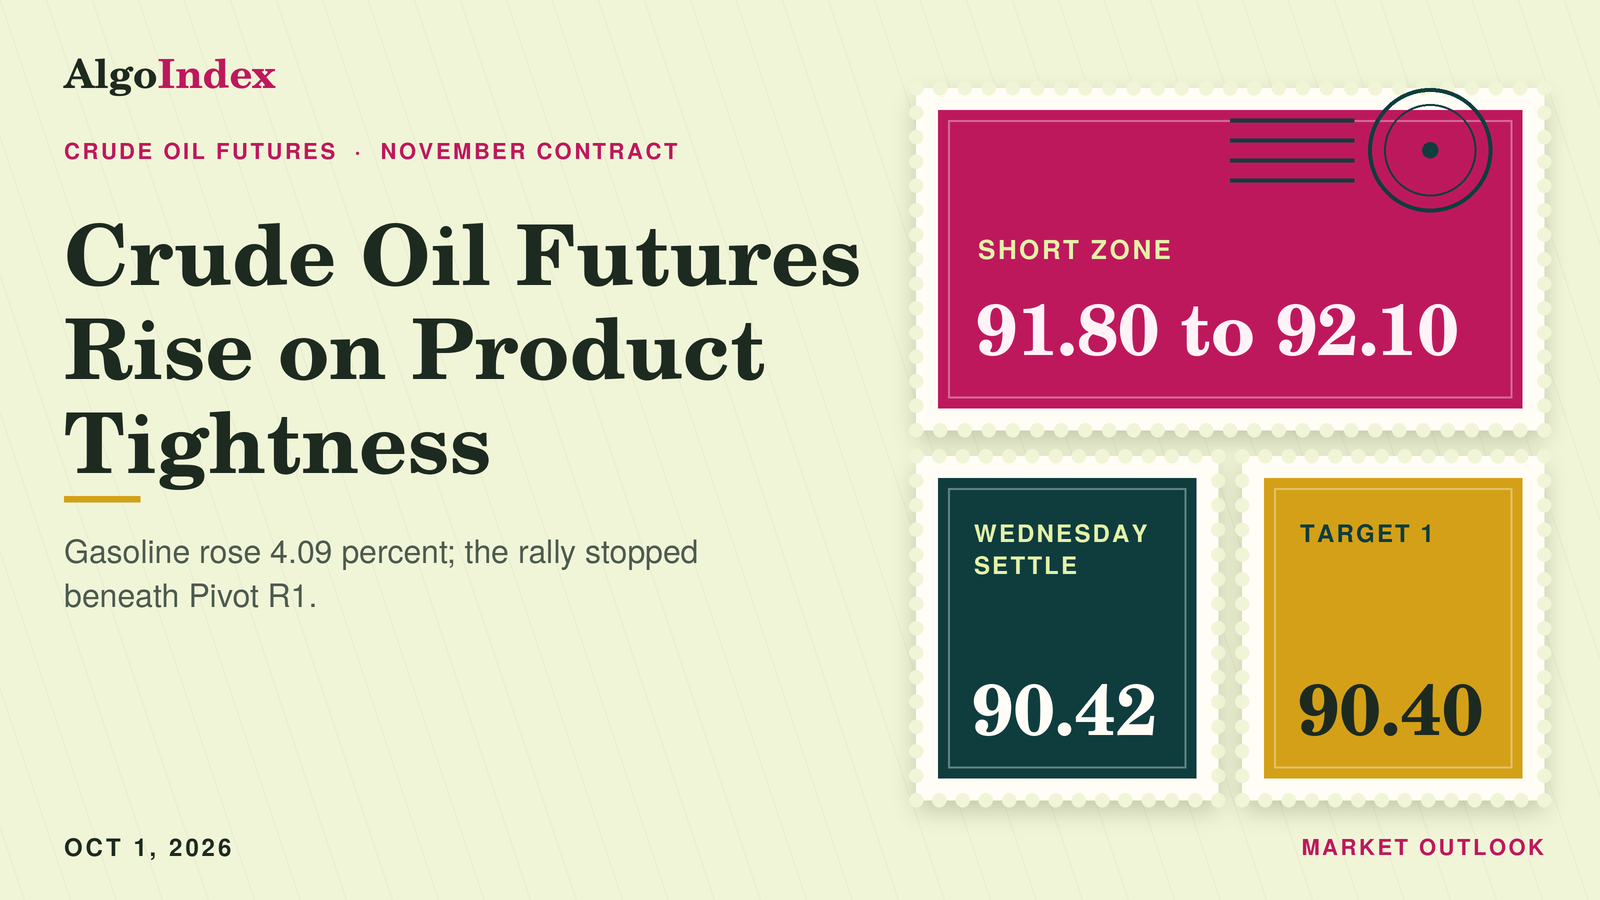
Crude Stalls at 91.96 Under Pivot R1, Short From 91.80
November WTI rose 1.16 percent to 90.42 after a 91.96 high stalled ten cents under Pivot R1. Levels, the 91.80 short and Thursday's manufacturing survey.
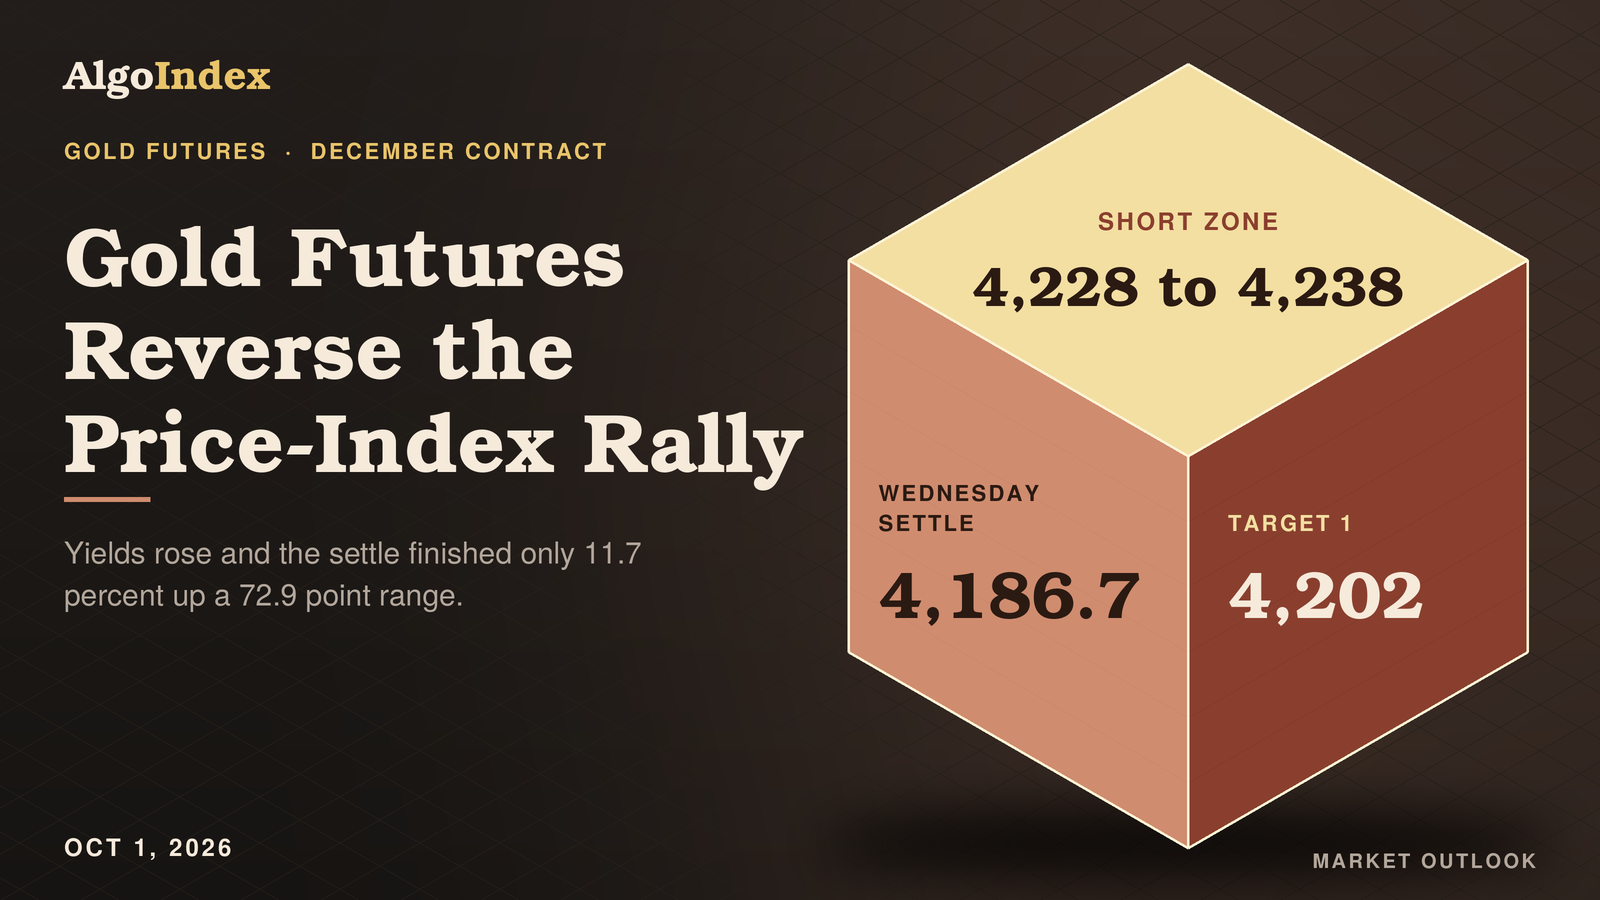
Gold Futures Give Back a 4,251.1 Rally, Settle at 4,186.7
December gold reached 4,251.1 in the price-index bar, then settled at 4,186.7 near the day's low. Levels, the 4,228 to 4,238 short and Thursday's risks.
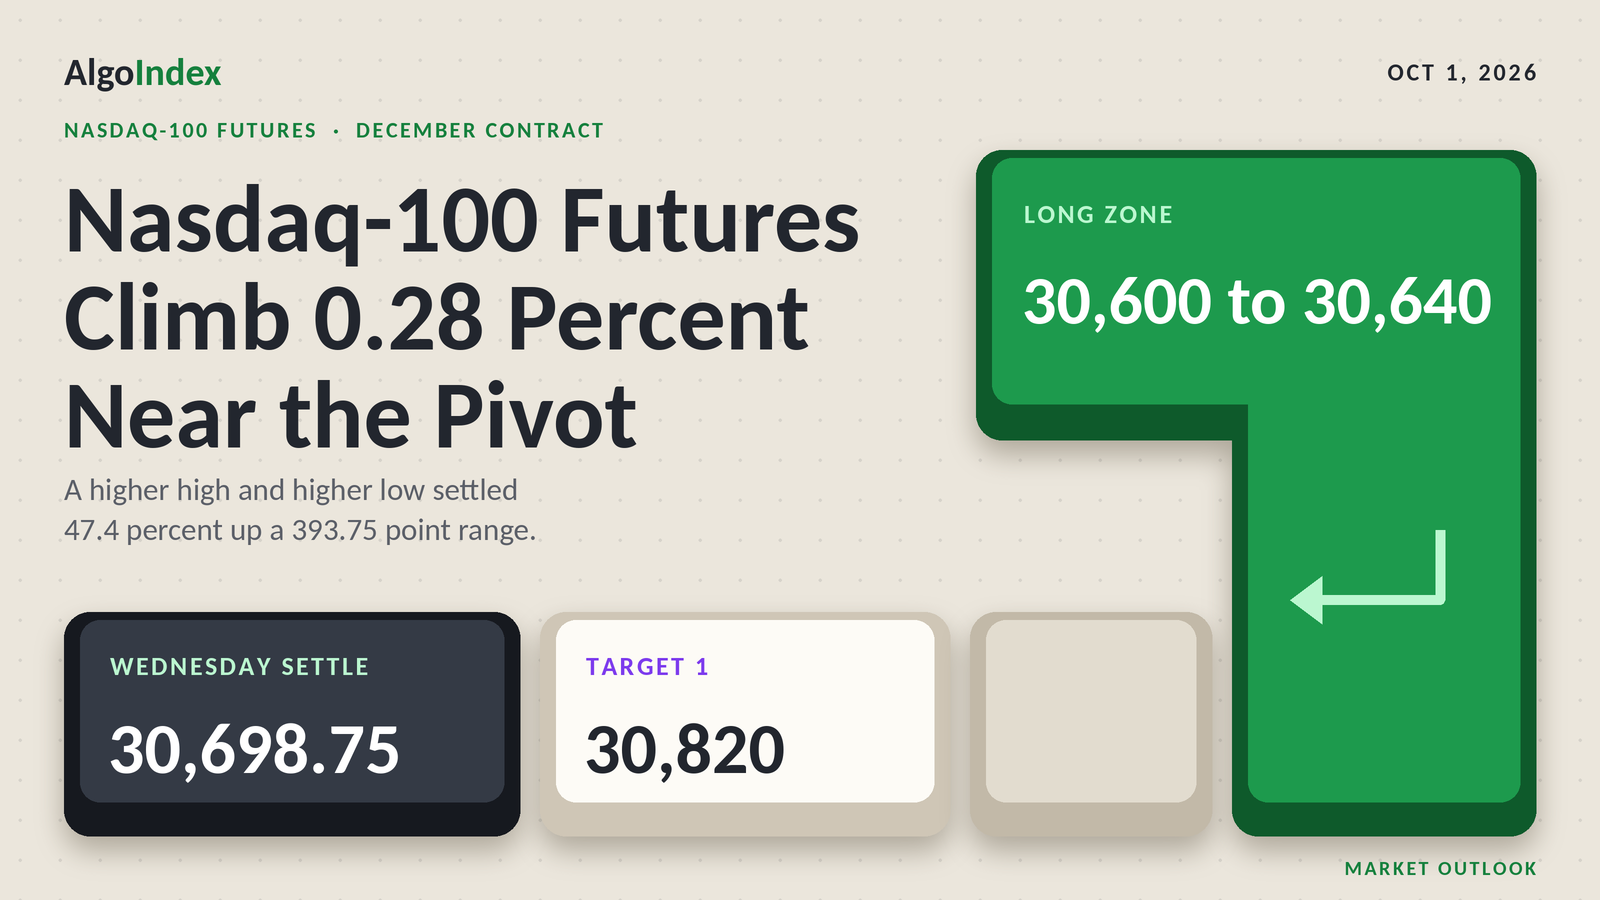
Nasdaq-100 Futures Settle at 30,698.75 After a Late Fade
December Nasdaq-100 futures settled at 30,698.75, up 0.28 percent, after a 177.50 point late fade. Levels, the 30,600 to 30,640 long and Thursday's survey.
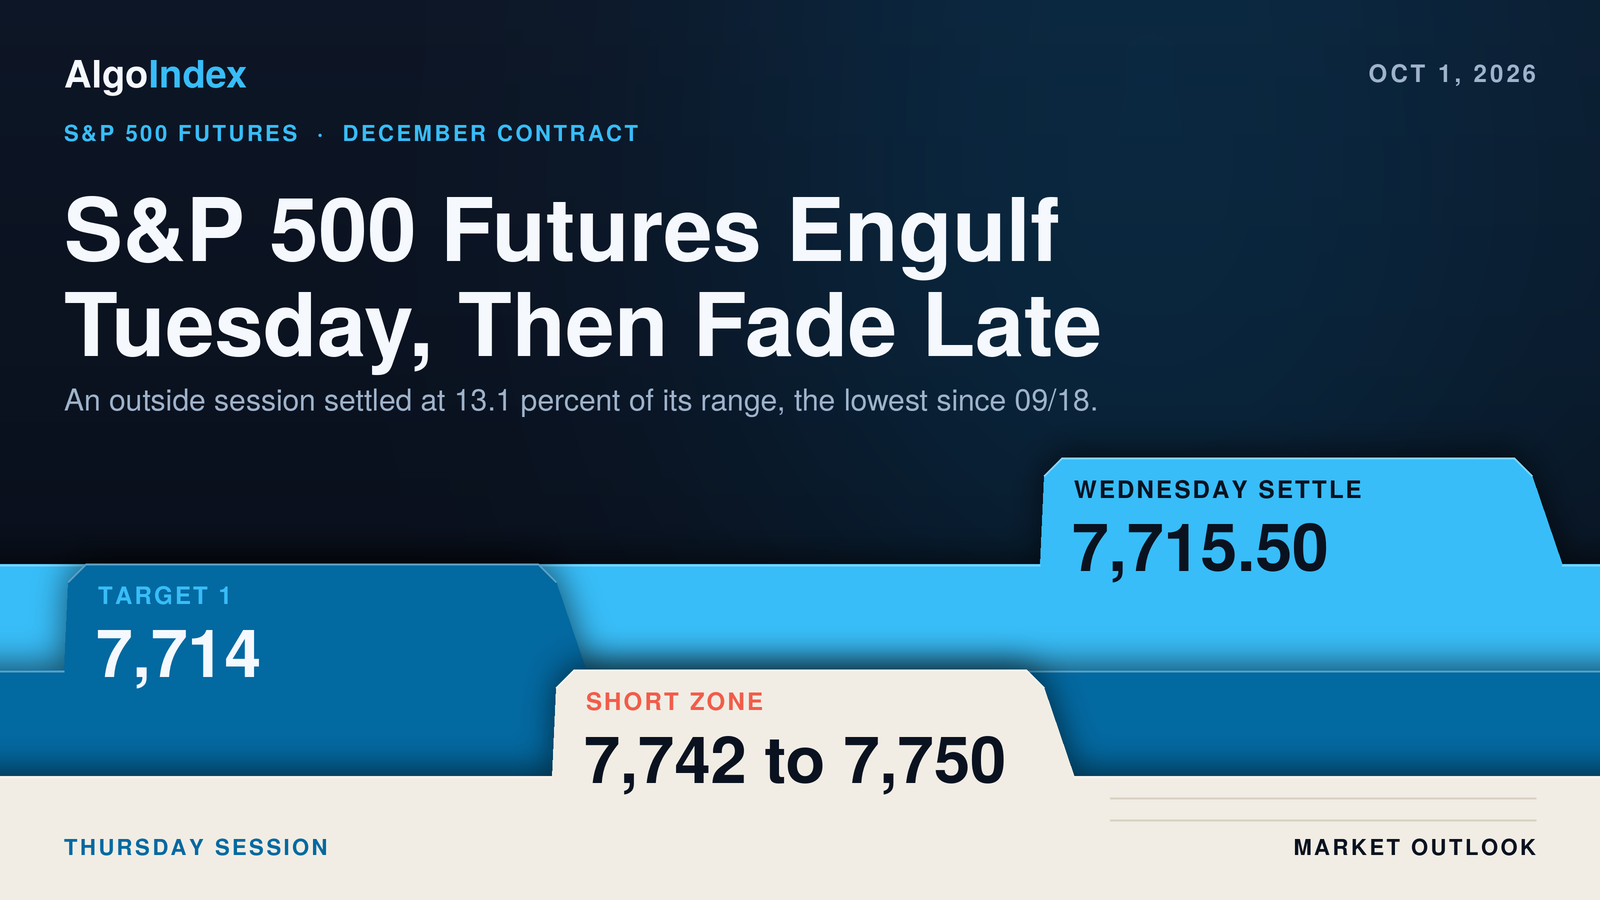
S&P Futures 7,715.50: Short 7,742 to 7,750 Under 7,778
December S&P futures settled at 7,715.50 after an outside day and a late fade. Levels, the 7,742 to 7,750 short and Thursday's manufacturing test.
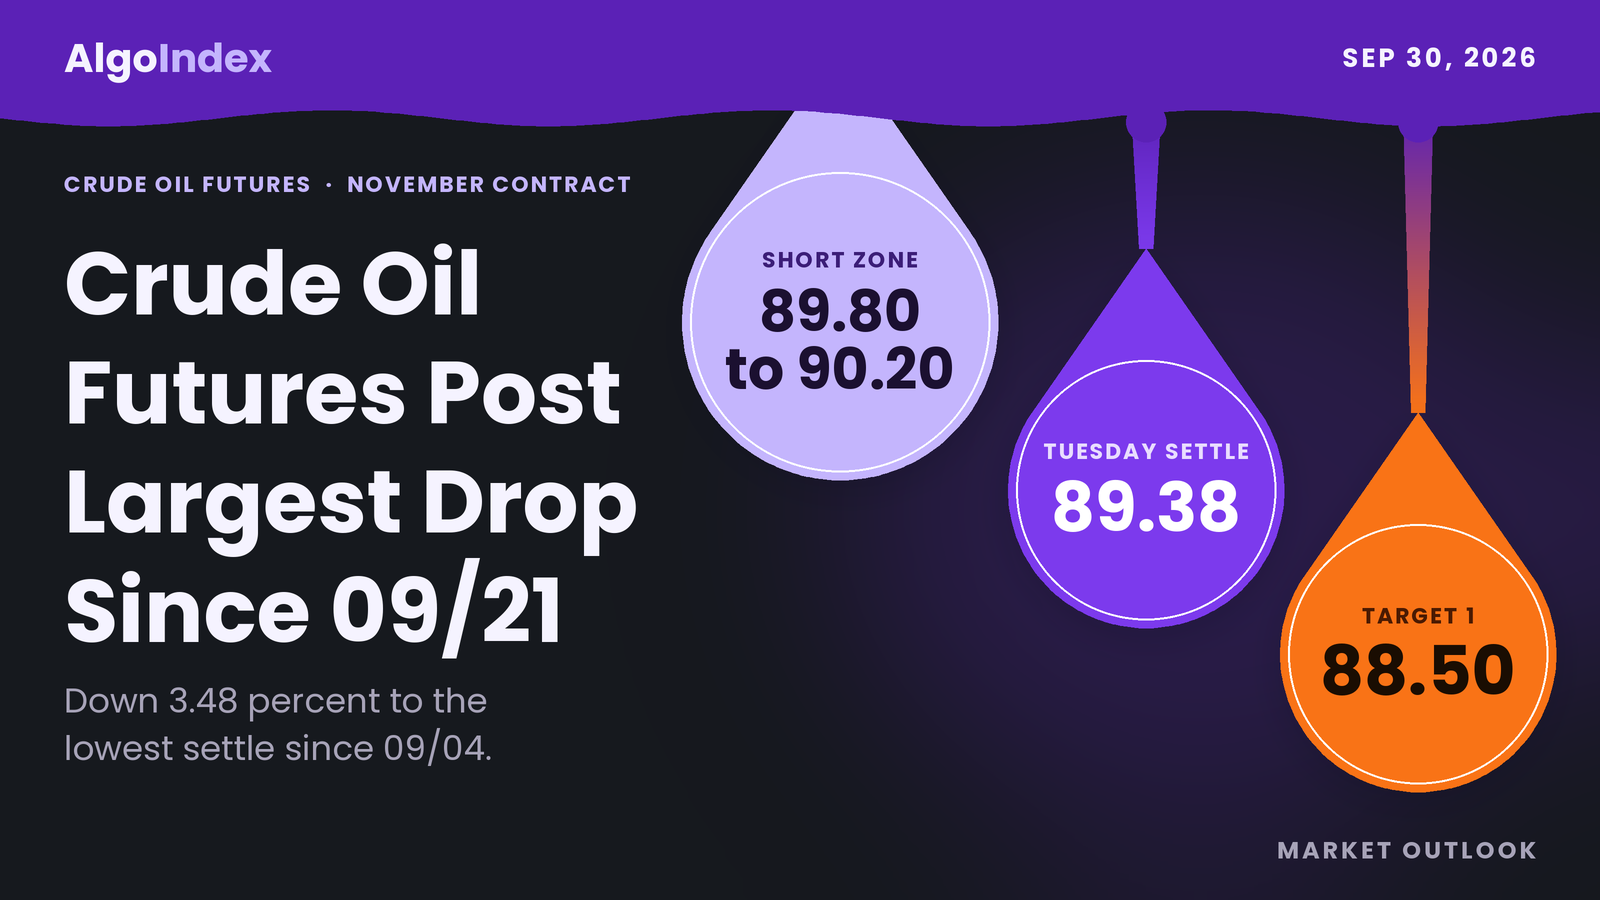
Crude Settles 89.38 on a Reserve Release, Short From 89.80
November WTI fell 3.48 percent to 89.38 after a 94.74 to 88.78 day, beneath the 90.52 swing settle. Levels, the 89.80 short and Wednesday's inventory report.
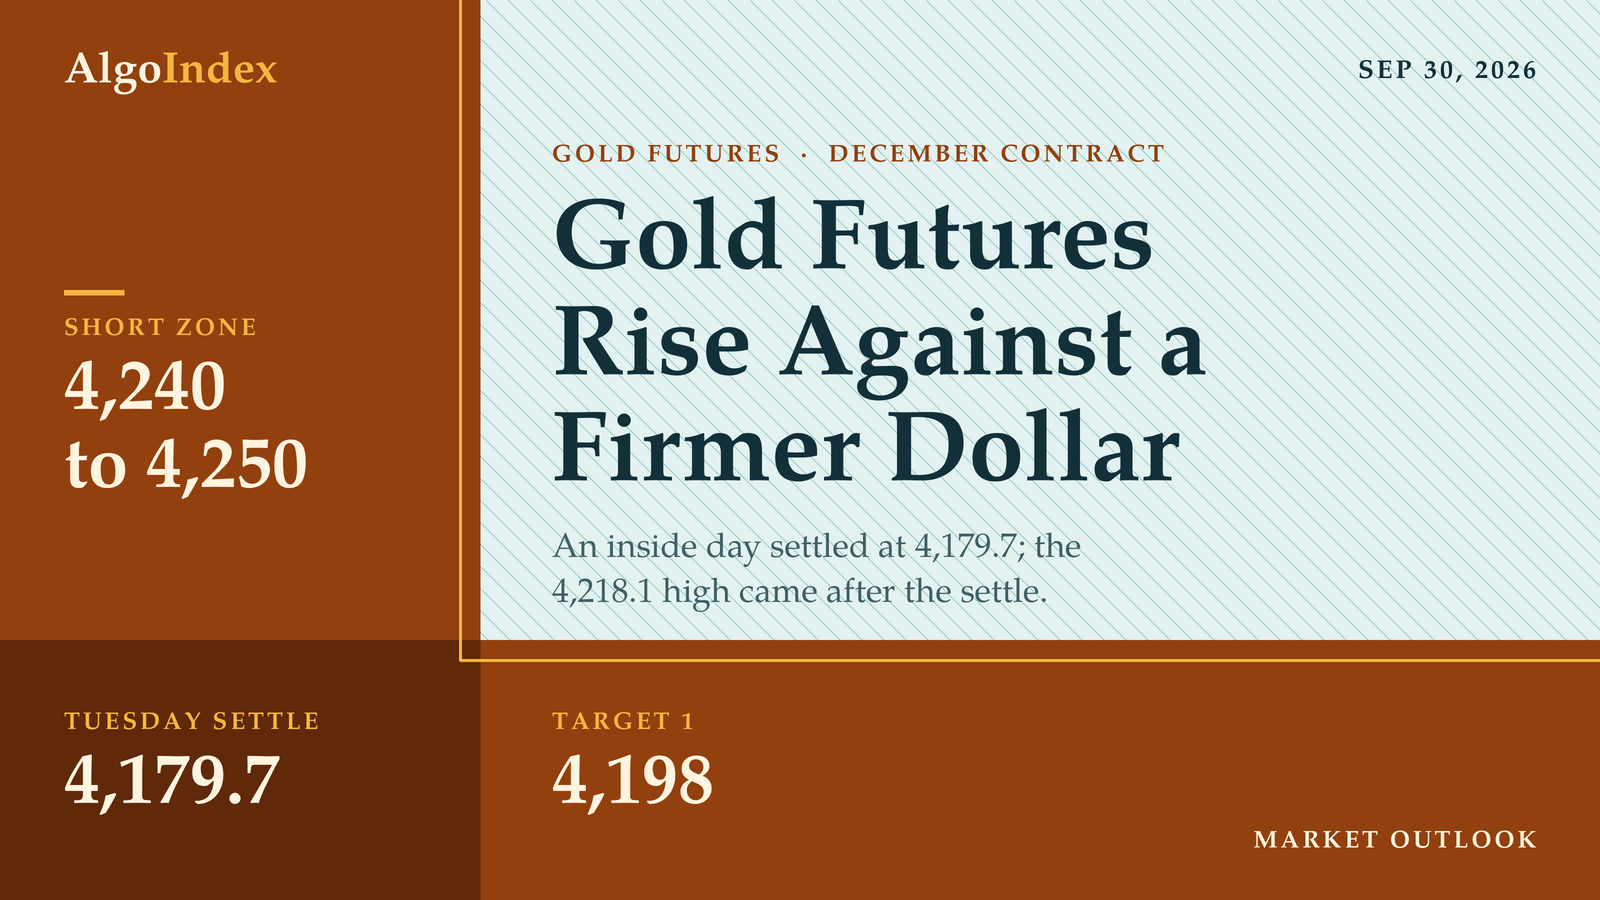
Gold Futures Rise to 4,179.7 Against a 5.29 Percent Yield
December gold settled at 4,179.7, up 0.27 percent, against a 5.29 percent ten-year yield high. Levels, the 4,240 to 4,250 short and the price-index risk.
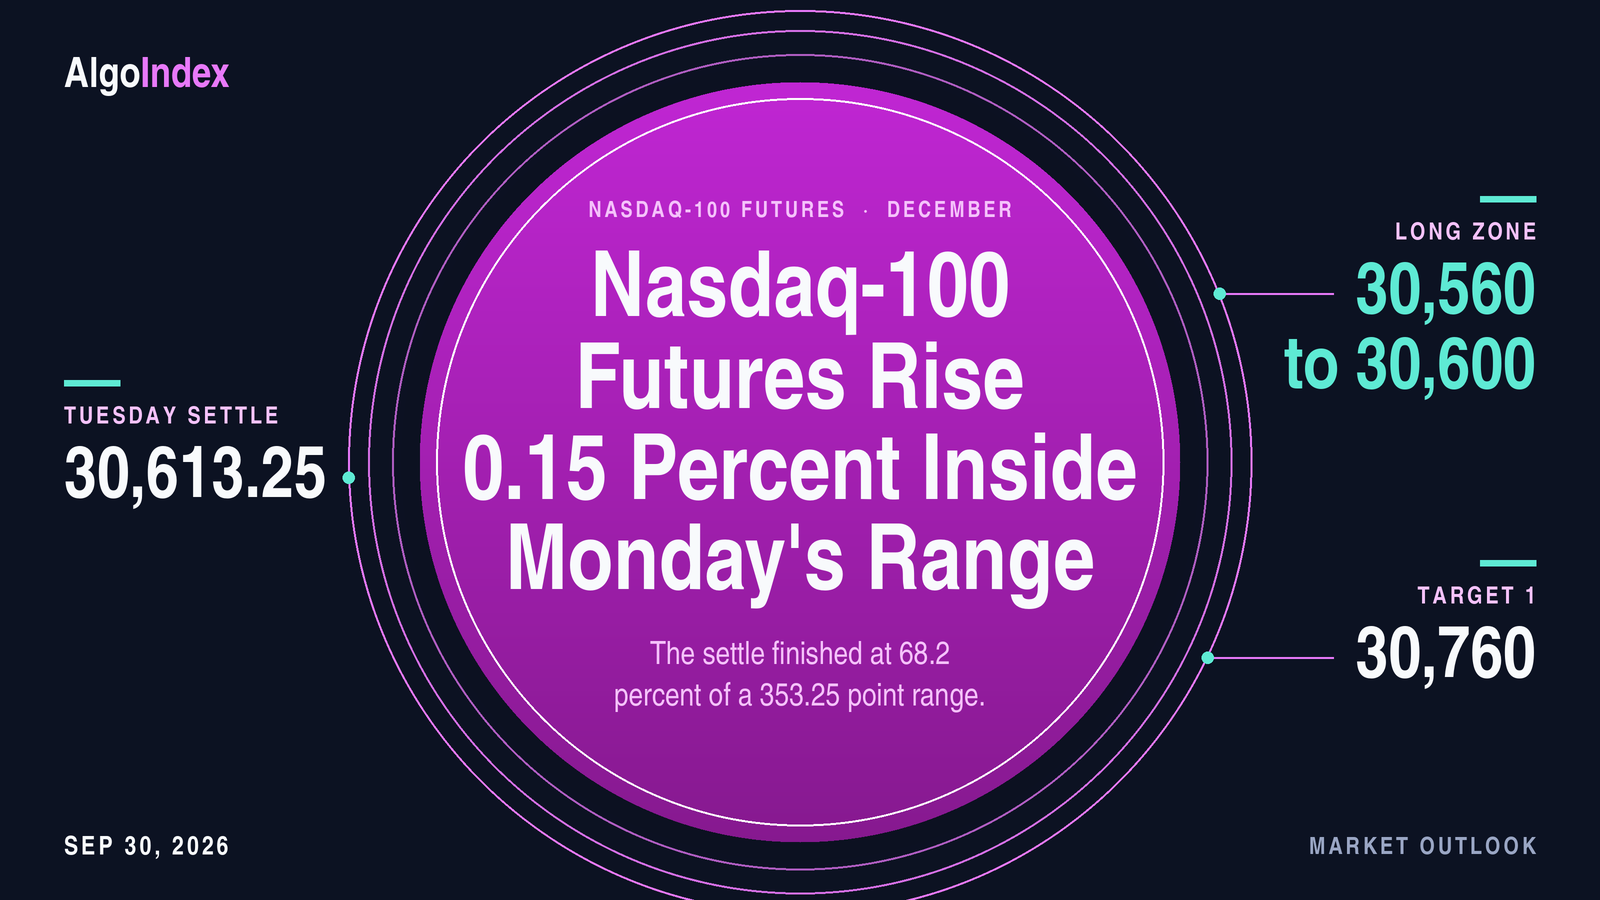
Nasdaq-100 Futures Settle at 30,613.25 After an Inside Day
December Nasdaq-100 futures settled at 30,613.25 inside Monday's range as chips rose 1.32 percent. Levels, the 30,560 to 30,600 long and the price-index report.
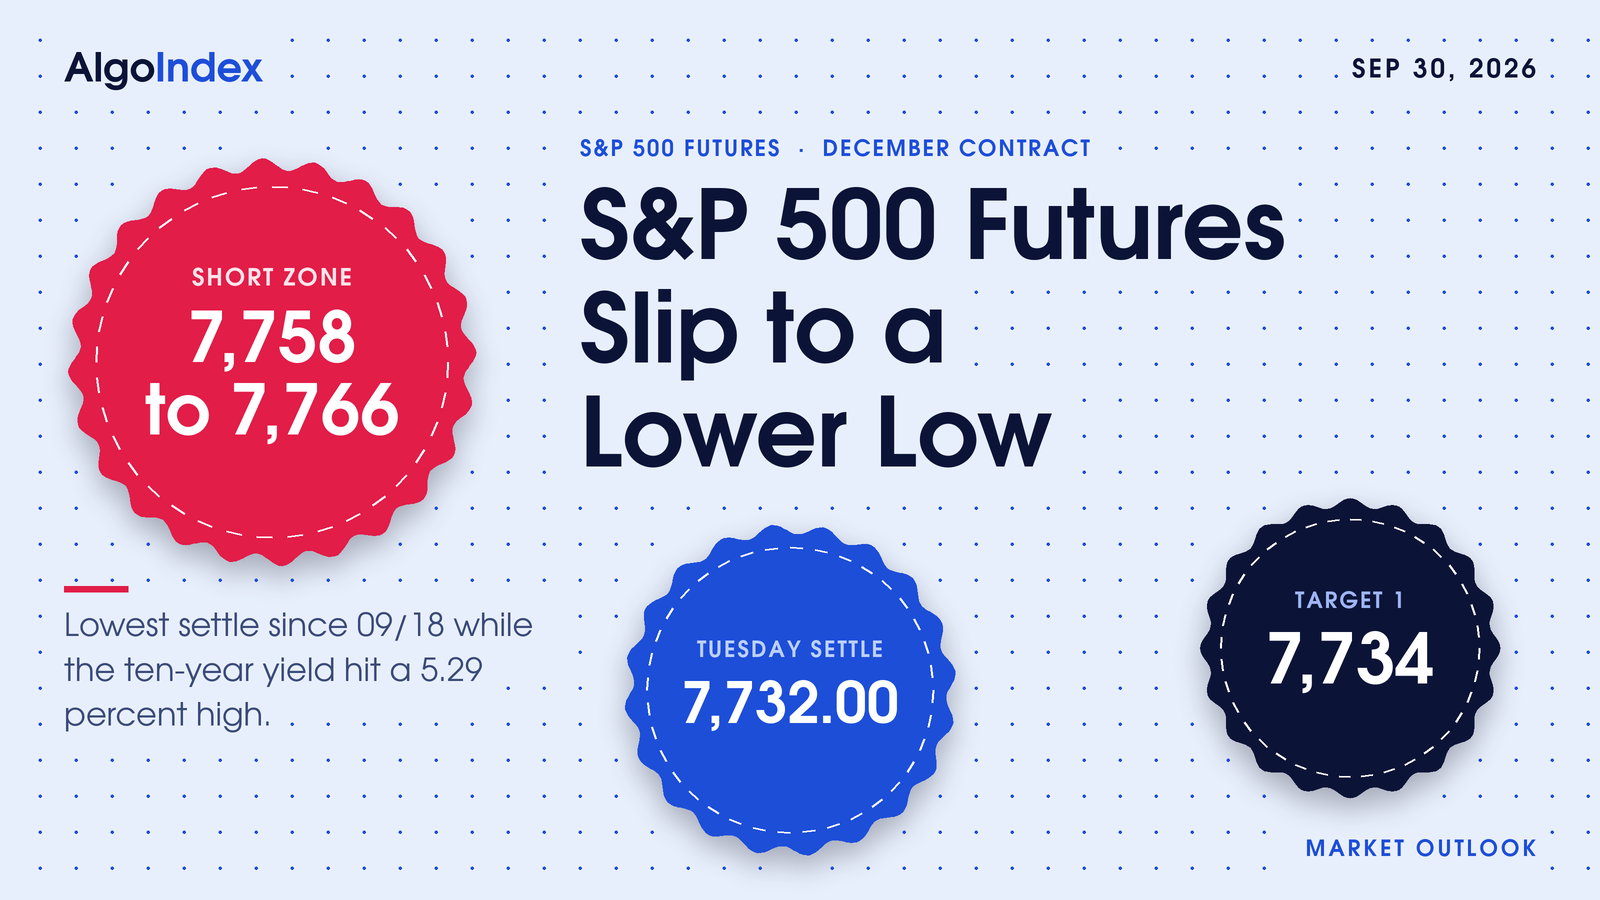
S&P Futures 7,732.00: Short 7,758 to 7,766 Under 7,790
December S&P futures settled at 7,732.00 as the ten-year printed 5.29 percent. Levels, the 7,758 to 7,766 short and Wednesday's price-index test.
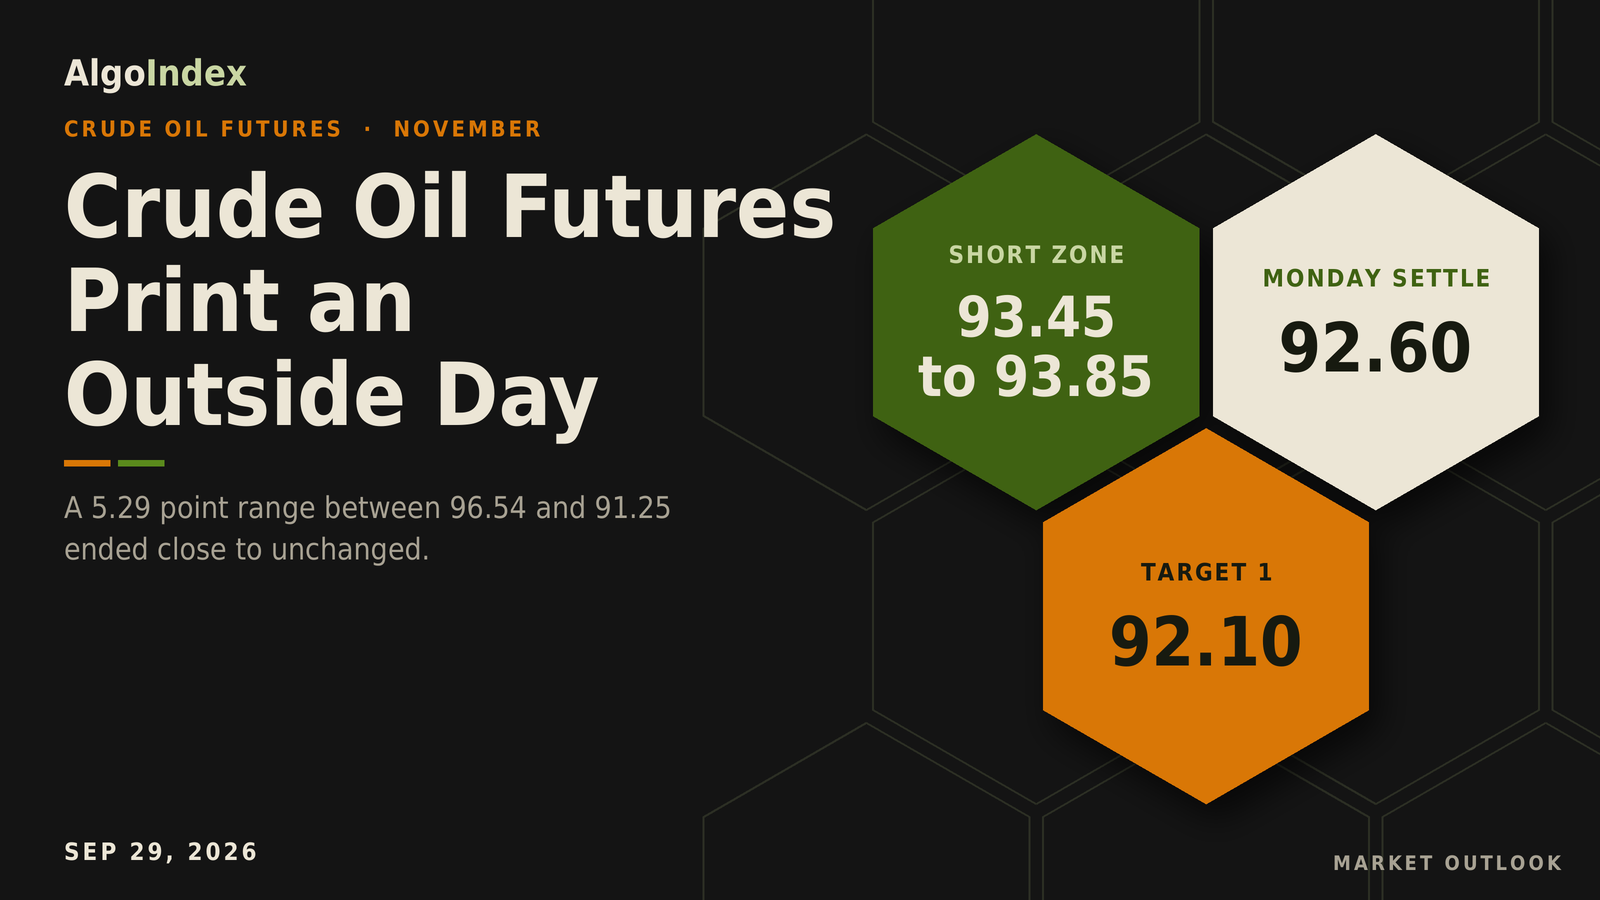
Crude Settles 92.60 After an Outside Day, Short From 93.45
November WTI settled 92.60 after a 96.54 to 91.25 outside day on swinging Iran headlines. Levels, the 93.45 short and the 93.32 to 93.96 cap.
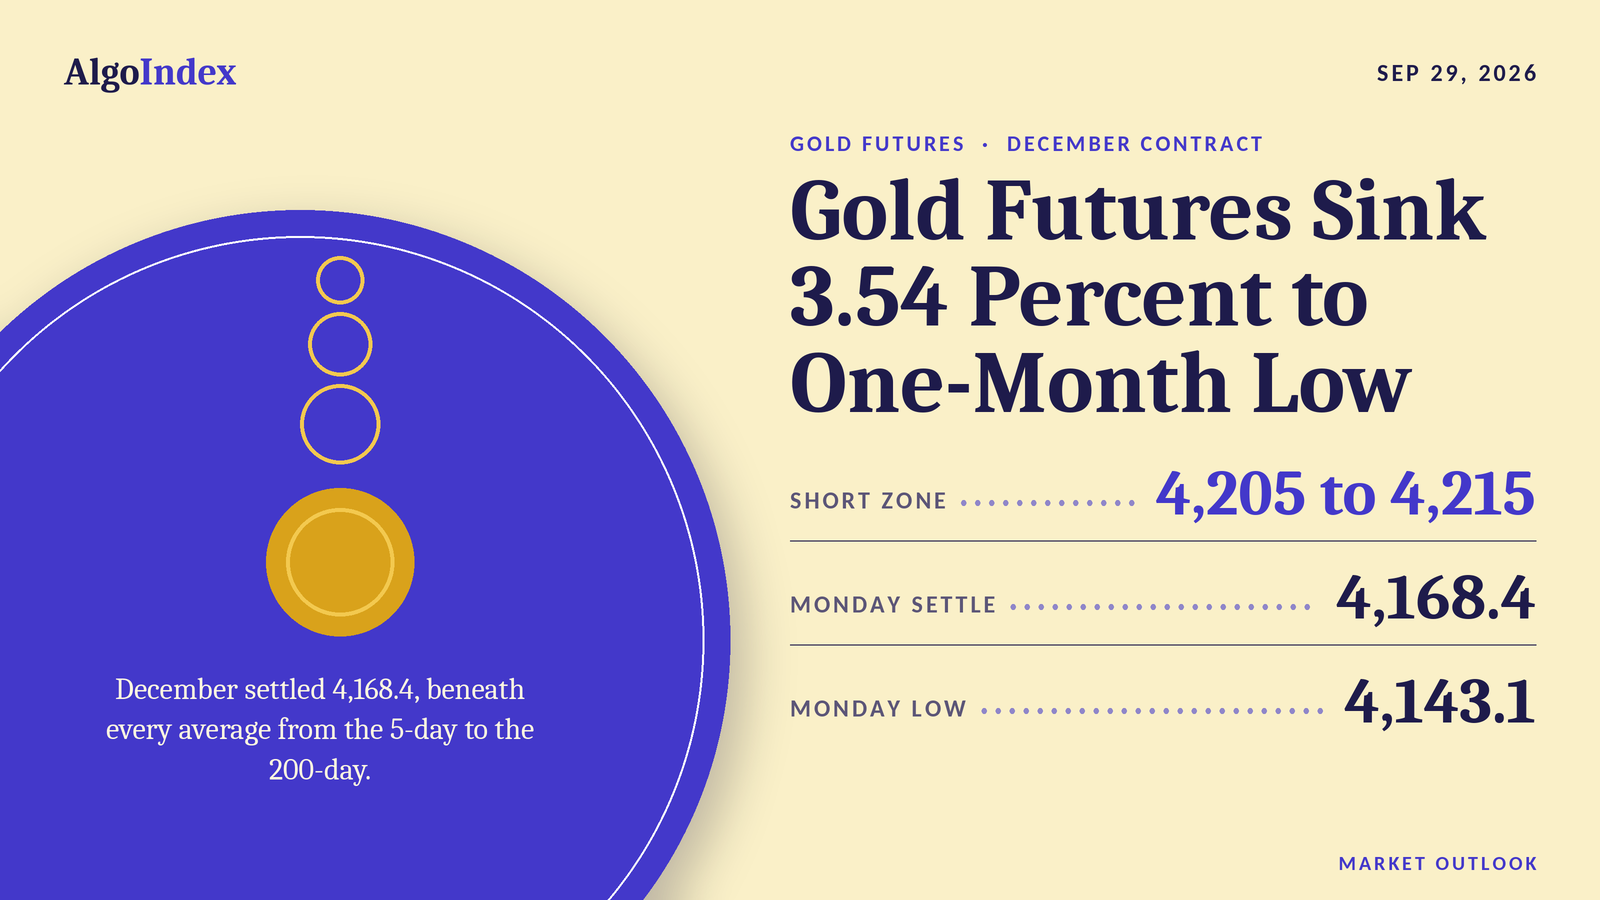
Gold Futures Sink 152.8 Points to 4,168.4 as Yields Climb
December gold settled at 4,168.4, down 3.54 percent, as the ten-year yield hit 5.27 percent. Levels, the 4,205 to 4,215 short and Tuesday's data risk.
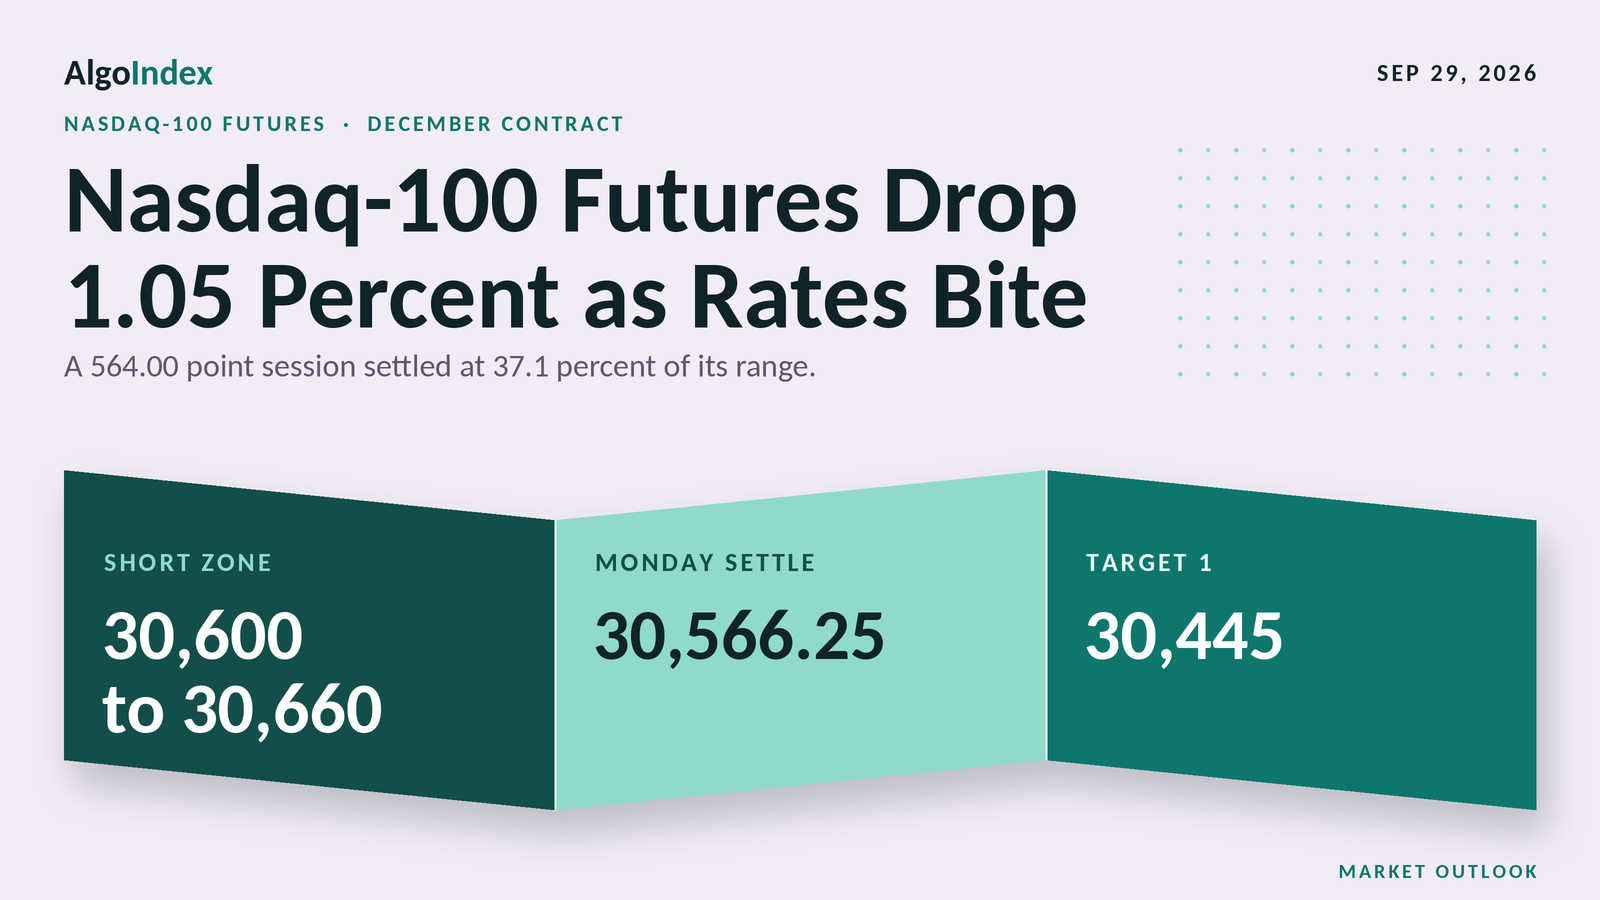
Nasdaq-100 Futures Fall 323 Points to 30,566.25
December Nasdaq-100 futures settled at 30,566.25 as the ten-year hit 5.27 percent. Levels, the 30,600 to 30,660 short and Tuesday's job openings data.
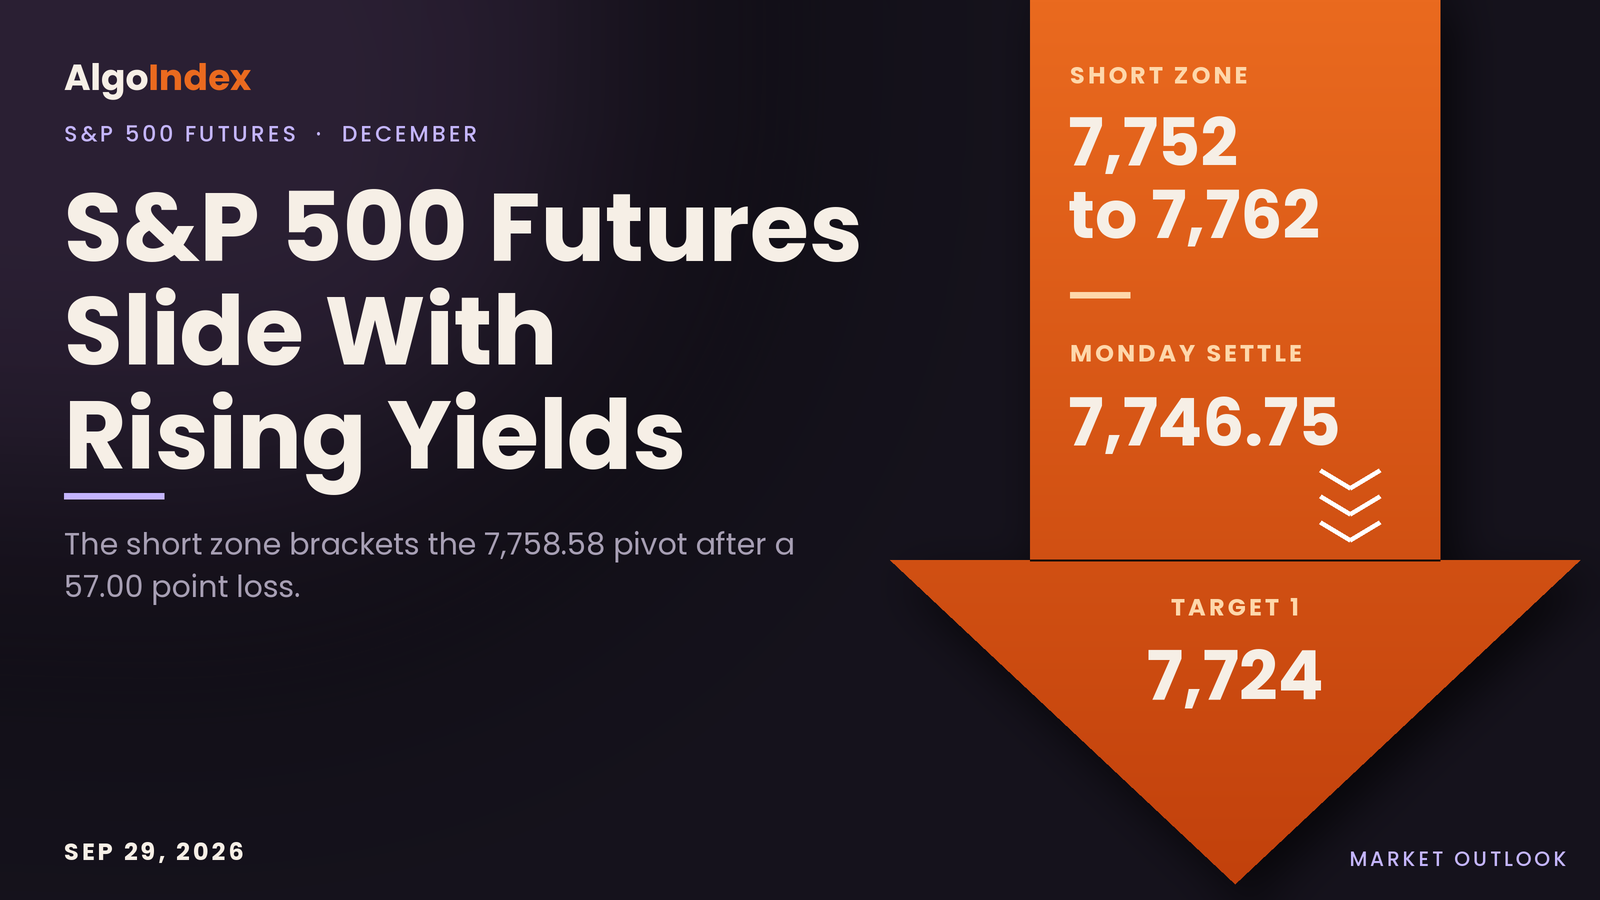
S&P Futures 7,746.75: Short 7,752 to 7,762 Under 7,790
December S&P futures fell 57.00 points to 7,746.75 as the ten-year printed 5.27 percent. Levels, the 7,752 to 7,762 short and Tuesday's job openings test.
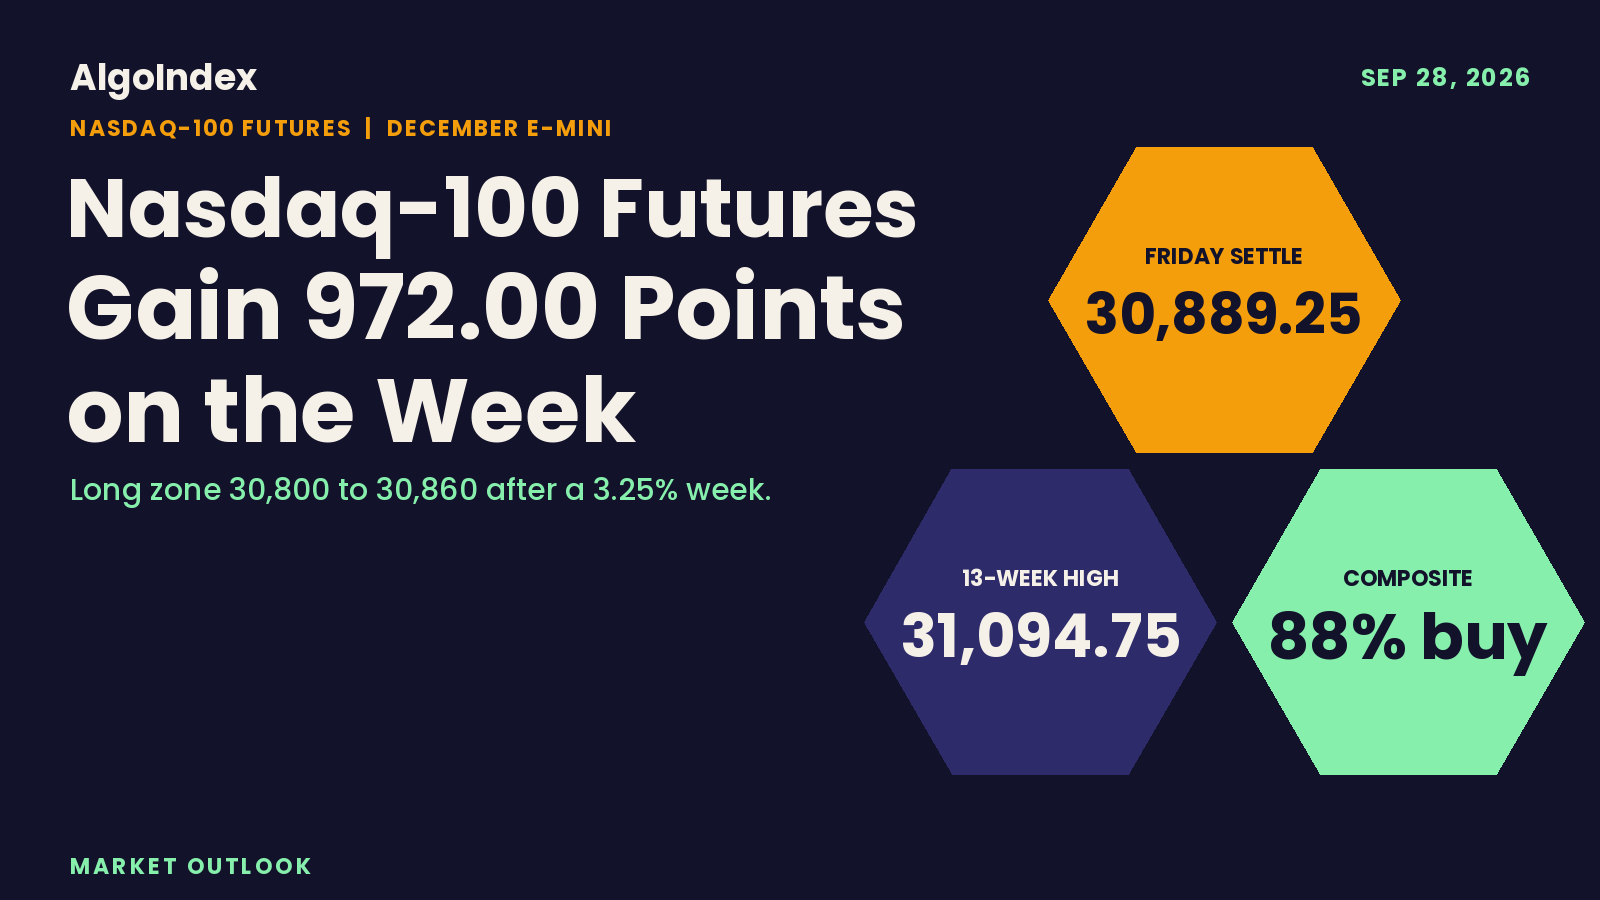
Nasdaq-100 Futures: 30,889.25 Settle, 30,855.92 Pivot Long
December Nasdaq-100 futures settled 30,889.25 after a 972-point week, 205.50 under the 13-week high. Levels, the 30,800 to 30,860 long and Monday's calendar.
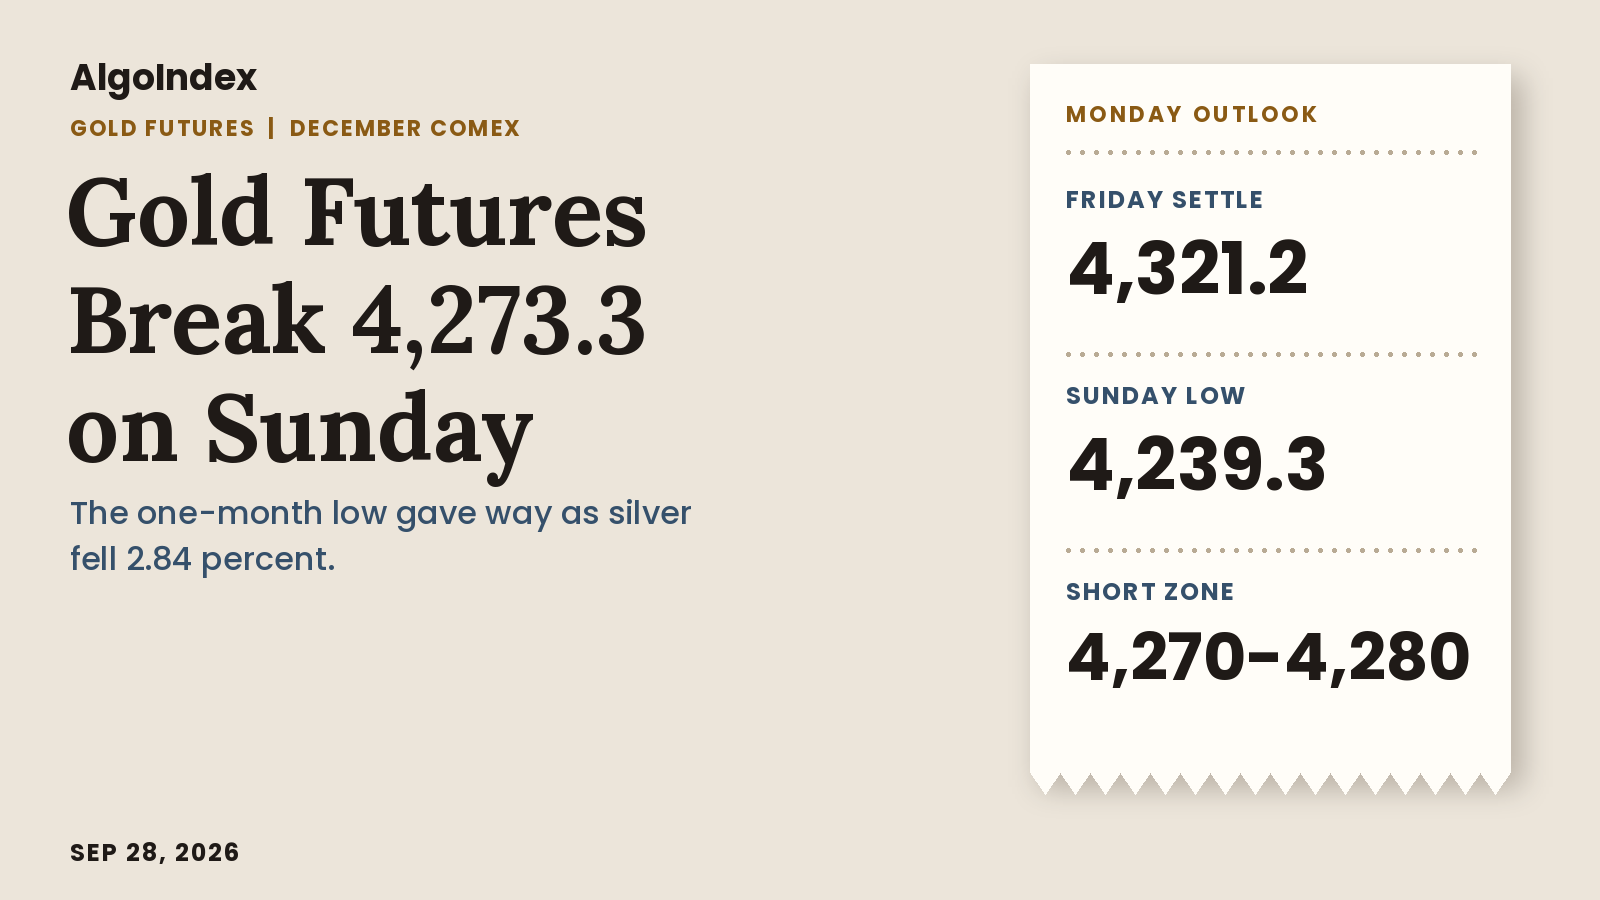
Gold Futures: 4,321.2 Settle, Sunday Break, 4,270 Short
December gold settled 4,321.2, then broke to 4,239.3 on Sunday through the 4,273.3 one-month low. Levels, the 4,270 to 4,280 short and Monday's calendar.
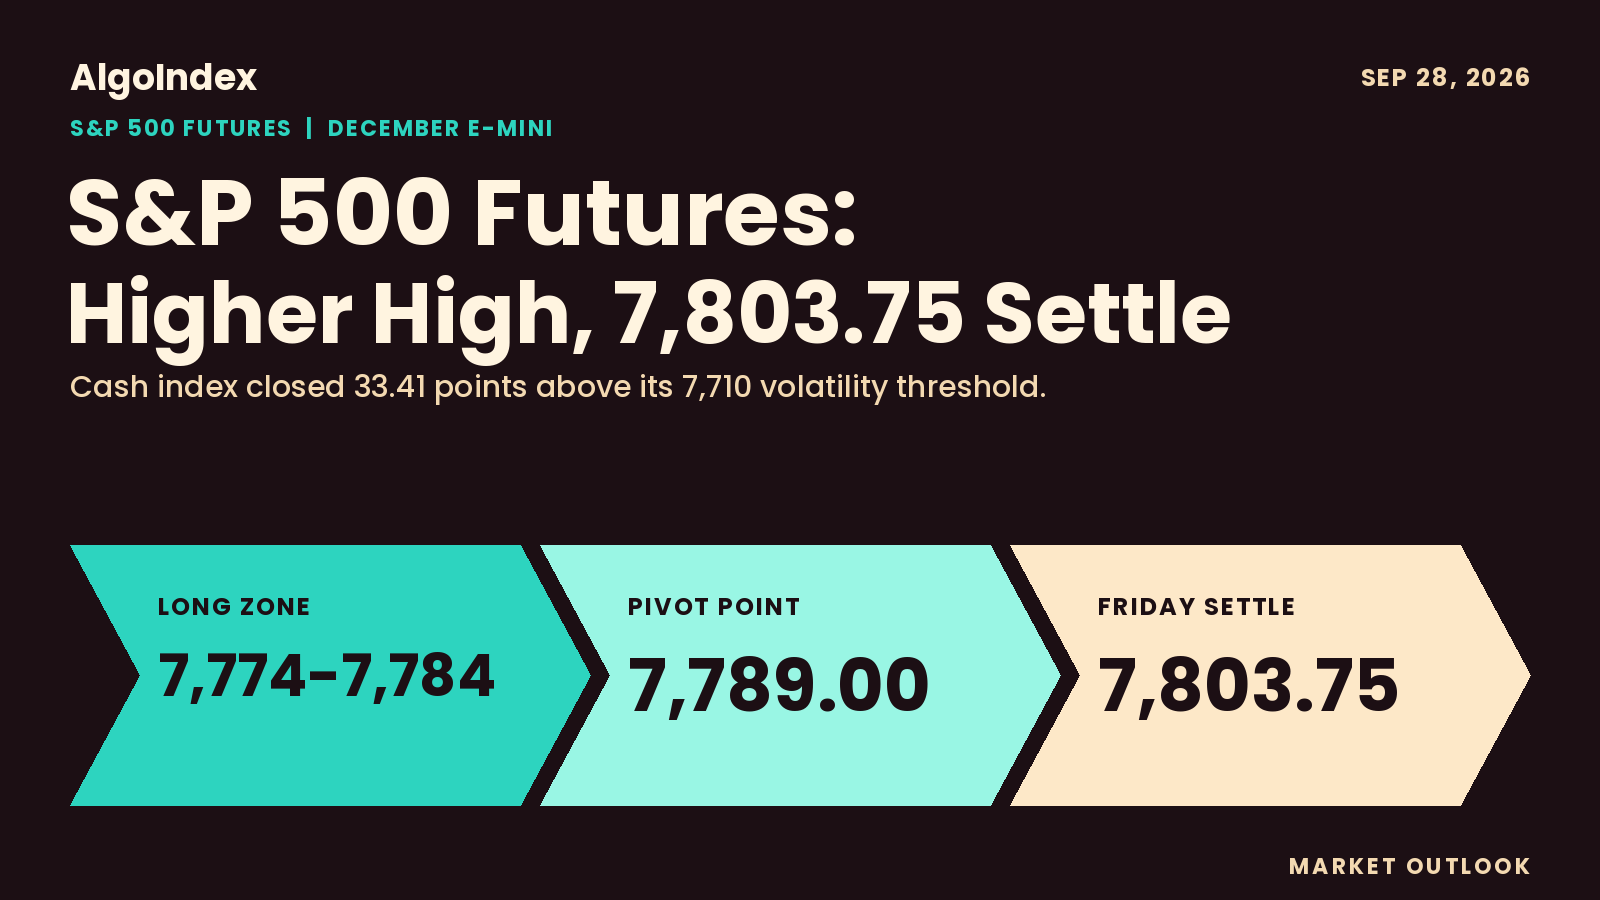
S&P 500 Futures: 7,803.75 Settle, 7,789.00 Pivot Long
December S&P futures settled 7,803.75 with a higher high and higher low as the ten-year closed at 5.18 percent. Levels, the 7,774 long and Monday's calendar.
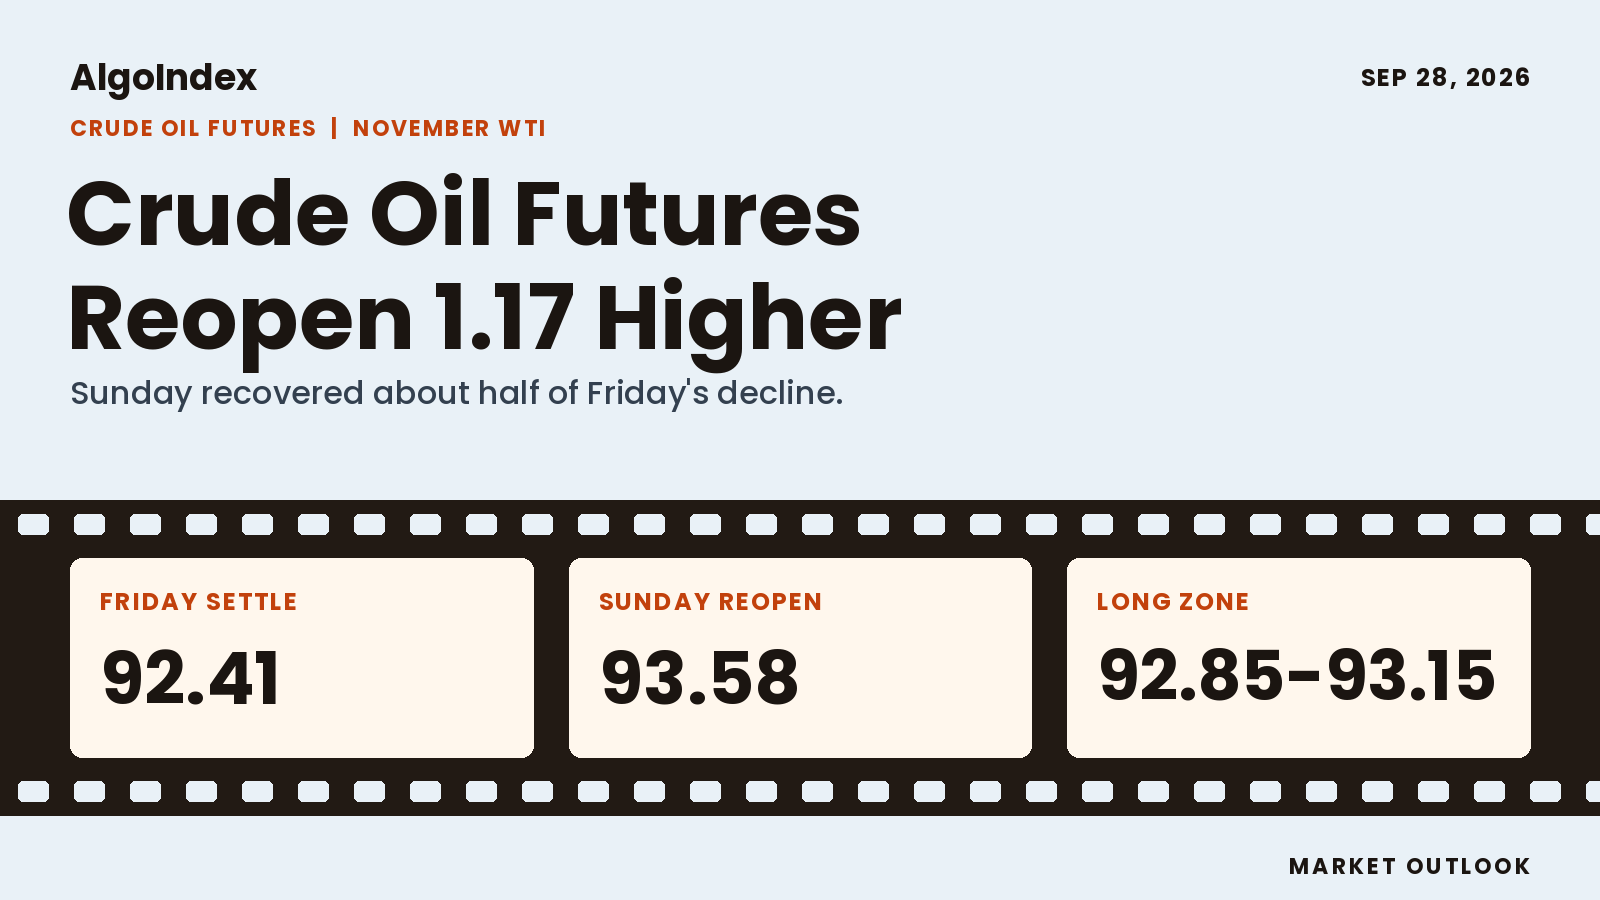
Crude Oil Futures: 92.41 Settle, 92.89 Pivot Long
November WTI settled 92.41, then reopened Sunday at 93.58 after the Iran plan was rejected. Levels, the 92.85 to 93.15 long and Monday's calendar.
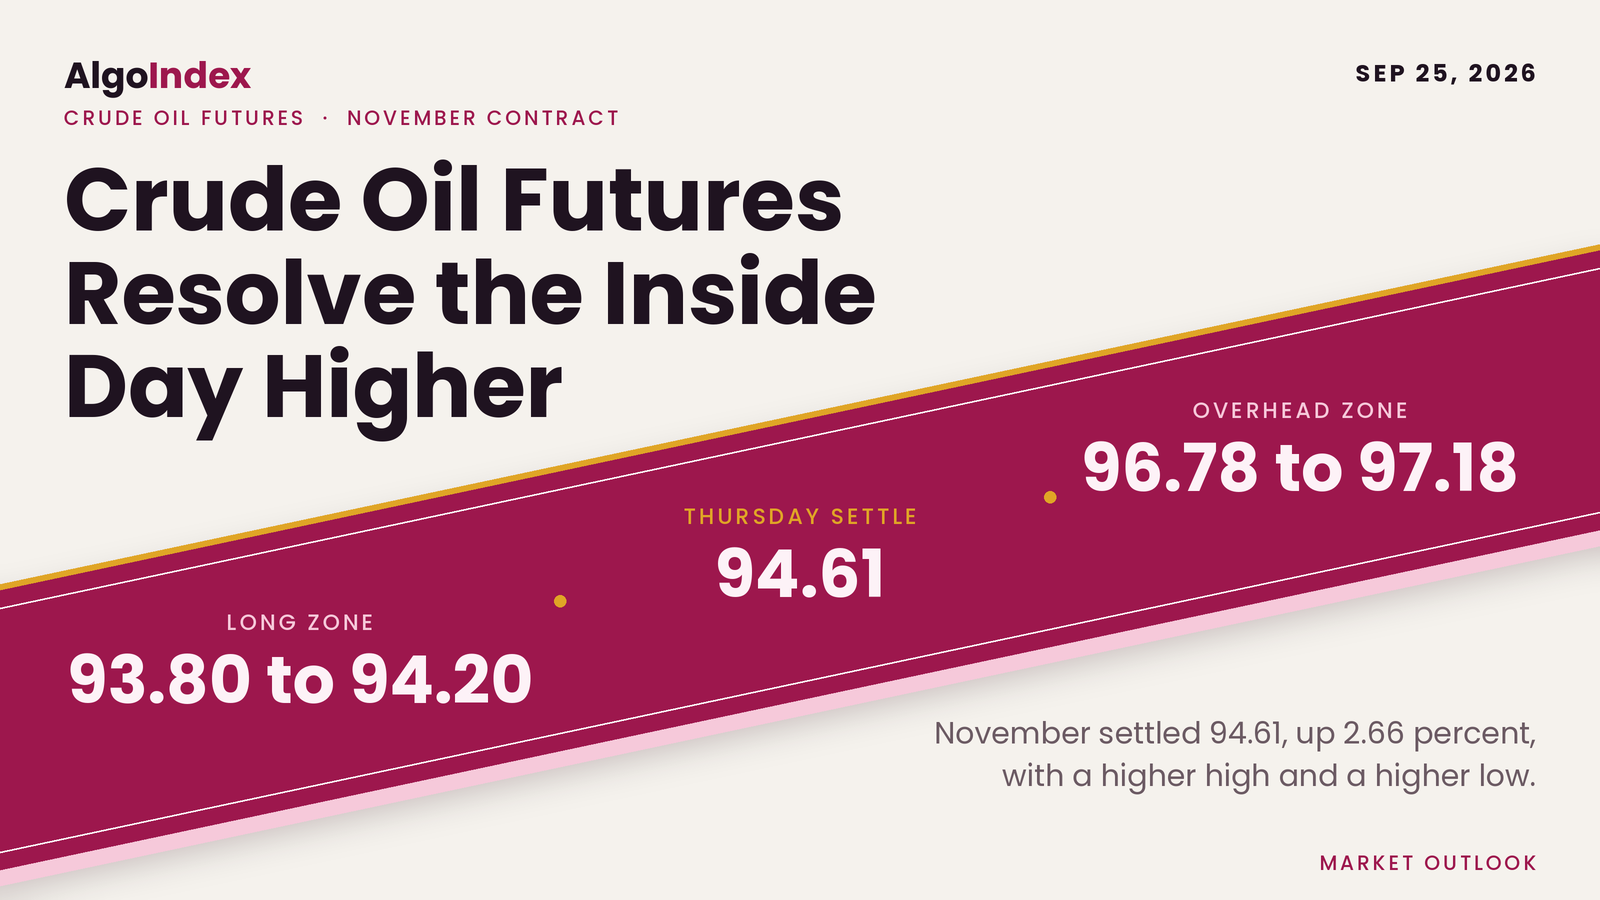
Crude Settles 94.61 on a Higher High, Long From 93.80
November WTI rose 2.45 to 94.61 as Brent gained 3.41 percent on supply-risk headlines. Levels, the 93.80 long and the 96.78 to 97.18 zone.
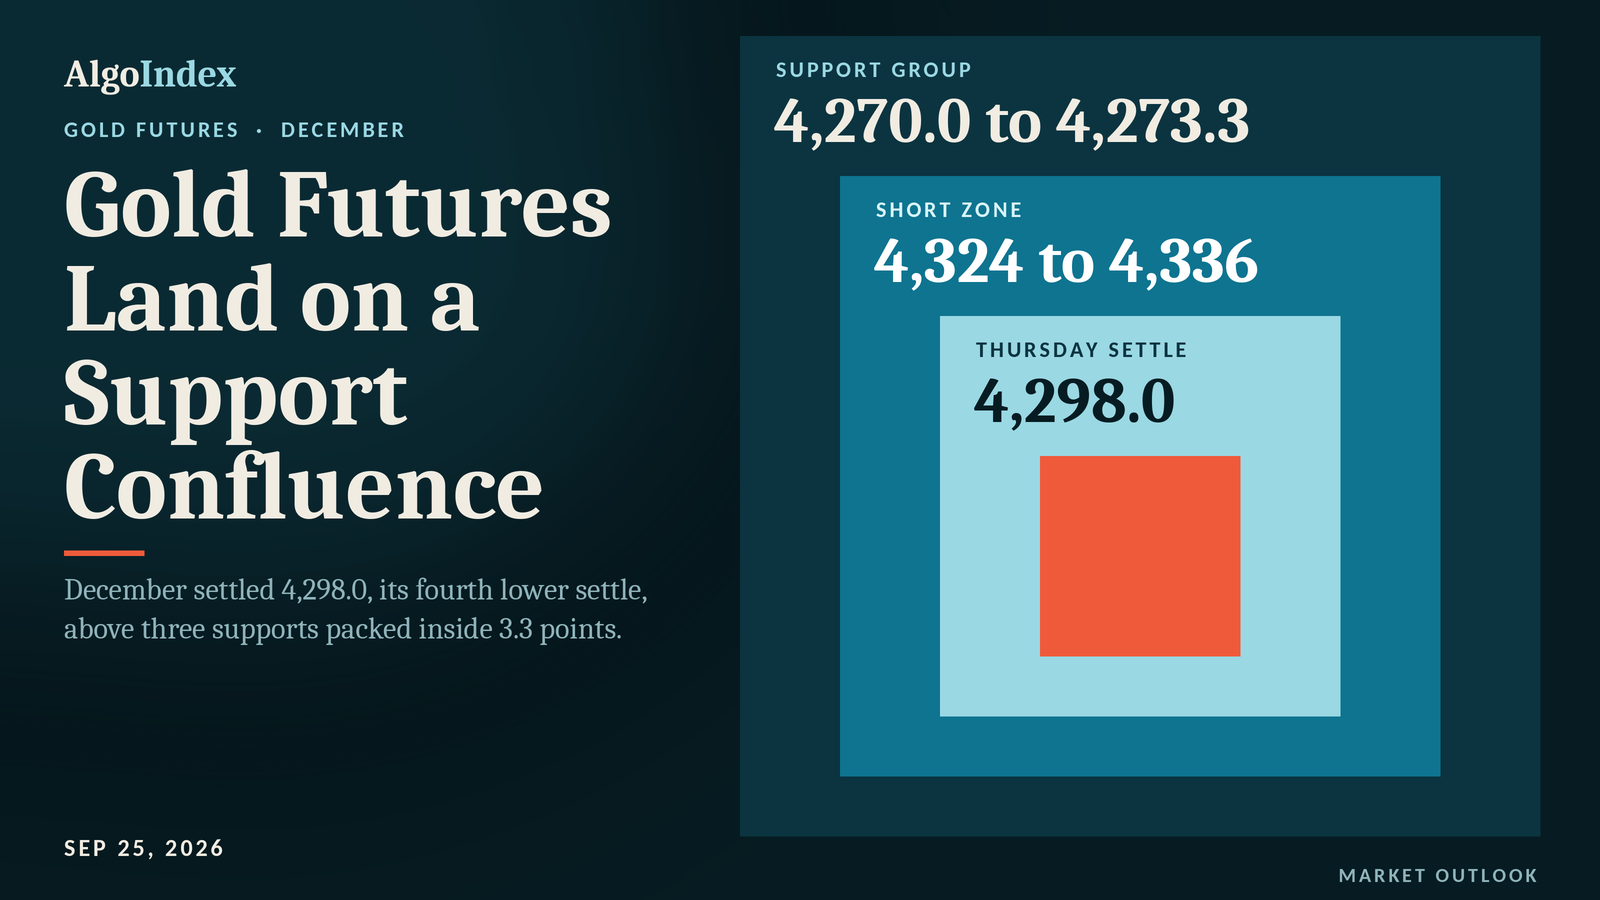
Gold Futures Slip to 4,298.0 on a Three-Level Support
December gold settled 4,298.0, its fourth lower settle, with the ten-year yield at 5.16 percent. Levels, the 4,324 to 4,336 short and Friday's data risk.
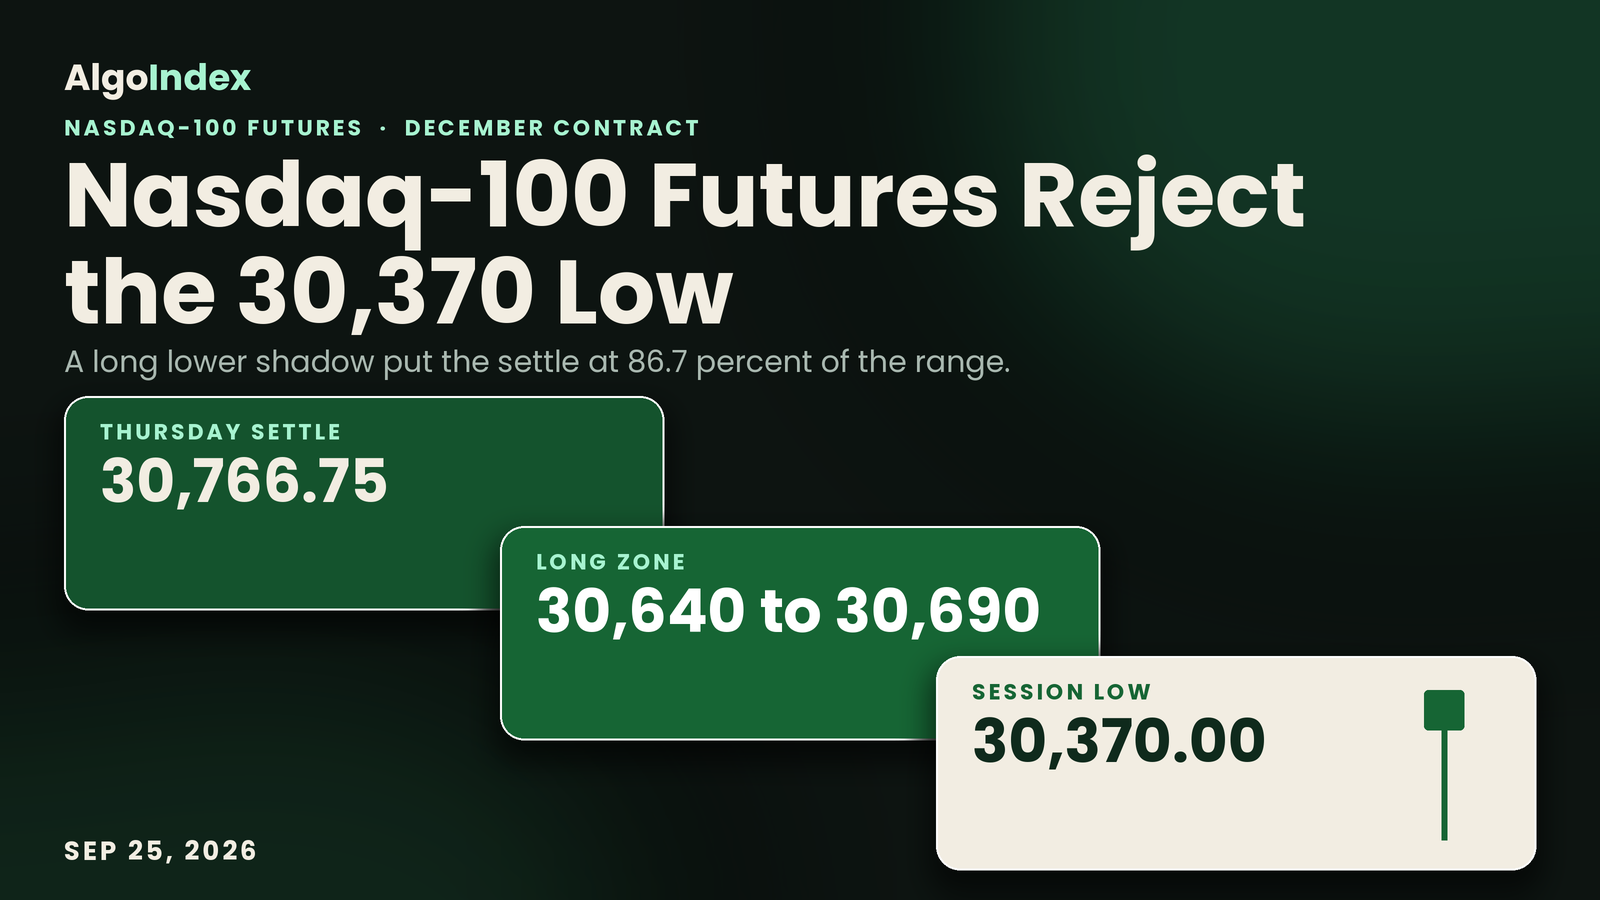
Nasdaq-100 Futures Settle 30,766.75 Near the Session High
December Nasdaq-100 futures settled at 30,766.75, 86.7 percent up a 457.50 point range. Levels, the 30,640 to 30,690 long and Friday's durable goods.
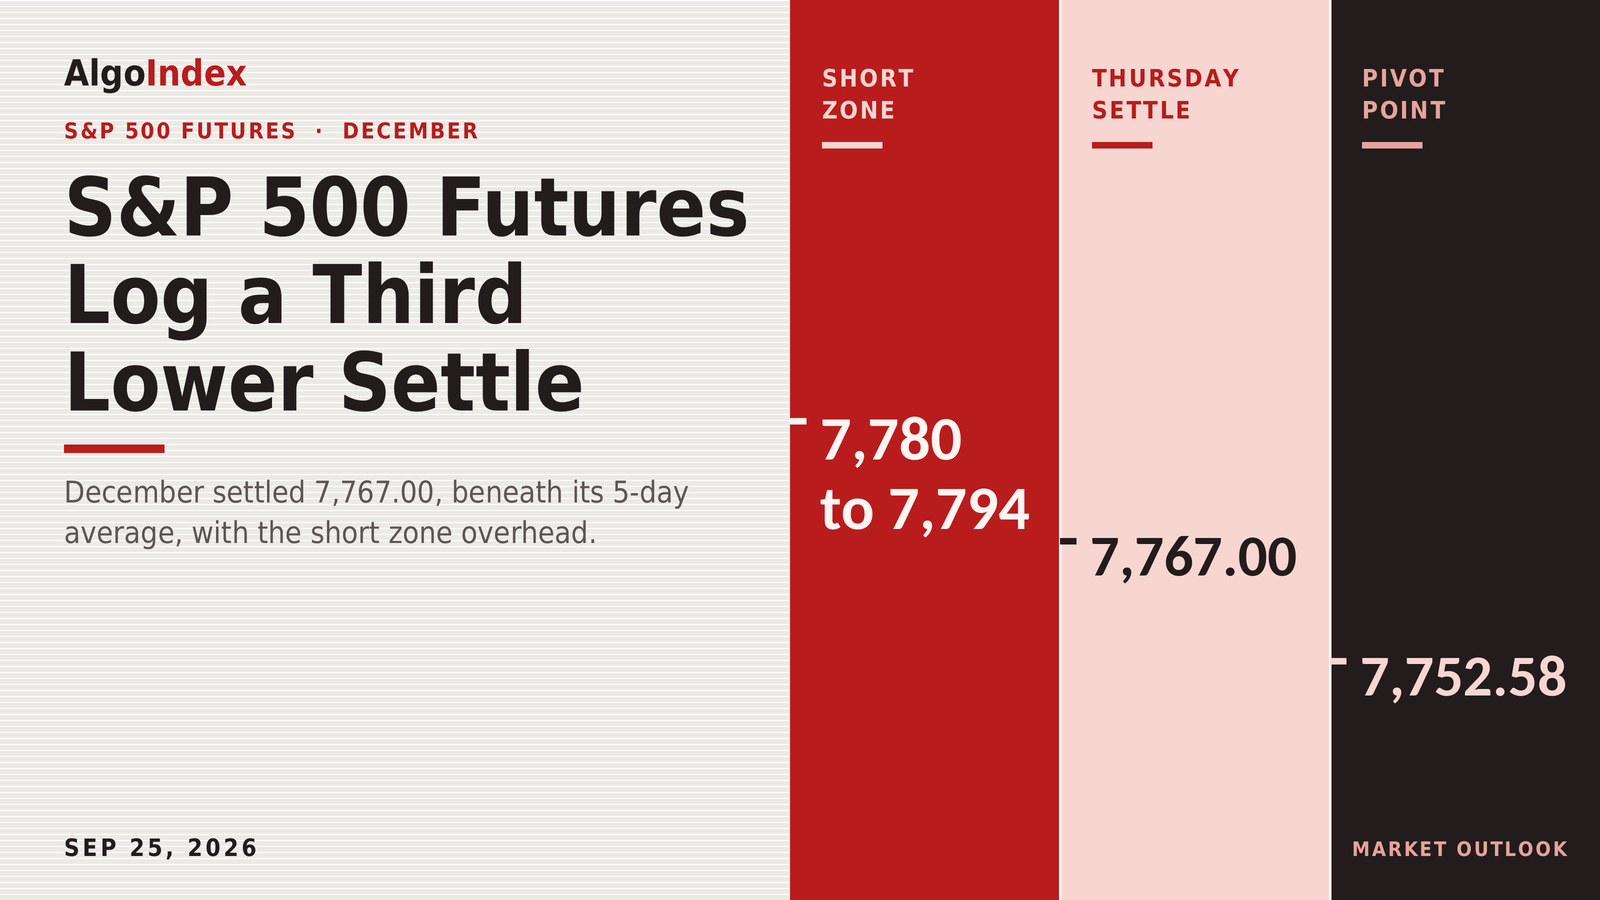
S&P Futures 7,767.00: Short 7,780 to 7,794 Under 7,819
December S&P futures settled at 7,767.00, a third lower settle, as the ten-year closed at 5.16 percent. Levels, the 7,780 to 7,794 short and Friday's calendar.
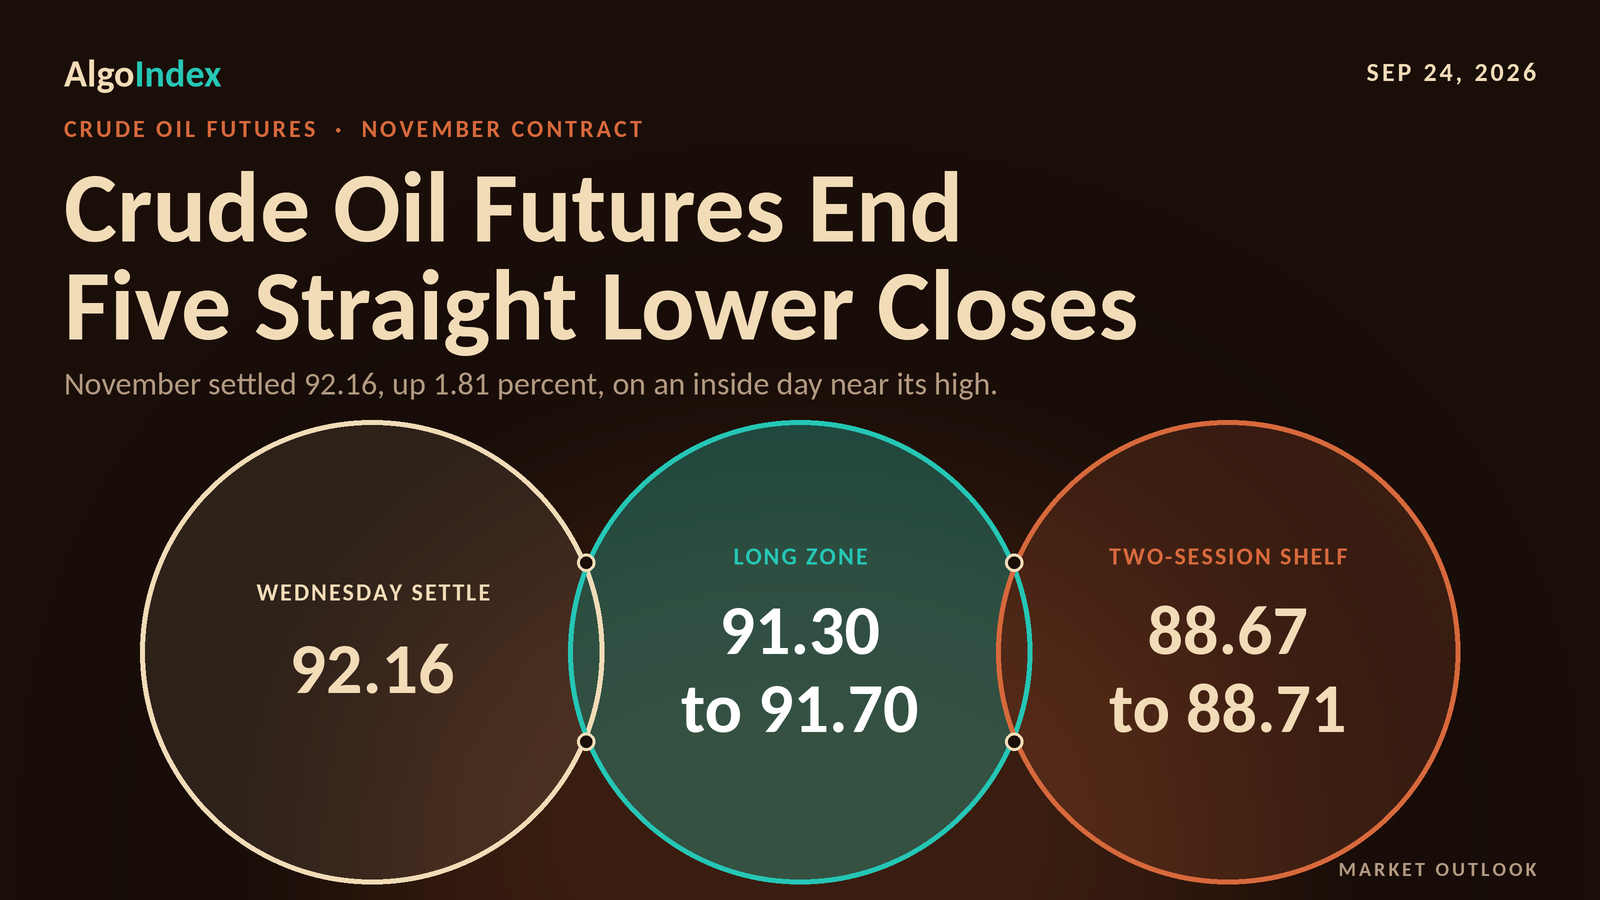
Crude Settles 92.16 on an Inside Day, Long From 91.30
November WTI rose 1.64 to 92.16 on an inside day as Brent jumped 3.86 percent. Levels, the 91.30 long and the 88.67 to 88.71 shelf.
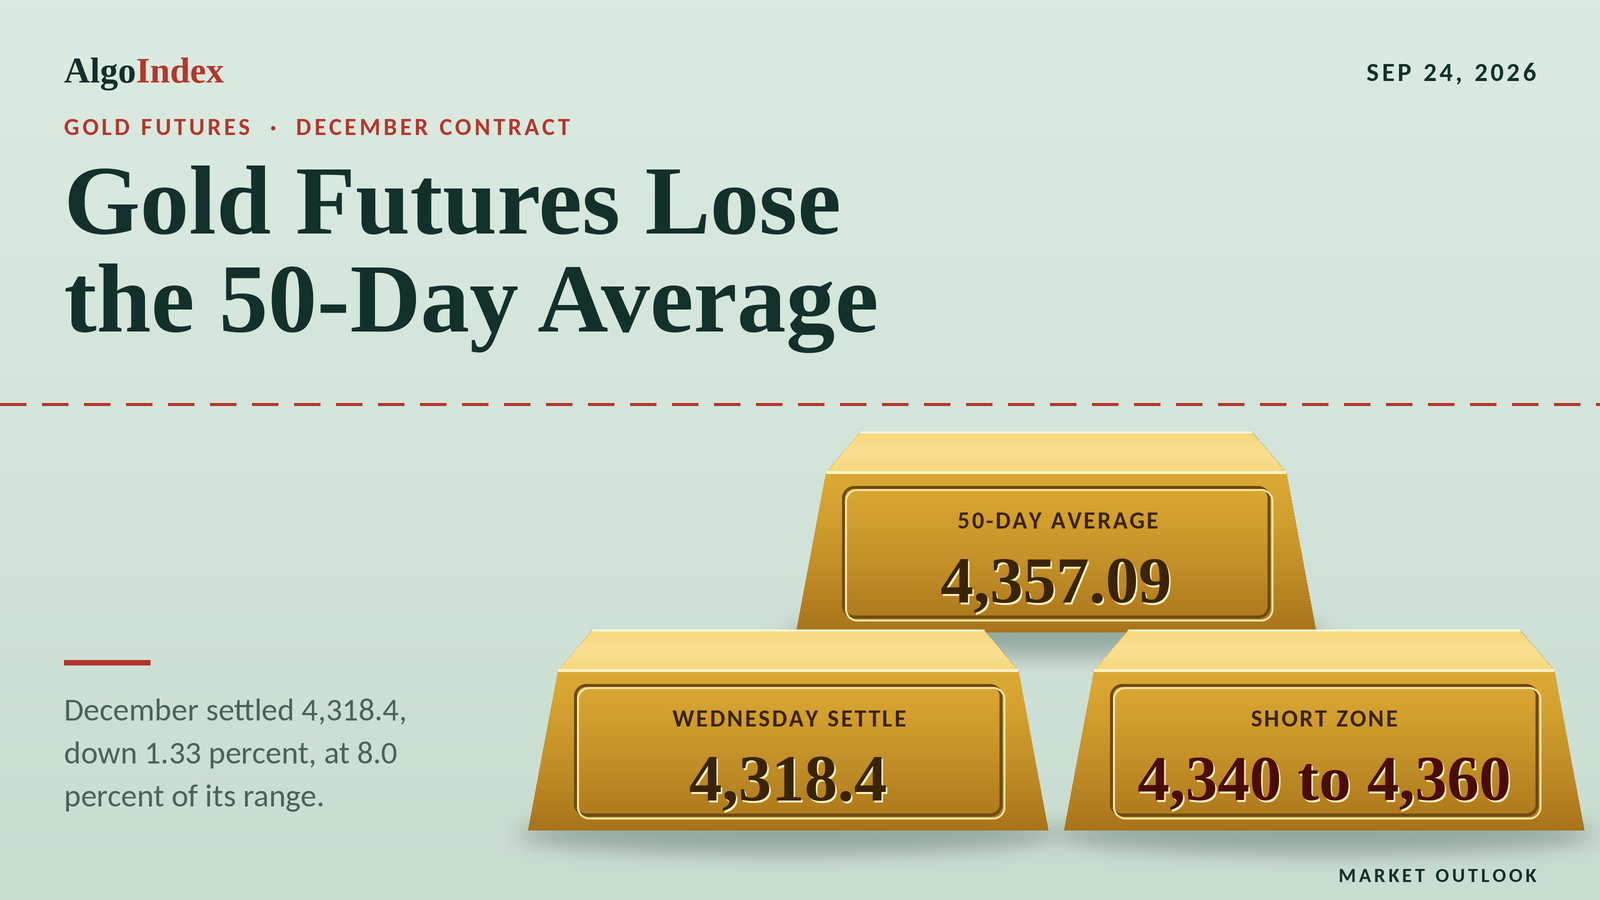
Gold Futures Lose the 50-Day, Settle 4,318.4
December gold settled 4,318.4, down 58.0 points as the ten-year yield closed at 5.11 percent. Levels, the 4,340 to 4,360 short and Thursday's claims risk.
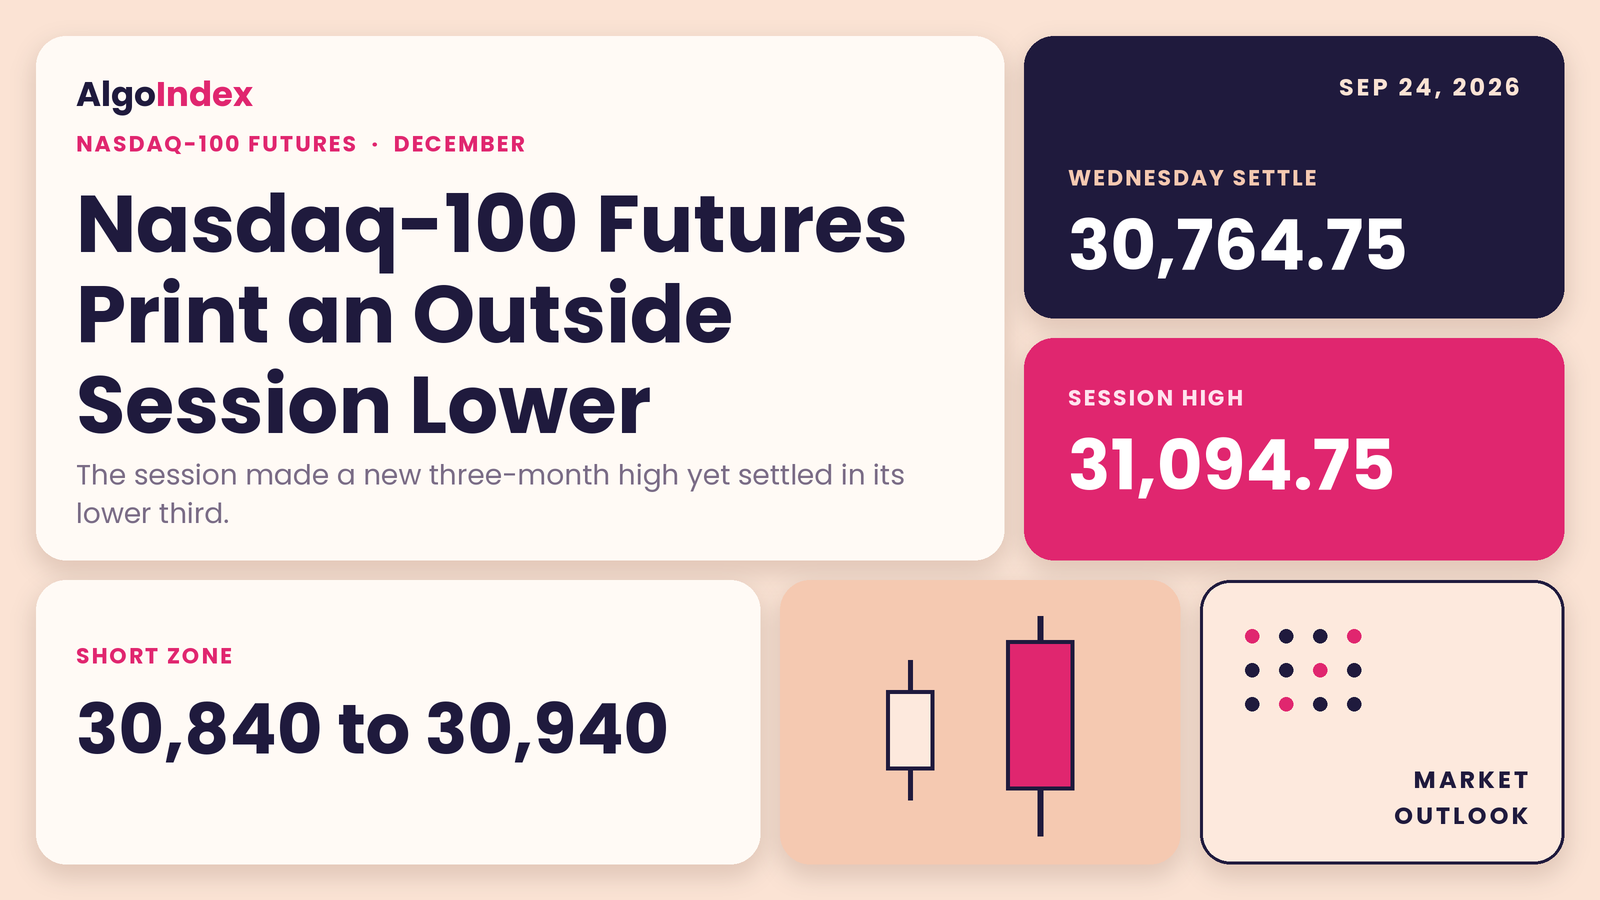
Nasdaq-100 Futures Settle 30,764.75 After an Outside Day
December Nasdaq-100 futures settled at 30,764.75 after an outside session on a 5.11 percent ten-year. Levels, the 30,840 to 30,940 short and Thursday's auction.
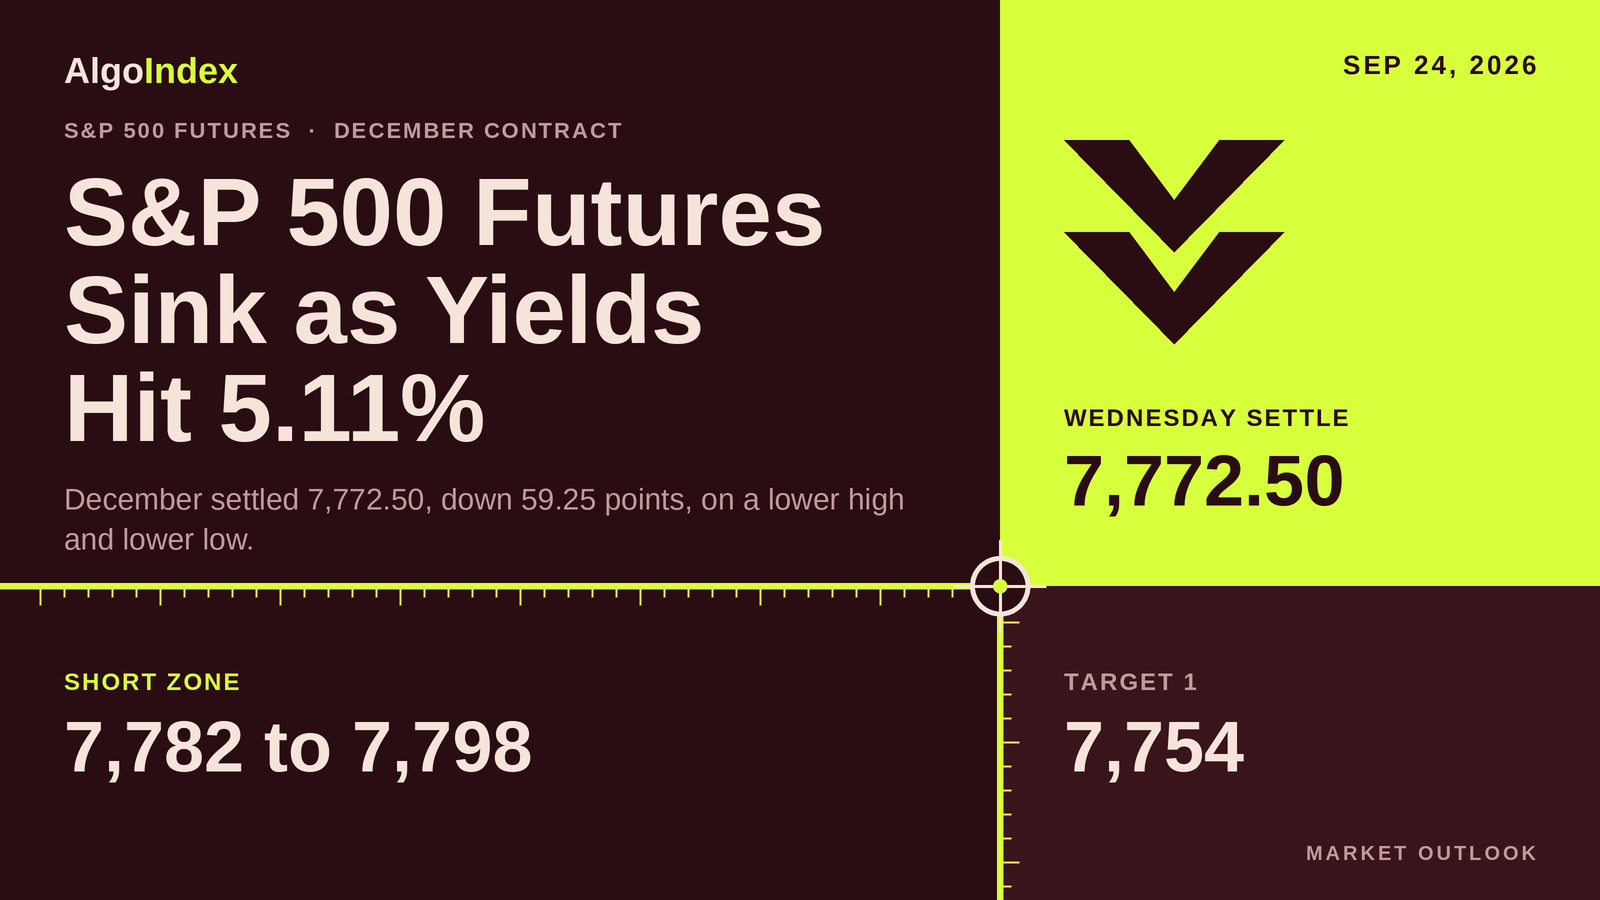
S&P Futures 7,772.50: Short 7,782 to 7,798 Under 7,826
December S&P futures settled at 7,772.50, down 59.25 as the ten-year closed at 5.11 percent. Levels, the 7,782 to 7,798 short and Thursday's calendar.