
Market Outlook
Institutional ES futures and SPY options research, gamma levels, and key zones for trading the S&P 500.
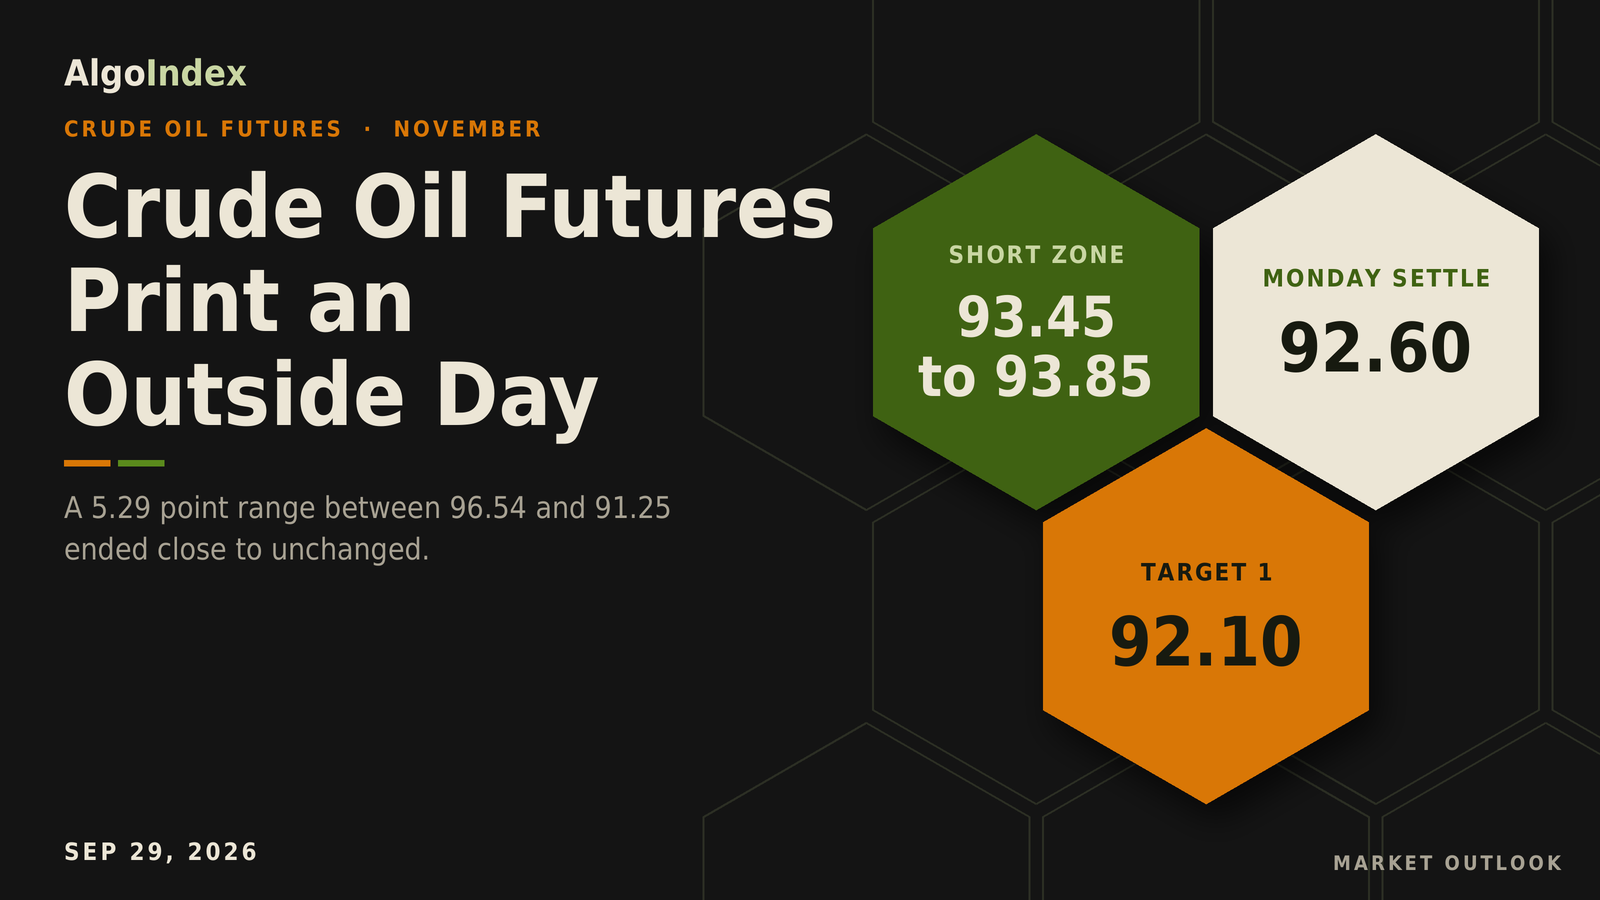
Crude Settles 92.60 After an Outside Day, Short From 93.45
November WTI settled 92.60 after a 96.54 to 91.25 outside day on swinging Iran headlines. Levels, the 93.45 short and the 93.32 to 93.96 cap.
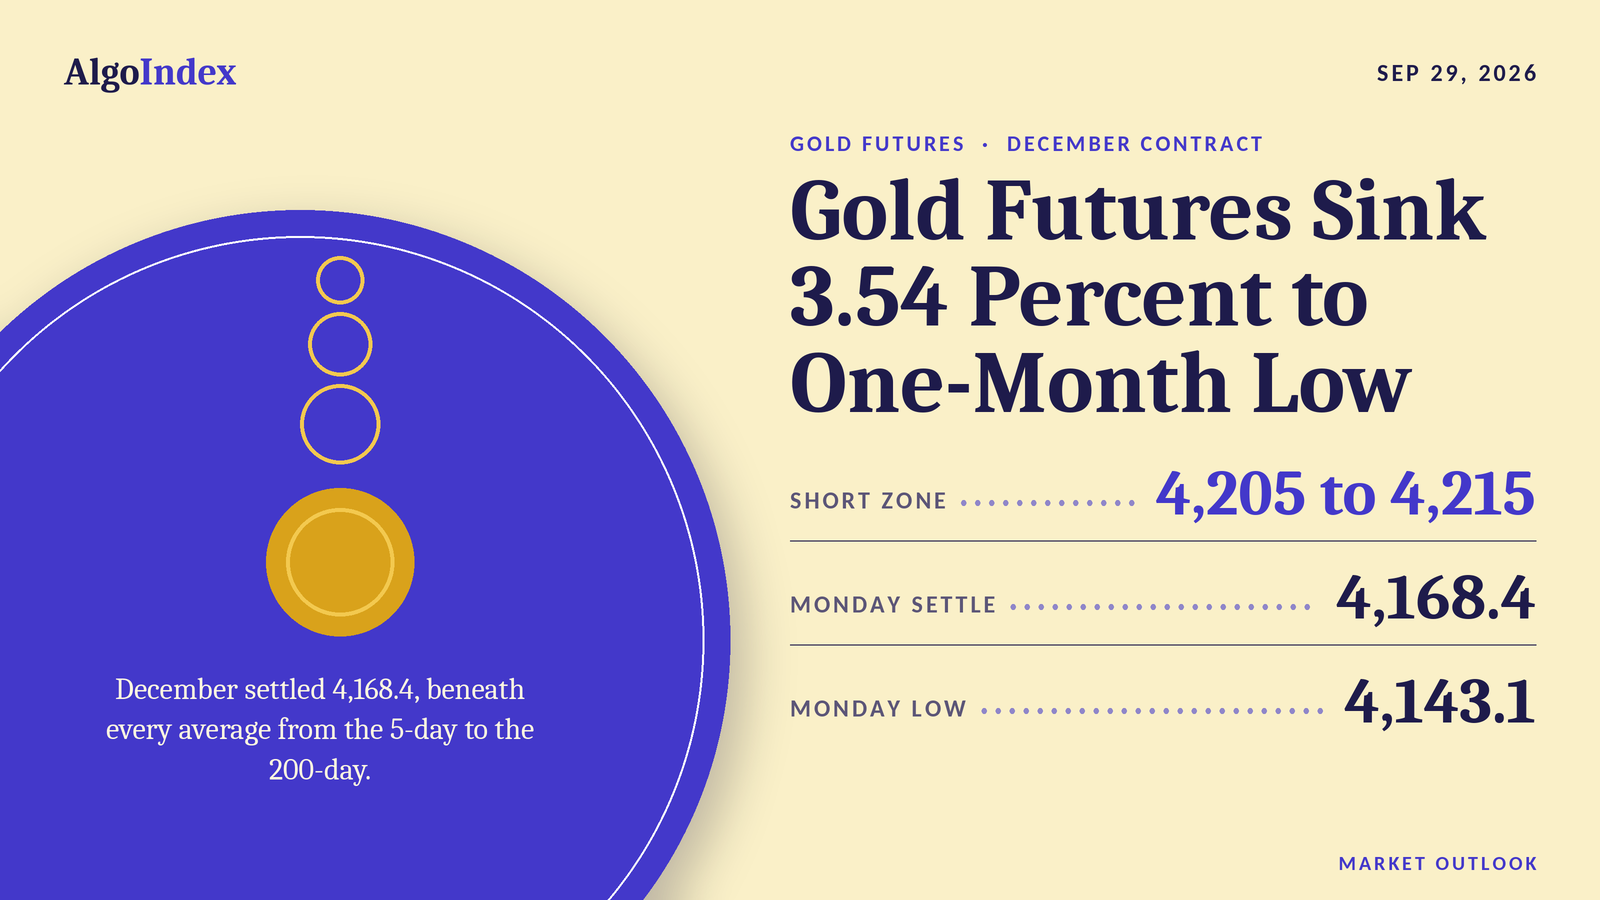
Gold Futures Sink 152.8 Points to 4,168.4 as Yields Climb
December gold settled at 4,168.4, down 3.54 percent, as the ten-year yield hit 5.27 percent. Levels, the 4,205 to 4,215 short and Tuesday's data risk.
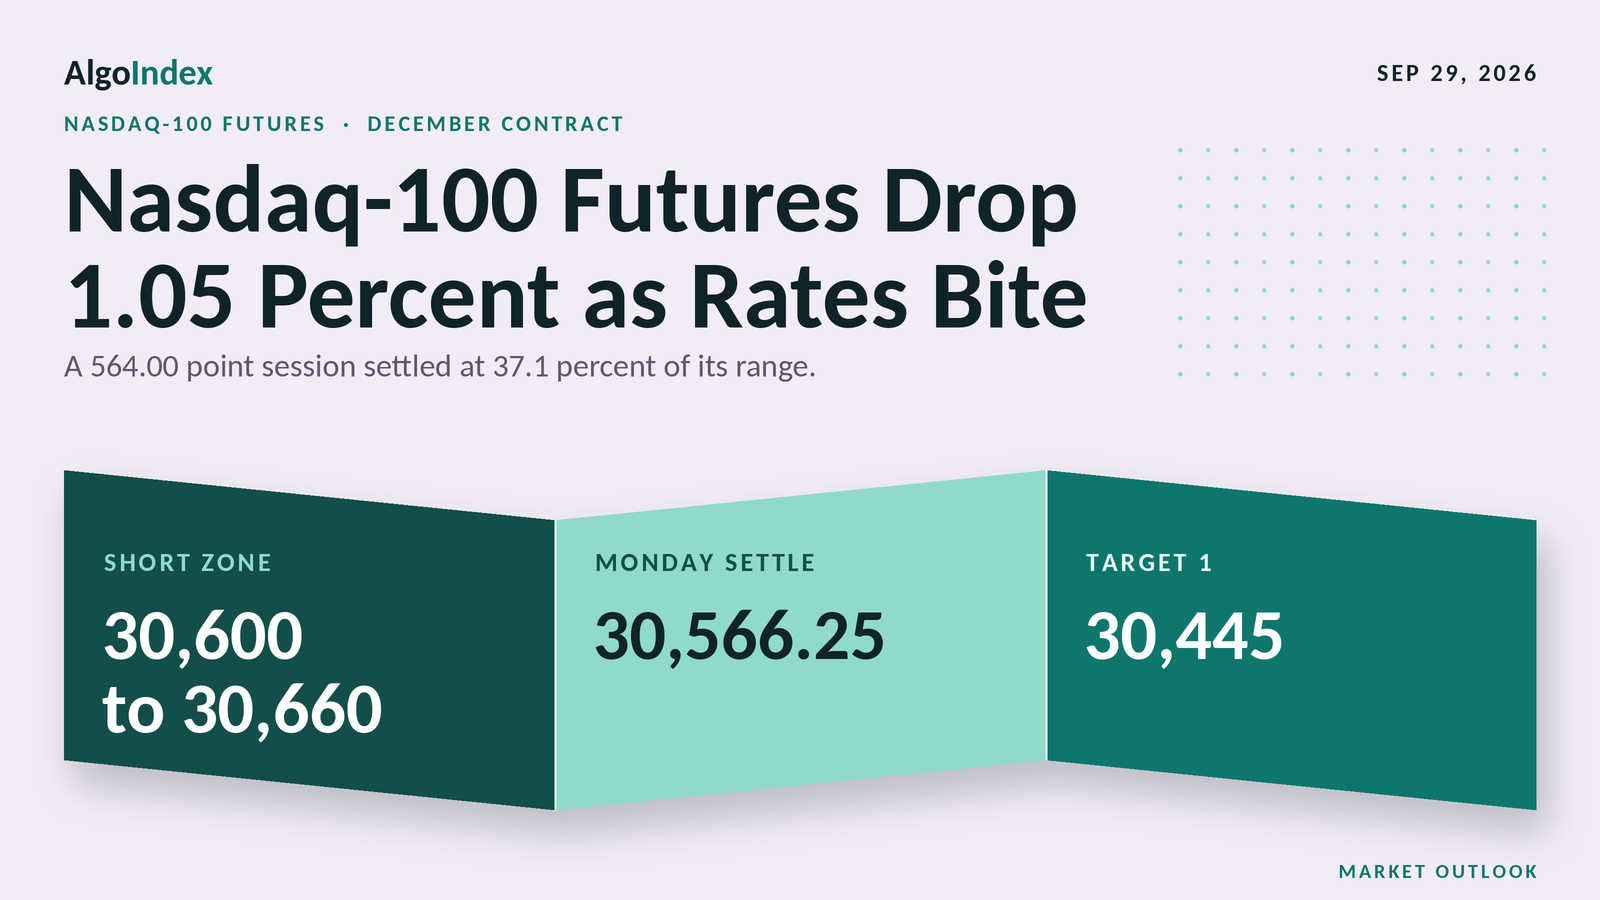
Nasdaq-100 Futures Fall 323 Points to 30,566.25
December Nasdaq-100 futures settled at 30,566.25 as the ten-year hit 5.27 percent. Levels, the 30,600 to 30,660 short and Tuesday's job openings data.
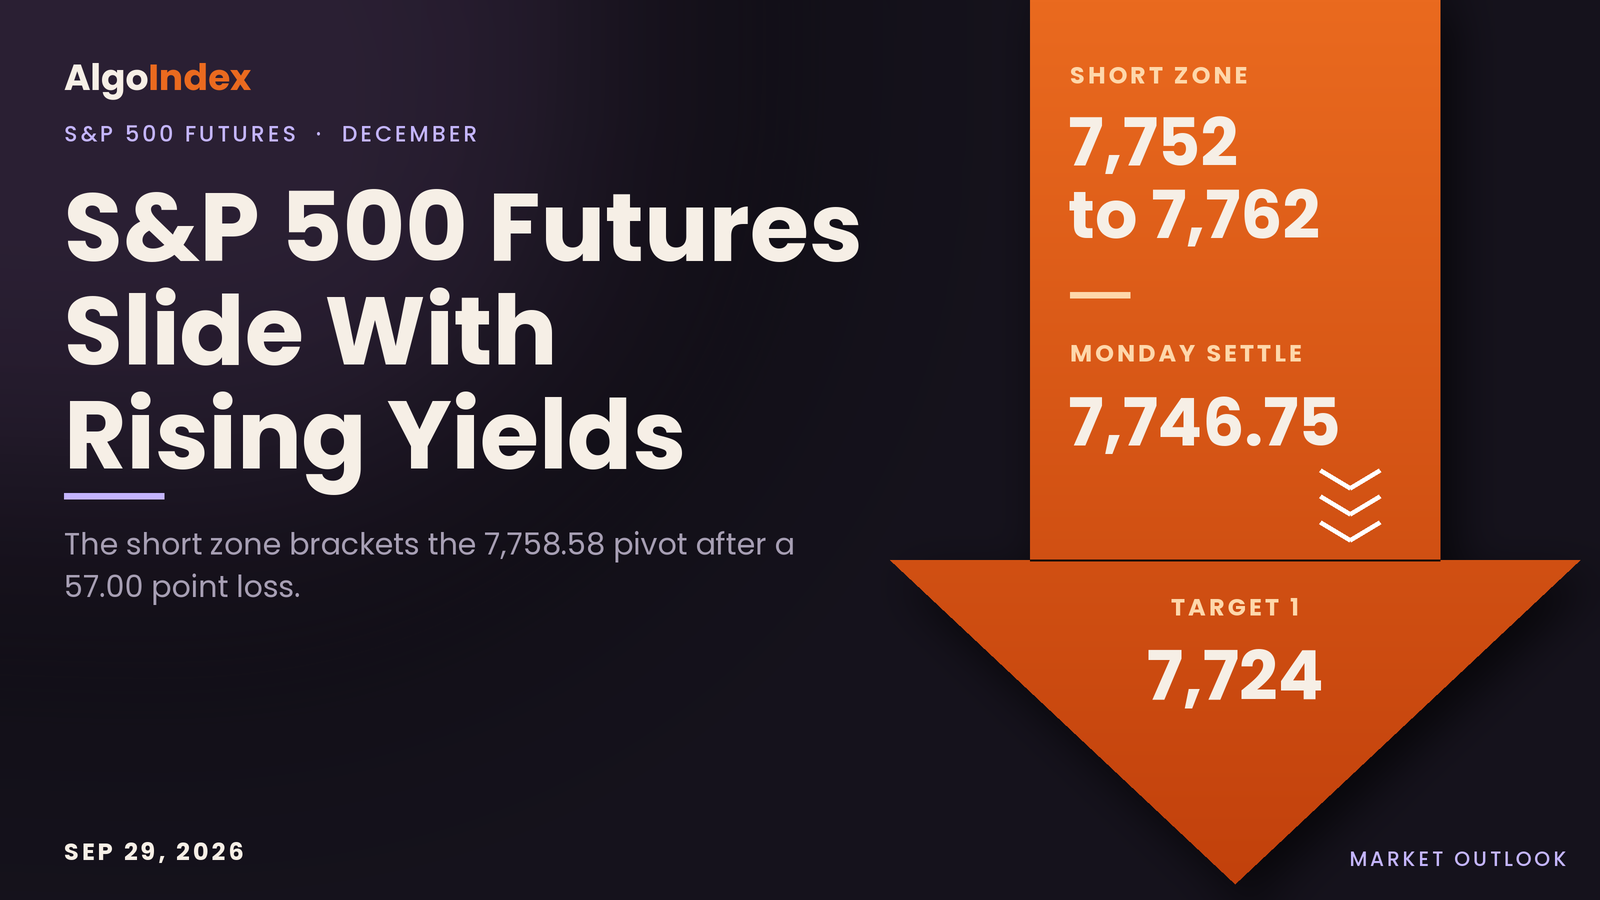
S&P Futures 7,746.75: Short 7,752 to 7,762 Under 7,790
December S&P futures fell 57.00 points to 7,746.75 as the ten-year printed 5.27 percent. Levels, the 7,752 to 7,762 short and Tuesday's job openings test.
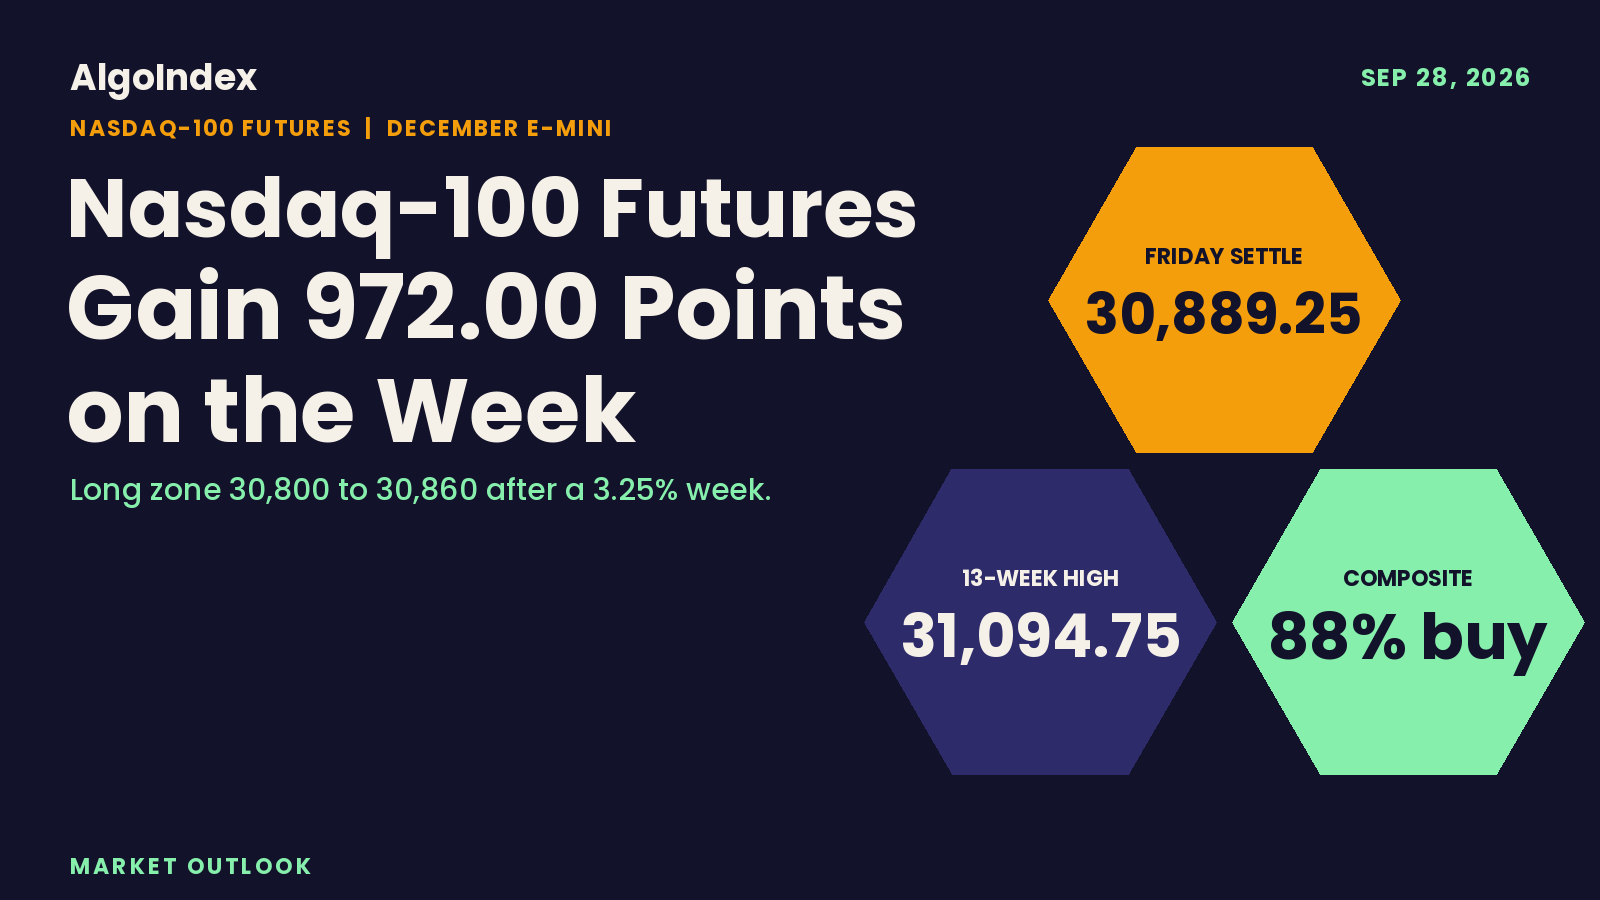
Nasdaq-100 Futures: 30,889.25 Settle, 30,855.92 Pivot Long
December Nasdaq-100 futures settled 30,889.25 after a 972-point week, 205.50 under the 13-week high. Levels, the 30,800 to 30,860 long and Monday's calendar.
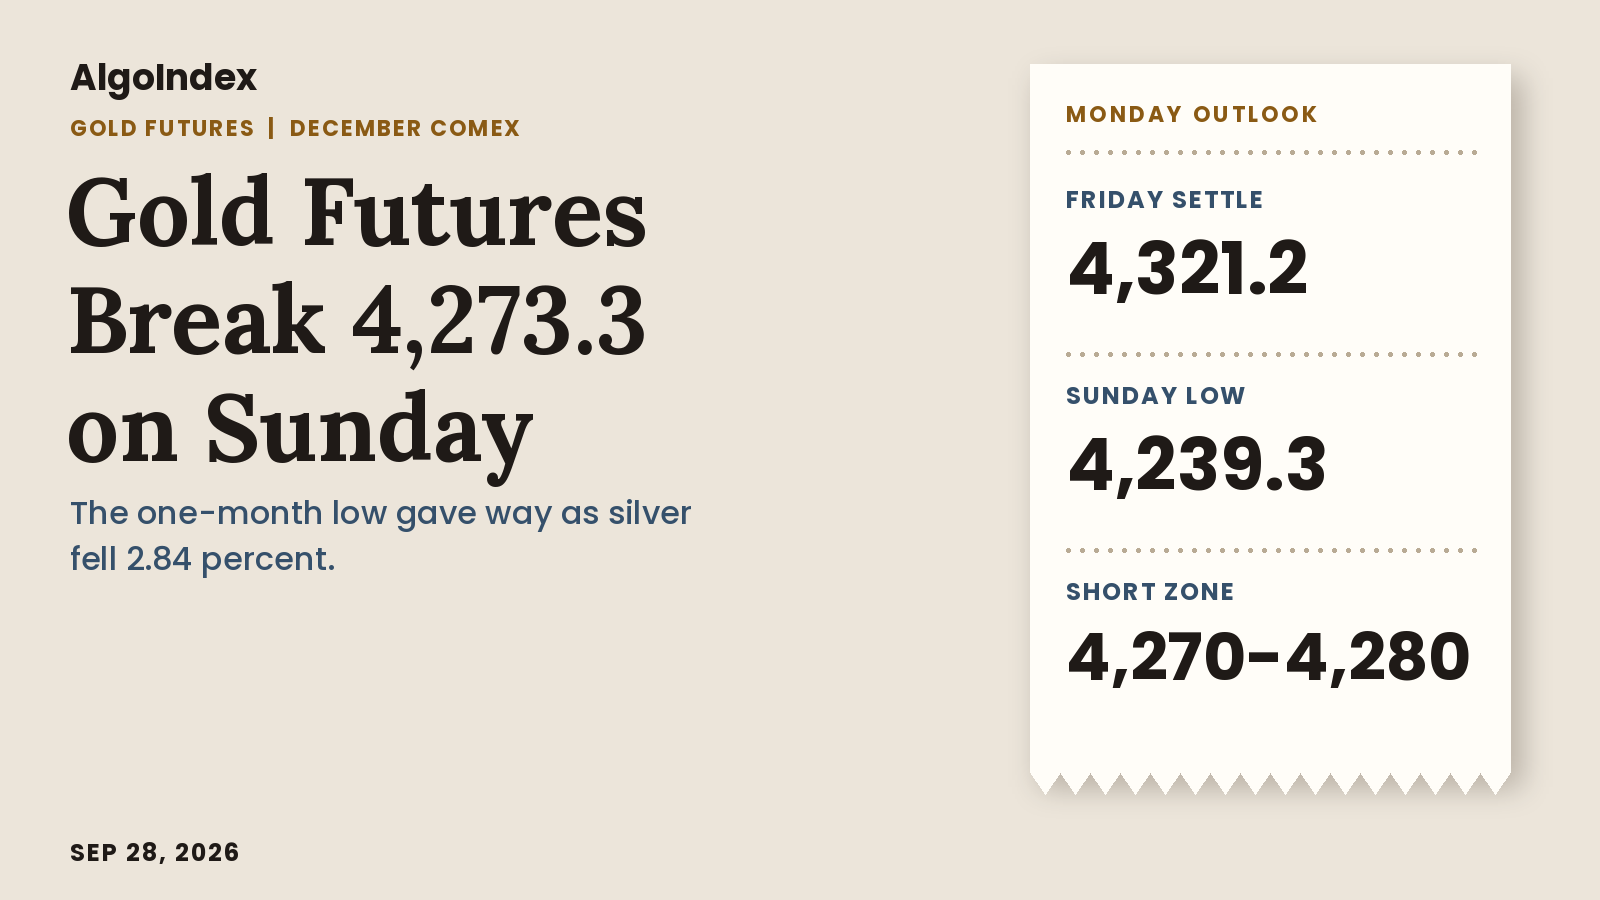
Gold Futures: 4,321.2 Settle, Sunday Break, 4,270 Short
December gold settled 4,321.2, then broke to 4,239.3 on Sunday through the 4,273.3 one-month low. Levels, the 4,270 to 4,280 short and Monday's calendar.
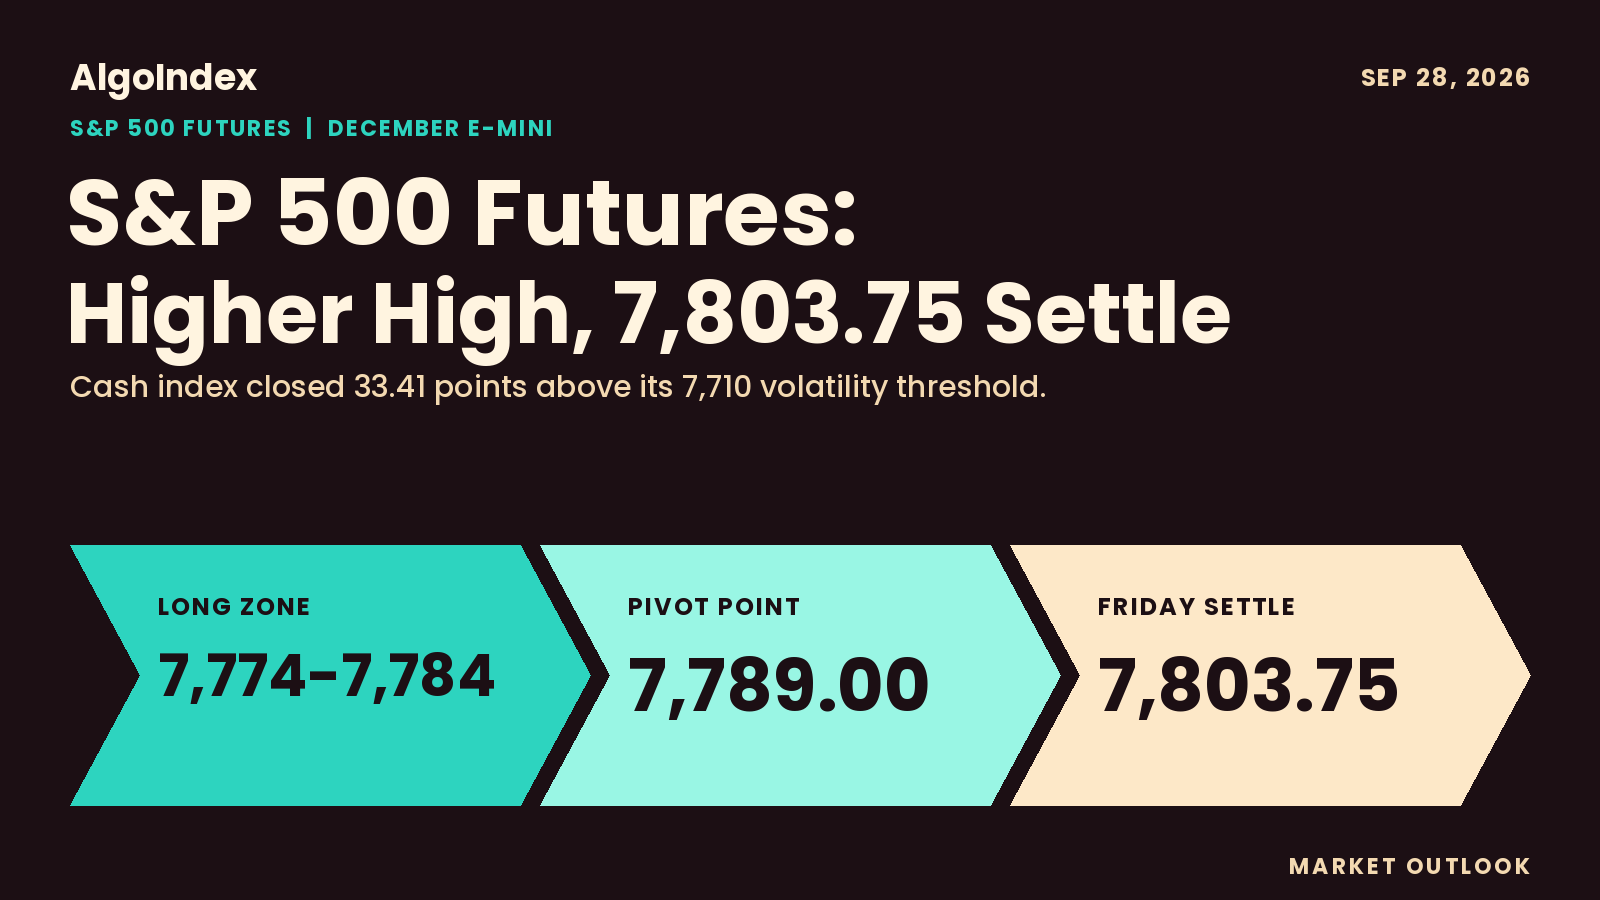
S&P 500 Futures: 7,803.75 Settle, 7,789.00 Pivot Long
December S&P futures settled 7,803.75 with a higher high and higher low as the ten-year closed at 5.18 percent. Levels, the 7,774 long and Monday's calendar.
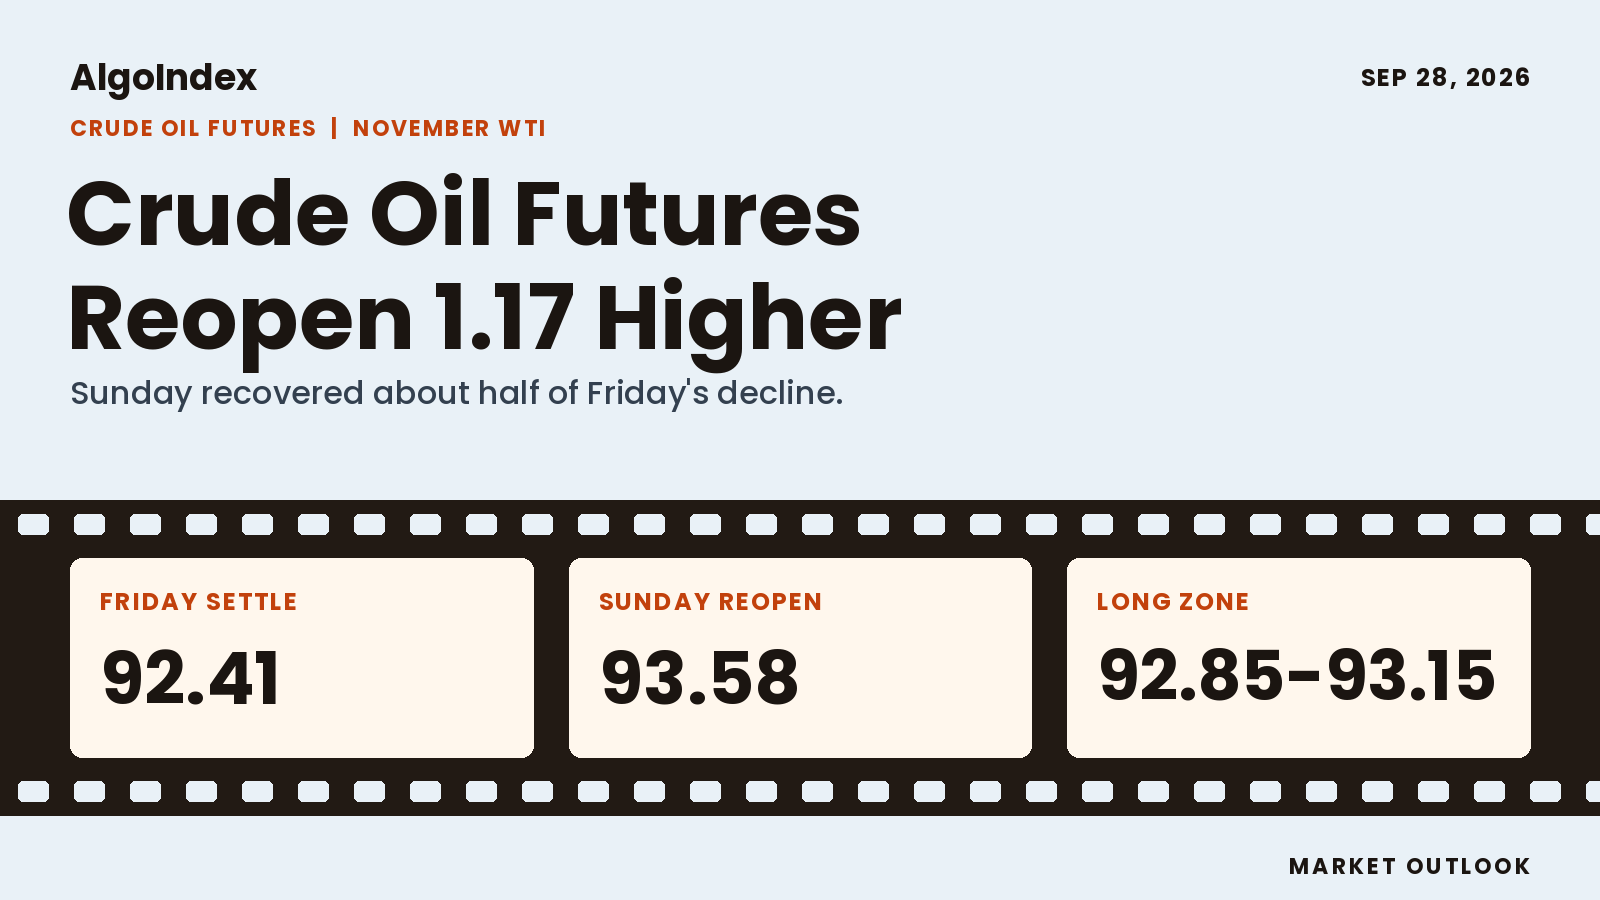
Crude Oil Futures: 92.41 Settle, 92.89 Pivot Long
November WTI settled 92.41, then reopened Sunday at 93.58 after the Iran plan was rejected. Levels, the 92.85 to 93.15 long and Monday's calendar.
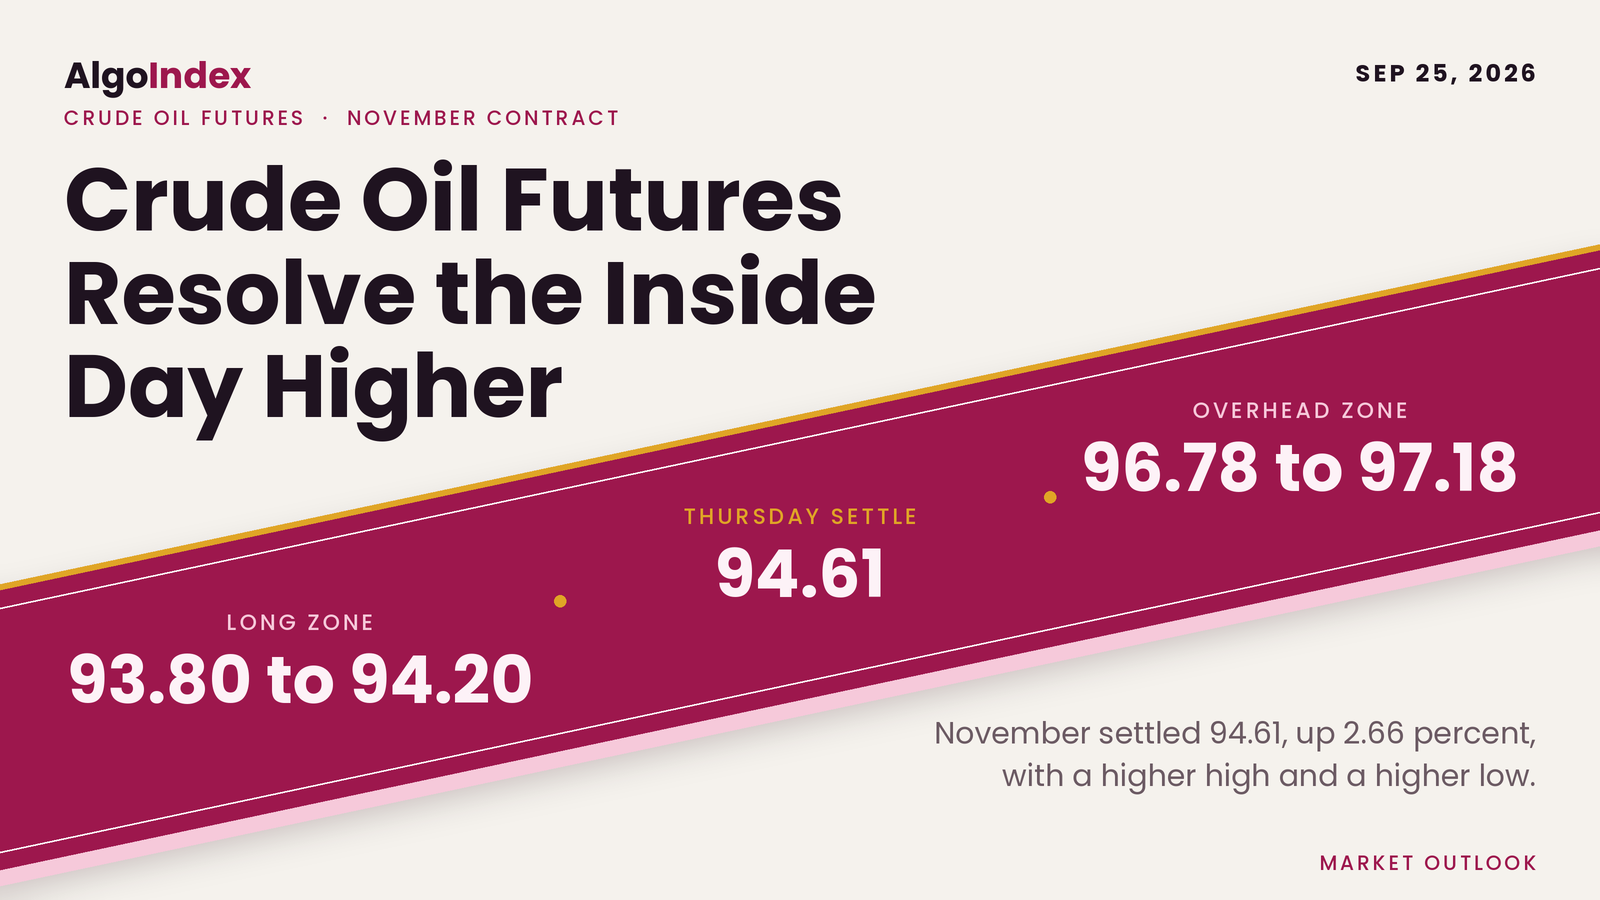
Crude Settles 94.61 on a Higher High, Long From 93.80
November WTI rose 2.45 to 94.61 as Brent gained 3.41 percent on supply-risk headlines. Levels, the 93.80 long and the 96.78 to 97.18 zone.
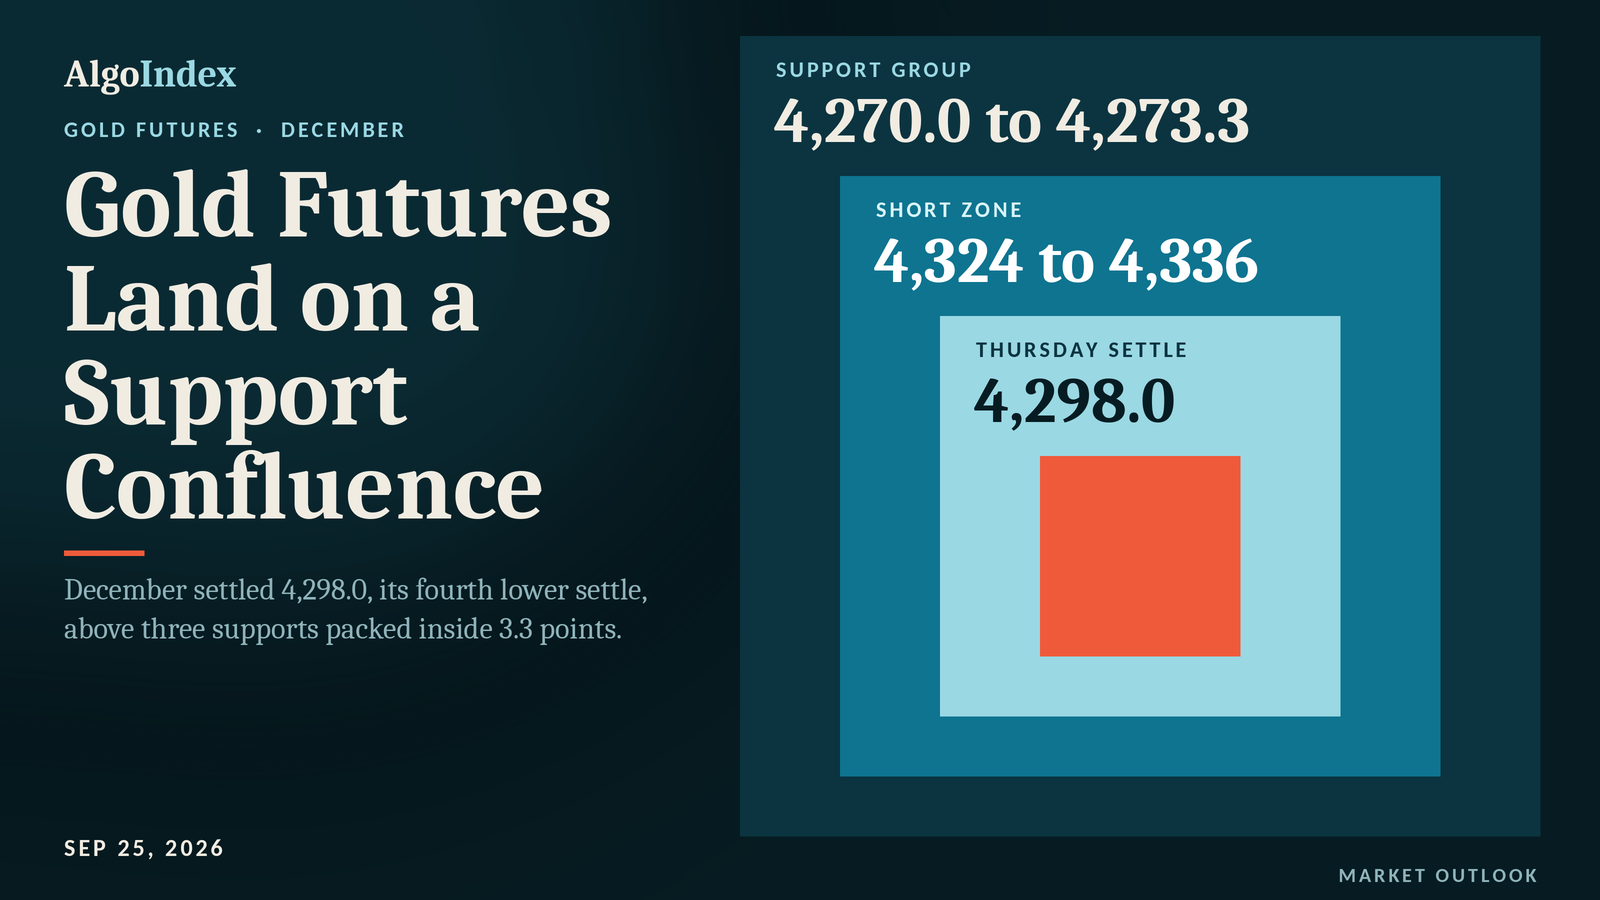
Gold Futures Slip to 4,298.0 on a Three-Level Support
December gold settled 4,298.0, its fourth lower settle, with the ten-year yield at 5.16 percent. Levels, the 4,324 to 4,336 short and Friday's data risk.
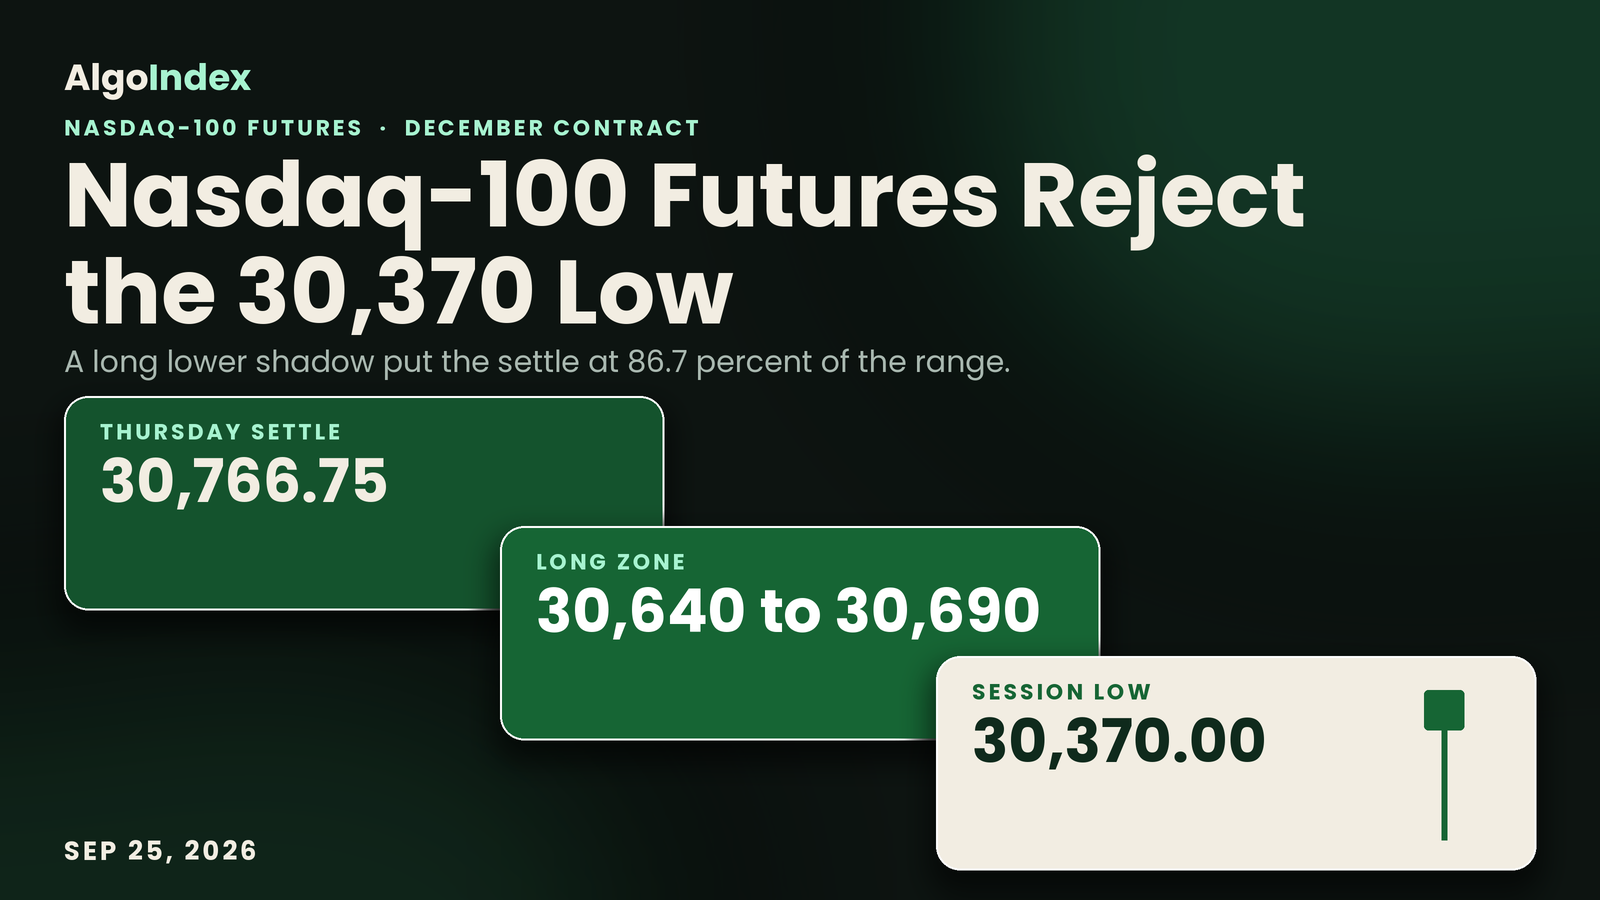
Nasdaq-100 Futures Settle 30,766.75 Near the Session High
December Nasdaq-100 futures settled at 30,766.75, 86.7 percent up a 457.50 point range. Levels, the 30,640 to 30,690 long and Friday's durable goods.
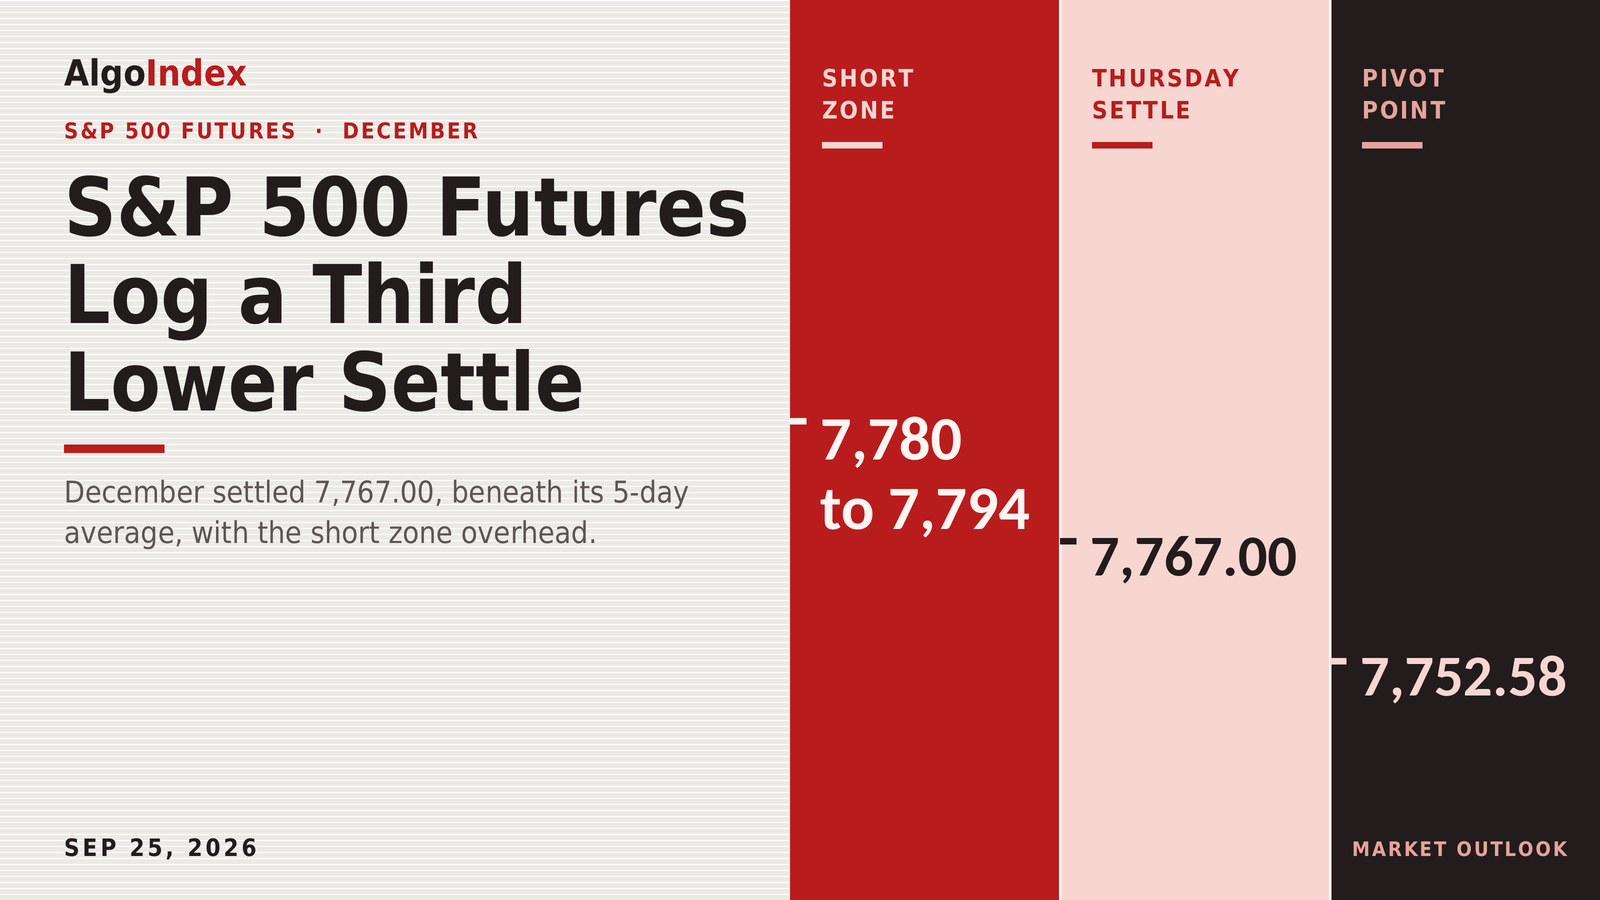
S&P Futures 7,767.00: Short 7,780 to 7,794 Under 7,819
December S&P futures settled at 7,767.00, a third lower settle, as the ten-year closed at 5.16 percent. Levels, the 7,780 to 7,794 short and Friday's calendar.
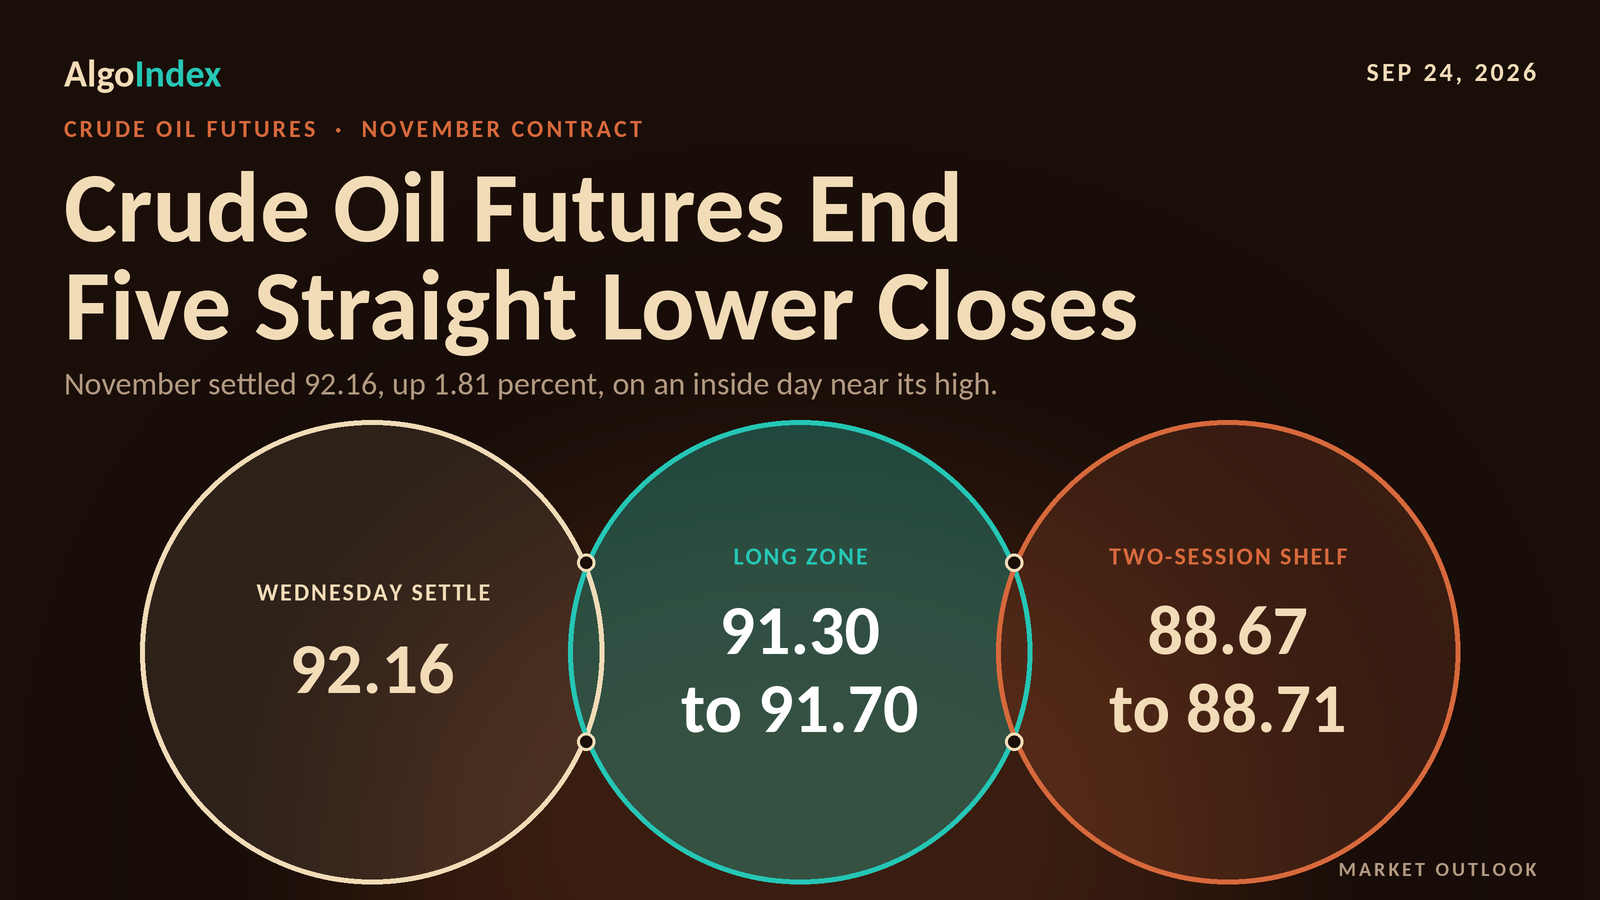
Crude Settles 92.16 on an Inside Day, Long From 91.30
November WTI rose 1.64 to 92.16 on an inside day as Brent jumped 3.86 percent. Levels, the 91.30 long and the 88.67 to 88.71 shelf.
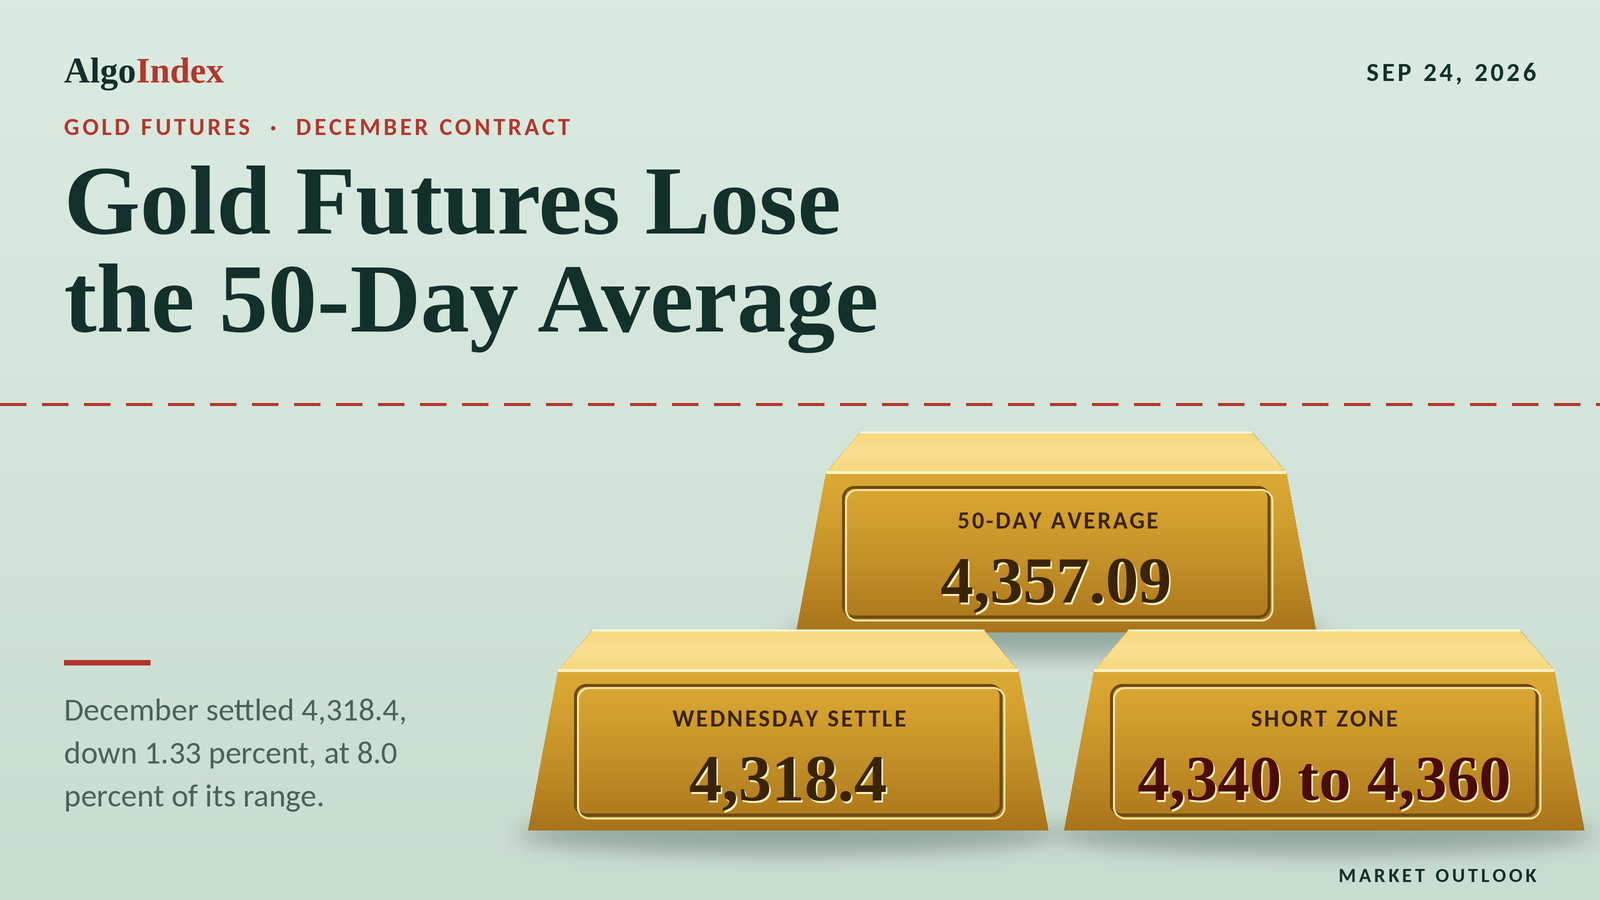
Gold Futures Lose the 50-Day, Settle 4,318.4
December gold settled 4,318.4, down 58.0 points as the ten-year yield closed at 5.11 percent. Levels, the 4,340 to 4,360 short and Thursday's claims risk.
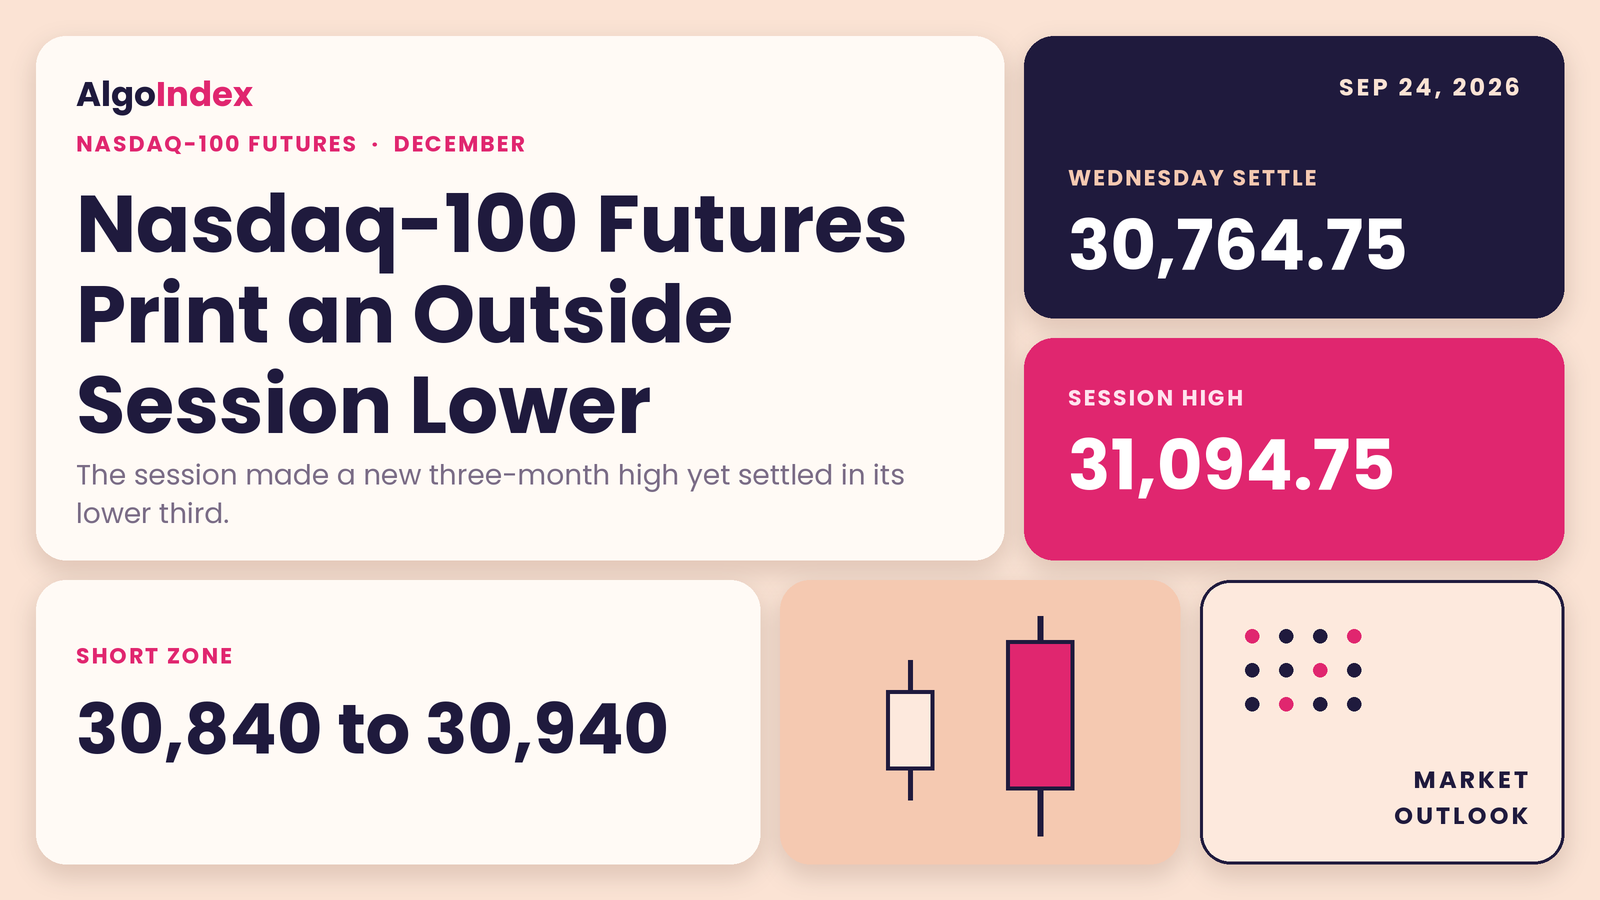
Nasdaq-100 Futures Settle 30,764.75 After an Outside Day
December Nasdaq-100 futures settled at 30,764.75 after an outside session on a 5.11 percent ten-year. Levels, the 30,840 to 30,940 short and Thursday's auction.
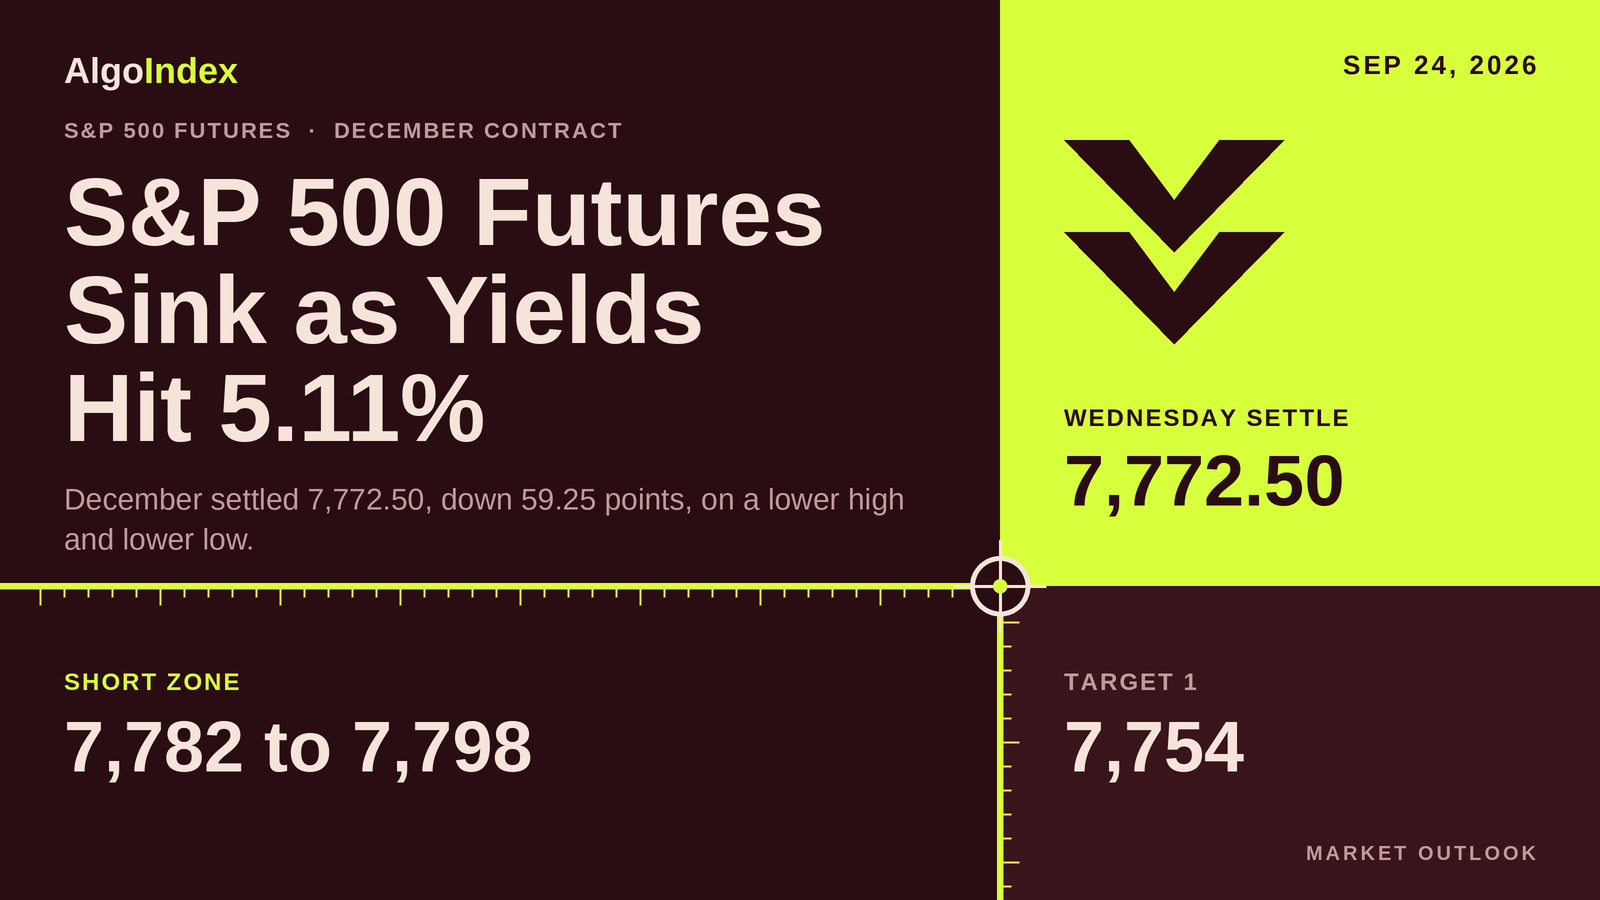
S&P Futures 7,772.50: Short 7,782 to 7,798 Under 7,826
December S&P futures settled at 7,772.50, down 59.25 as the ten-year closed at 5.11 percent. Levels, the 7,782 to 7,798 short and Thursday's calendar.
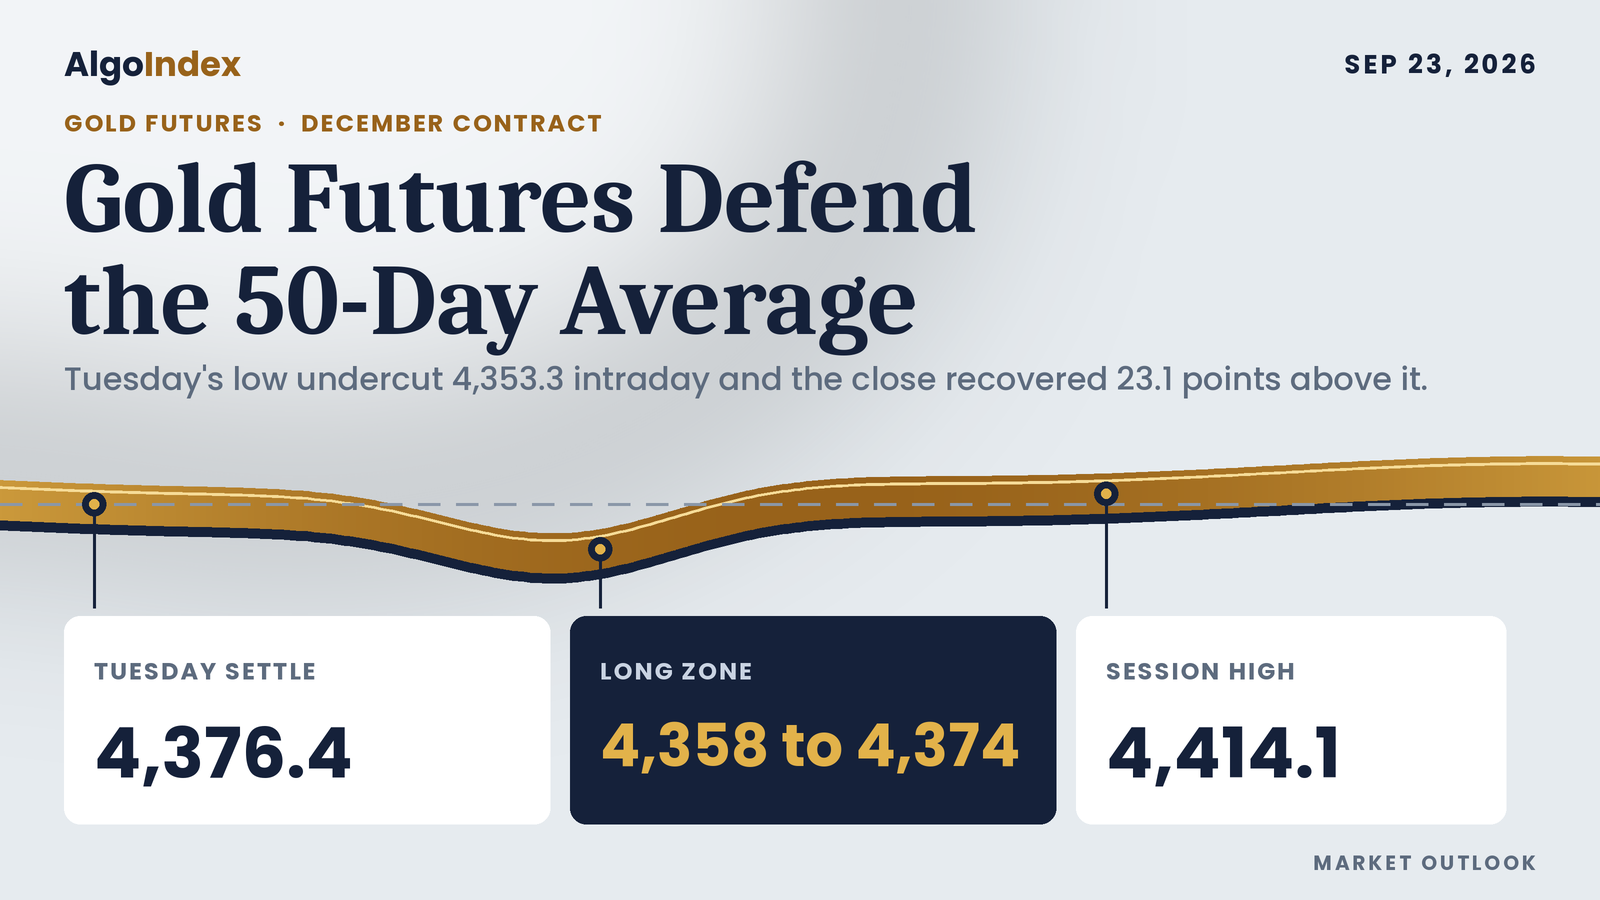
Gold Futures Reclaim the 50-Day, Settle 4,376.4
December gold lost its 50-day average intraday, then settled 23.1 points above it at 4,376.4. Levels, the 4,358 to 4,374 long and Wednesday's 09:45 AM ET risk.
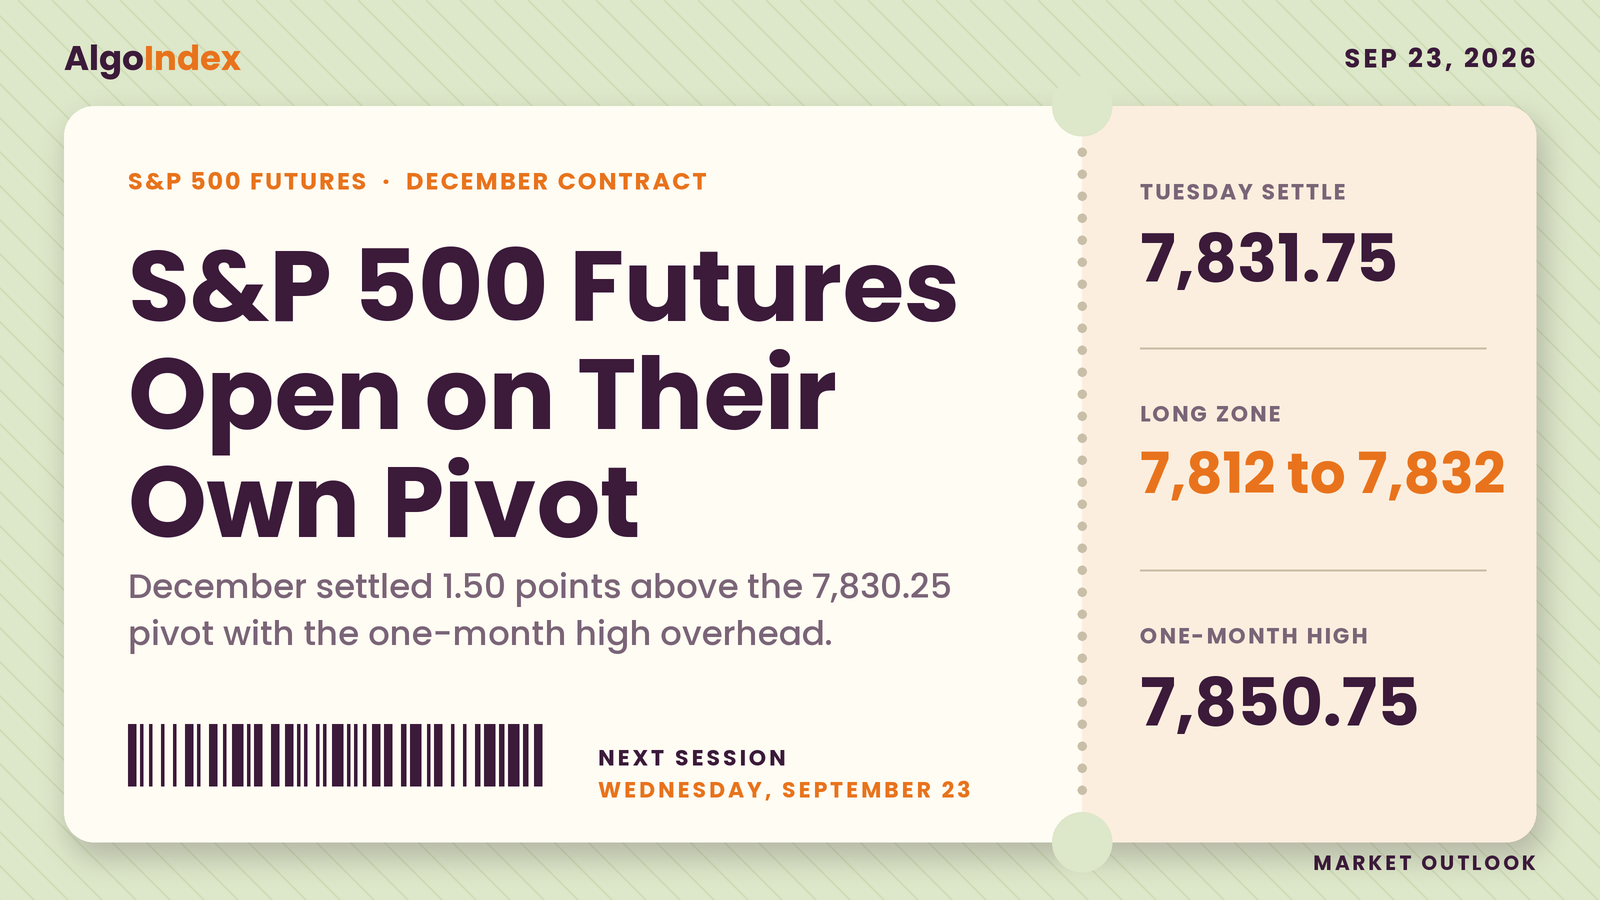
S&P Futures 7,831.75: Long 7,812 to 7,832 Under 7,850
December S&P futures settled at 7,831.75 on a 38 point day, 1.50 points above the pivot. Levels, the 7,812 to 7,832 long and Wednesday's calendar.
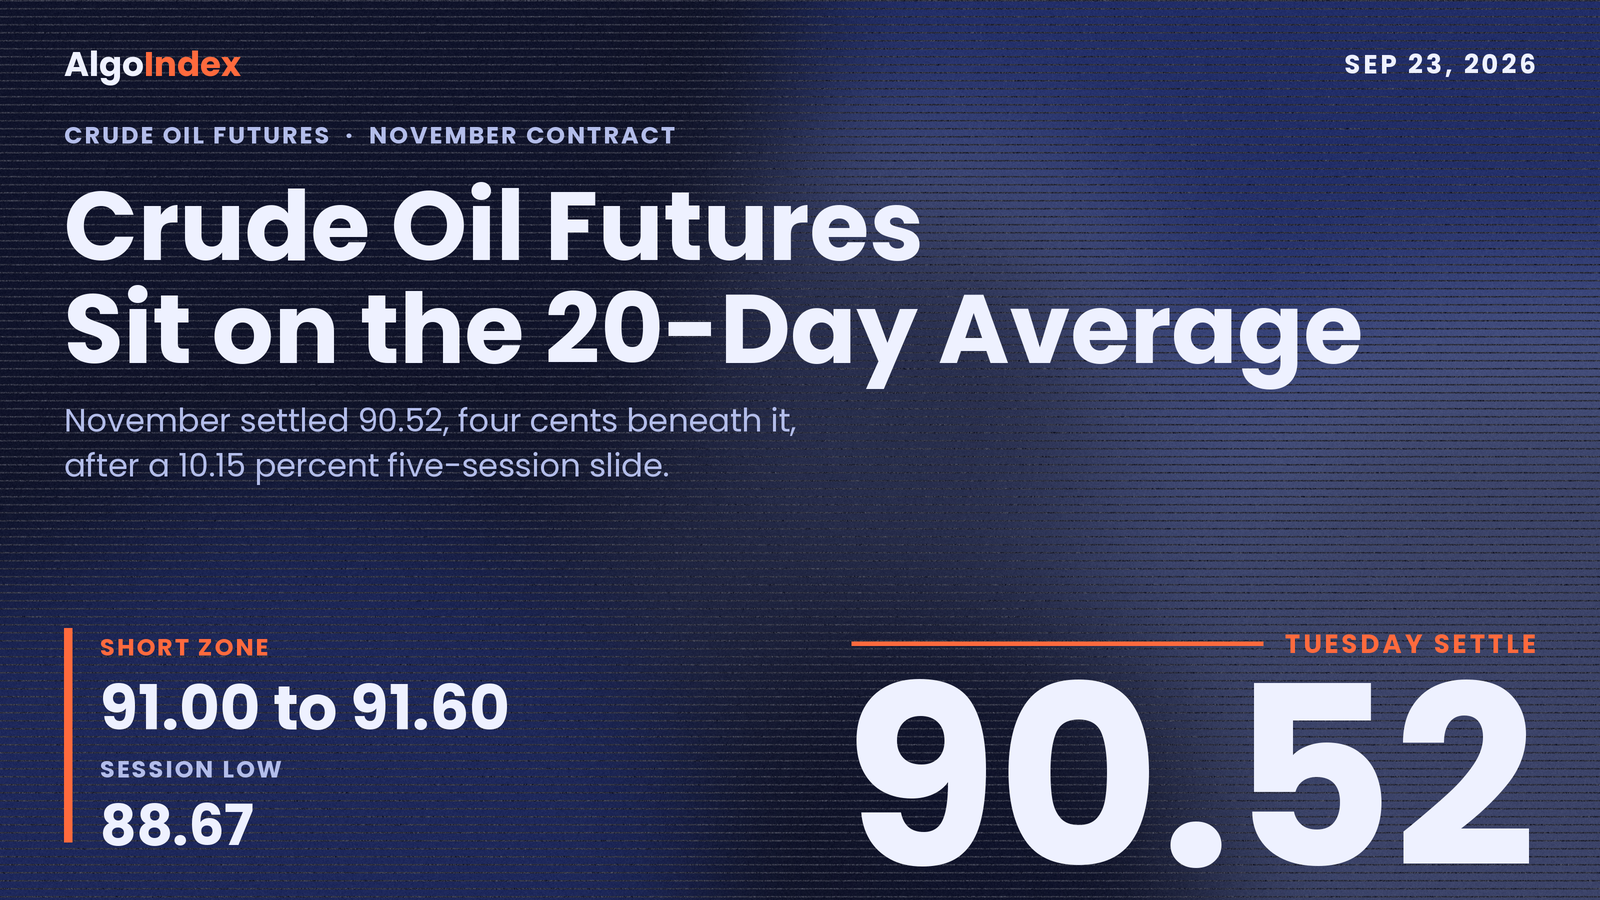
Crude Settles 90.52 at the 20-Day, Short Under 91.01
November WTI slid 1.85 to 90.52 as diplomacy drained the supply premium, four cents under its 20-day. Levels, the 91.00 short and the 10:30 AM report.
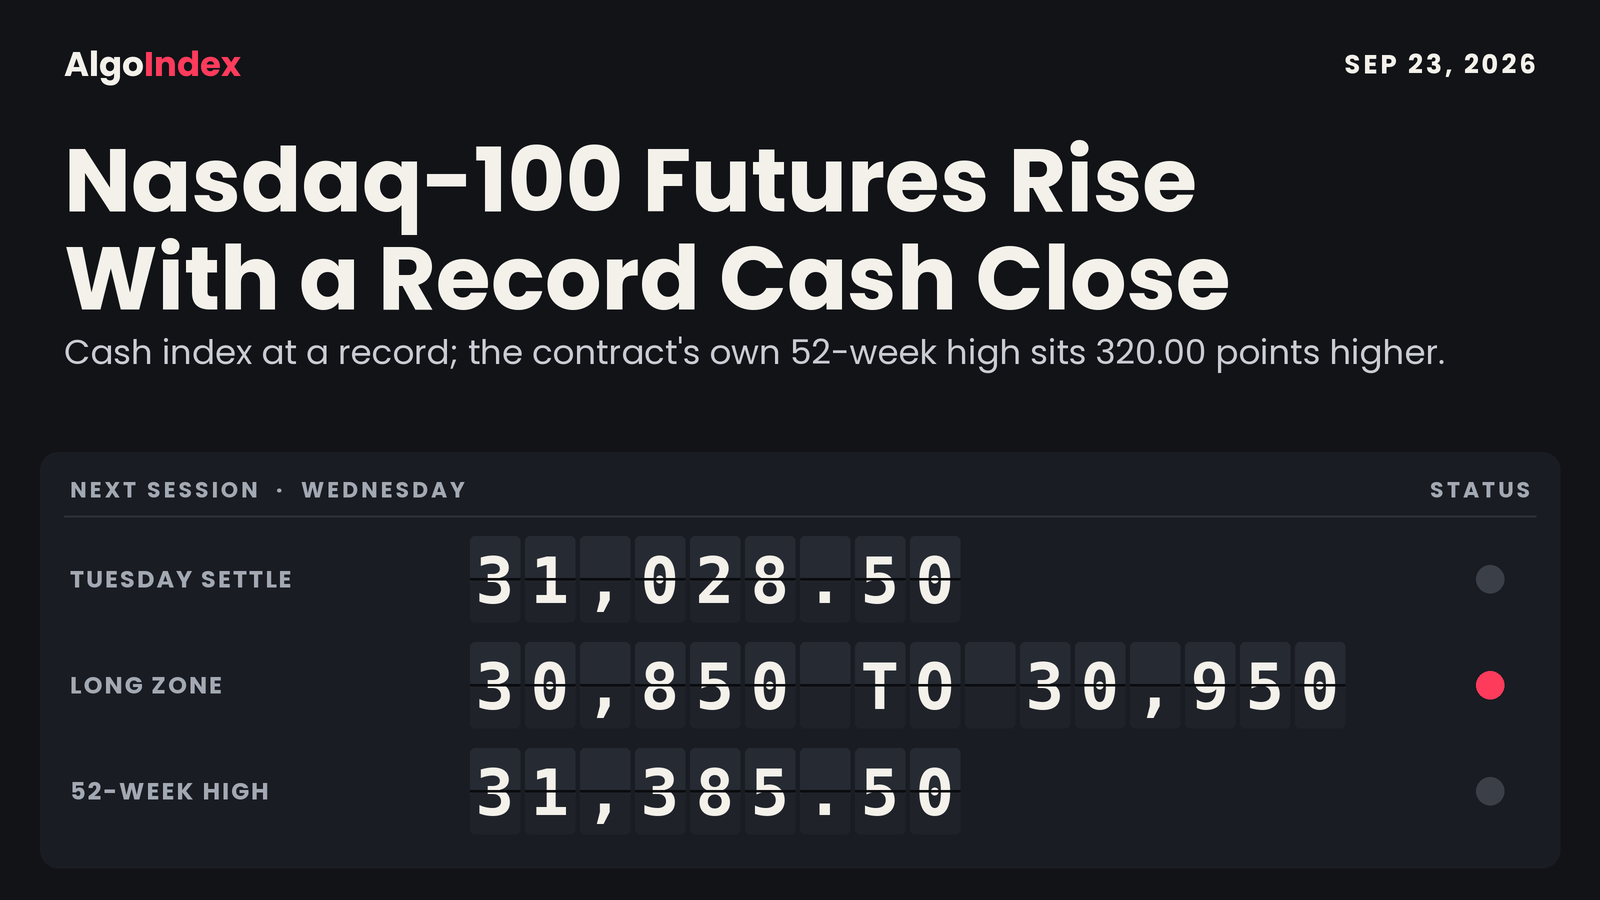
Nasdaq-100 Futures Settle 31,028.50, Stochastic at 98.16
December Nasdaq-100 futures settled at 31,028.50, 90.6 percent up a 395.50 point range. Levels, the 30,850 to 30,950 long and Wednesday's flash survey.
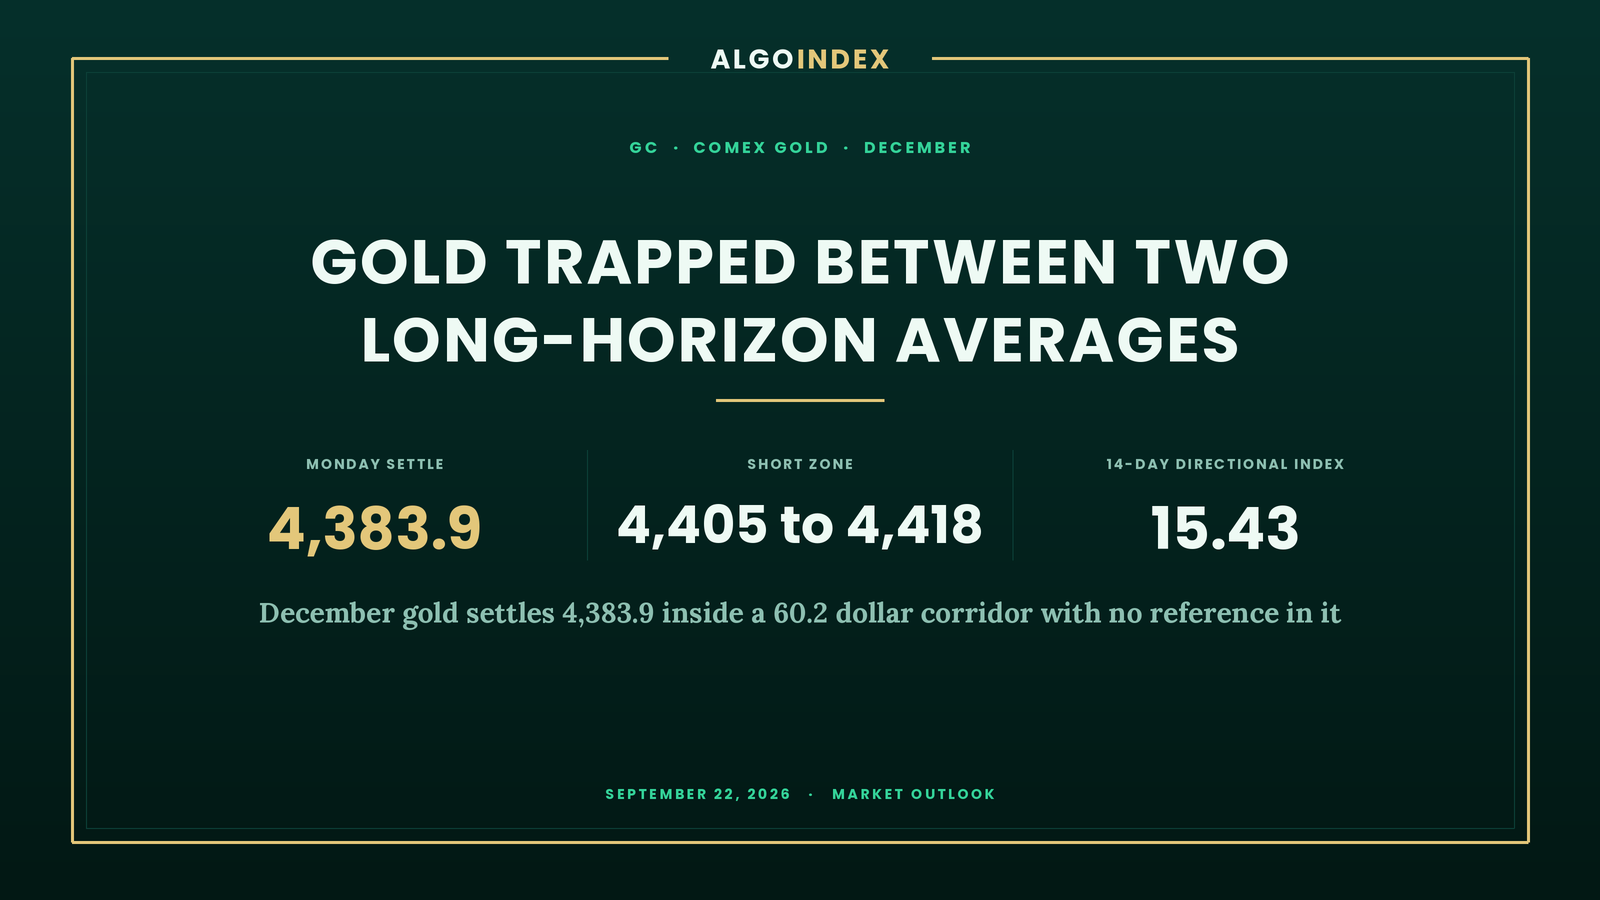
Gold Settles 4,383.9 Inside a 60.2 Dollar Corridor
December gold settled 4,383.9, 4.9 beneath its pivot, inside a 60.2 dollar moving-average corridor. Levels, the 4,405 to 4,418 short and a 15.43 trend read.
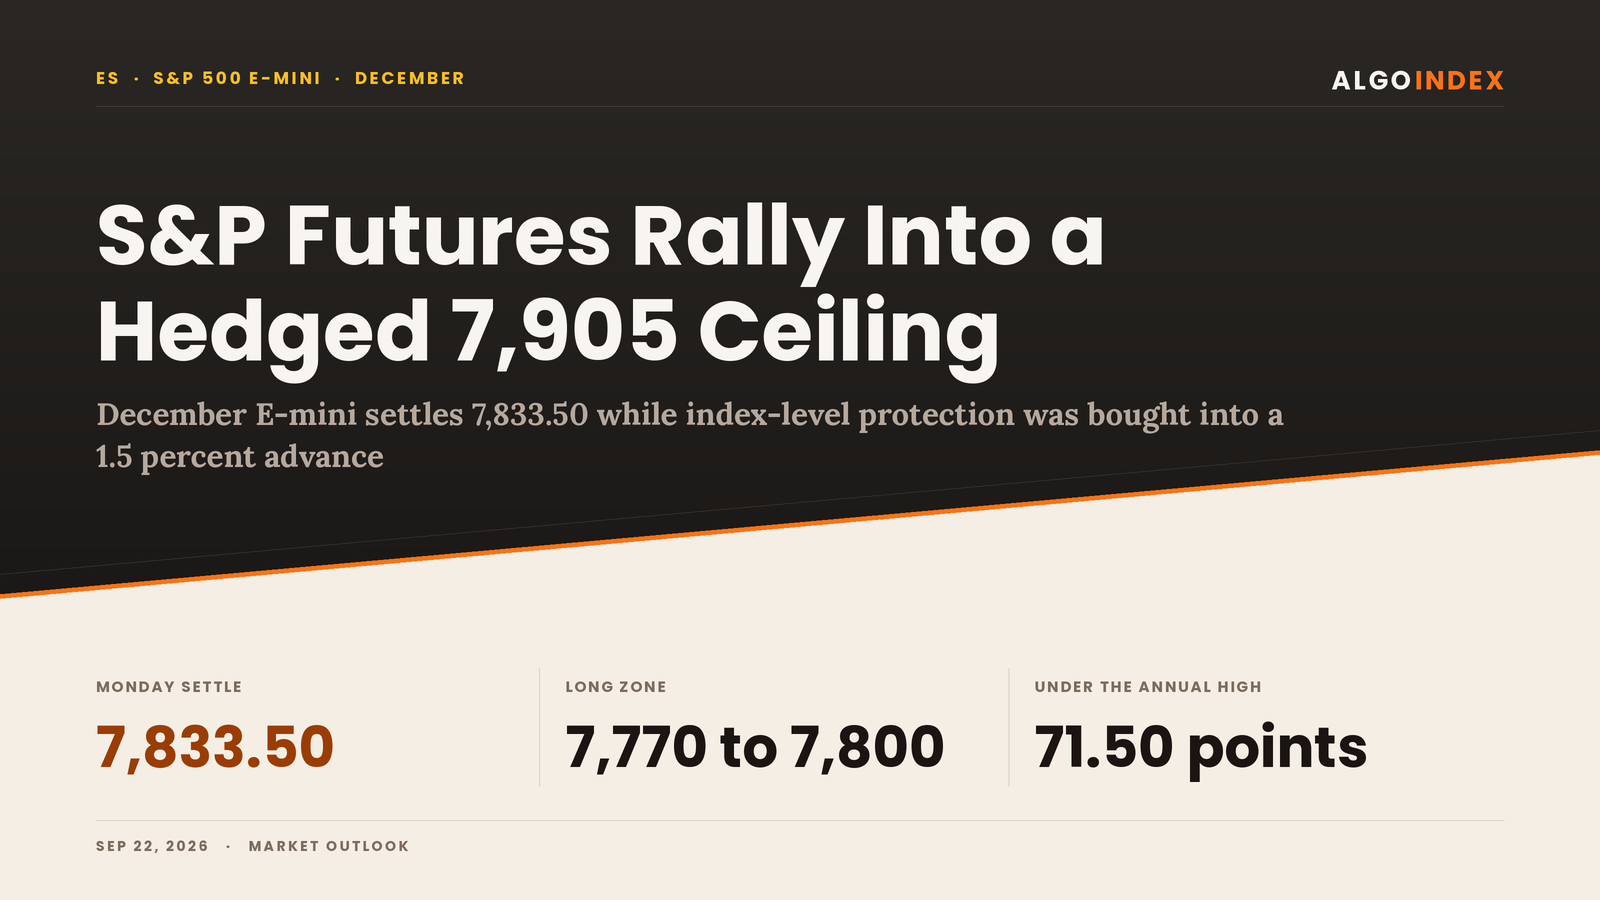
S&P Futures 7,833.50: Long the Pullback to the 7,798 Pivot
December S&P futures settled at 7,833.50, 89.7 percent up the day's range and 0.91 percent under the annual high. Levels, the 7,770 to 7,800 long and Tuesday.
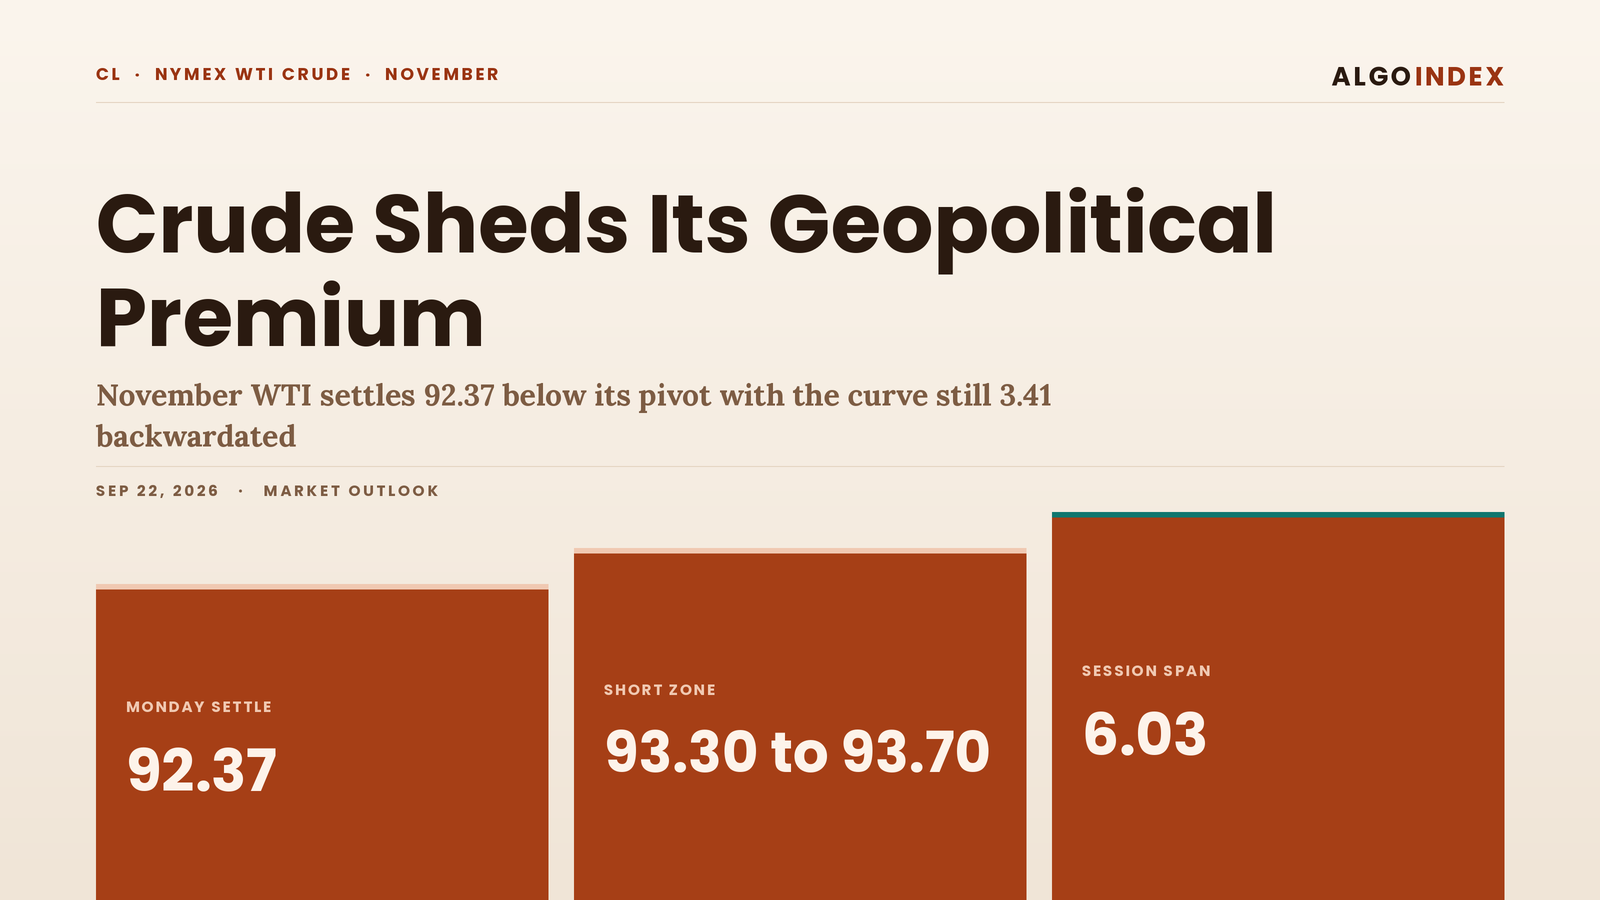
Crude Settles 92.37, Short Into the 93.59 Pivot
November WTI gave up 6.03 dollars to settle 92.37 as diplomacy drained the supply premium. Levels, the 93.30 short and a 3.41 backwardation.
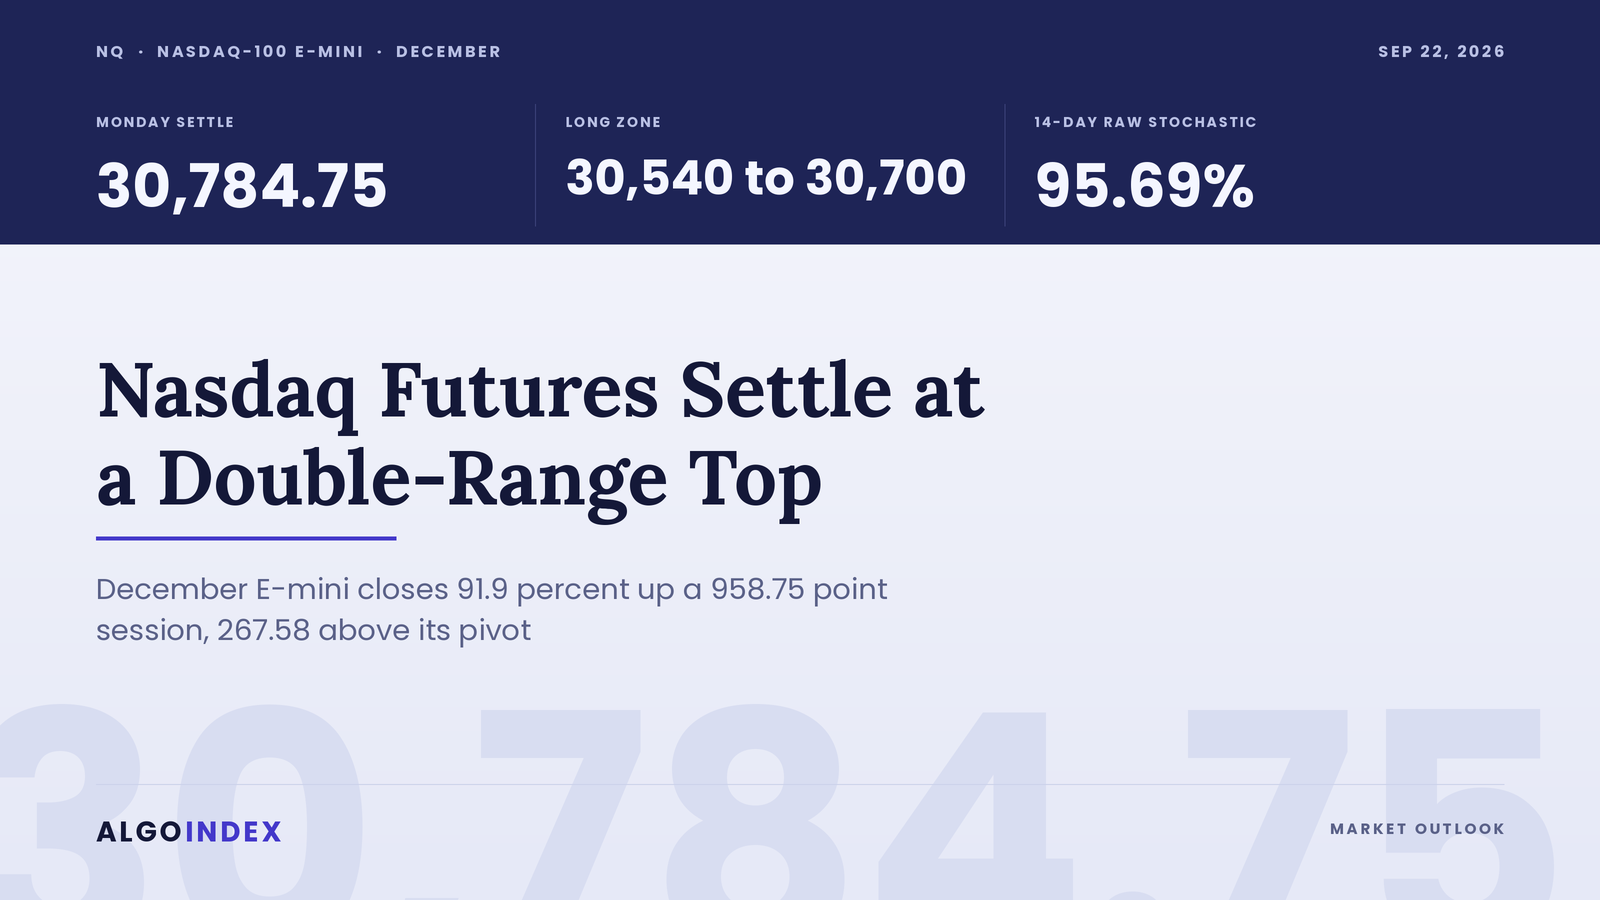
Nasdaq-100 Futures Settle 30,784.75, a Double-Range Day
December Nasdaq-100 futures settled at 30,784.75 after a span twice their 14-day average true range. Levels, the 30,540 to 30,700 long and Tuesday's auction.