
Market Outlook
Institutional ES futures and SPY options research, gamma levels, and key zones for trading the S&P 500.

S&P 500: The Consumer Cracked and the Market Barely Moved
Retail sales fell 0.6 percent and sentiment collapsed to 51, yet the S&P closed down just 0.22 percent, a failed record. Why Monday buys the 7,794 pivot into a 49-hour weekend.
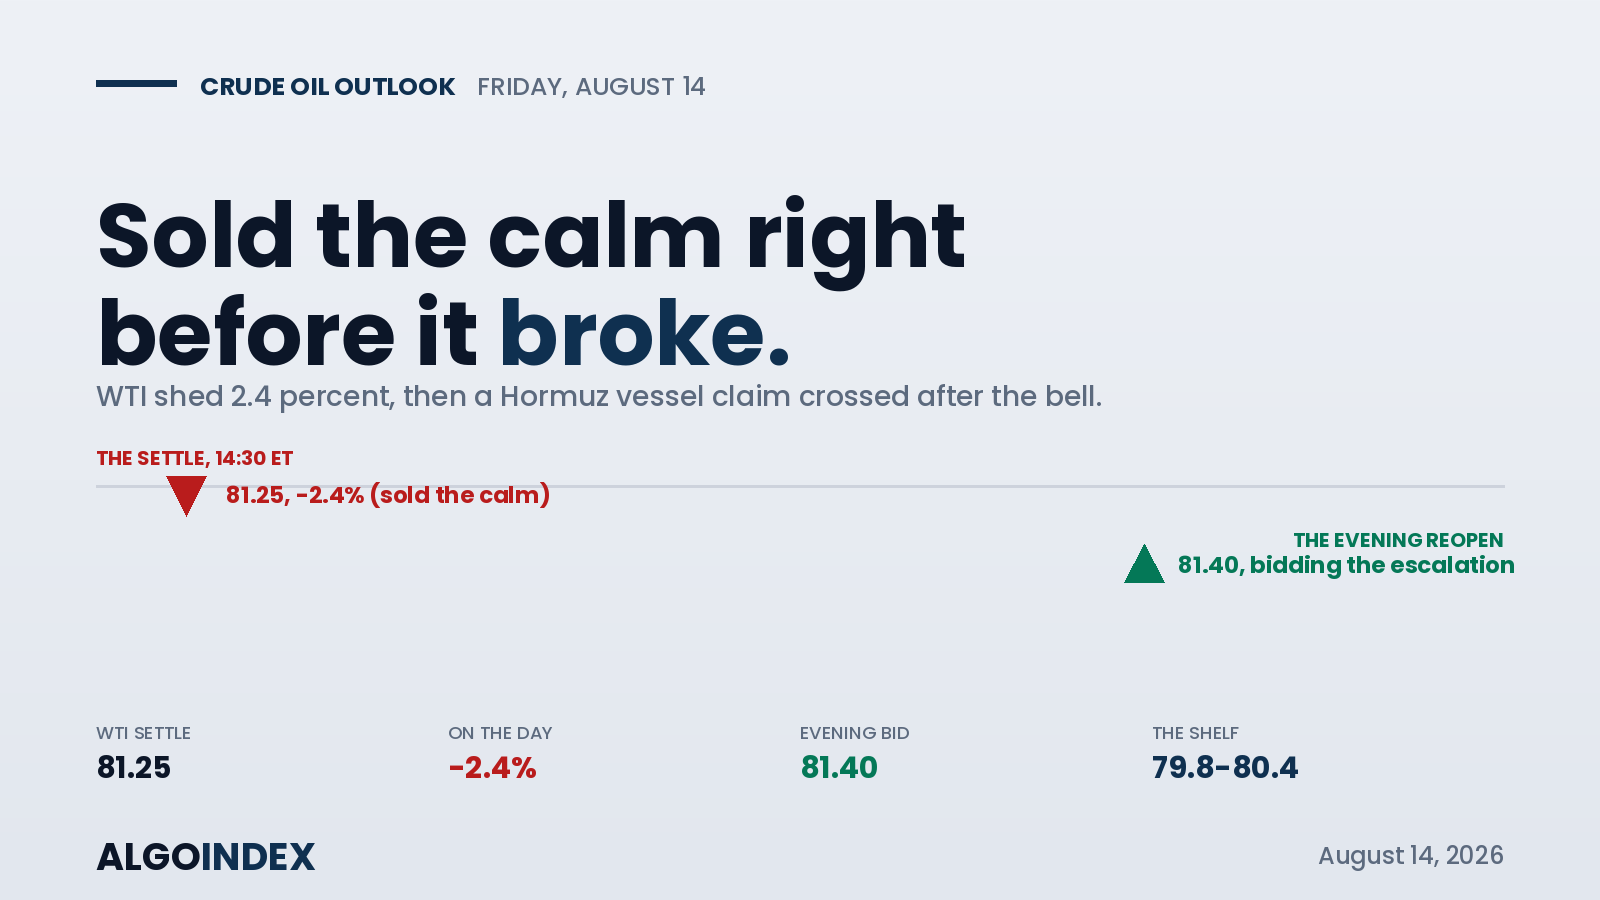
Crude Oil: Sold the Calm Right Before It Broke
WTI shed 2.4 percent to settle 81.25 on de-escalation, then a Hormuz vessel claim crossed after the bell and the evening bid it back. Why the 79.8 to 80.4 shelf is the long.
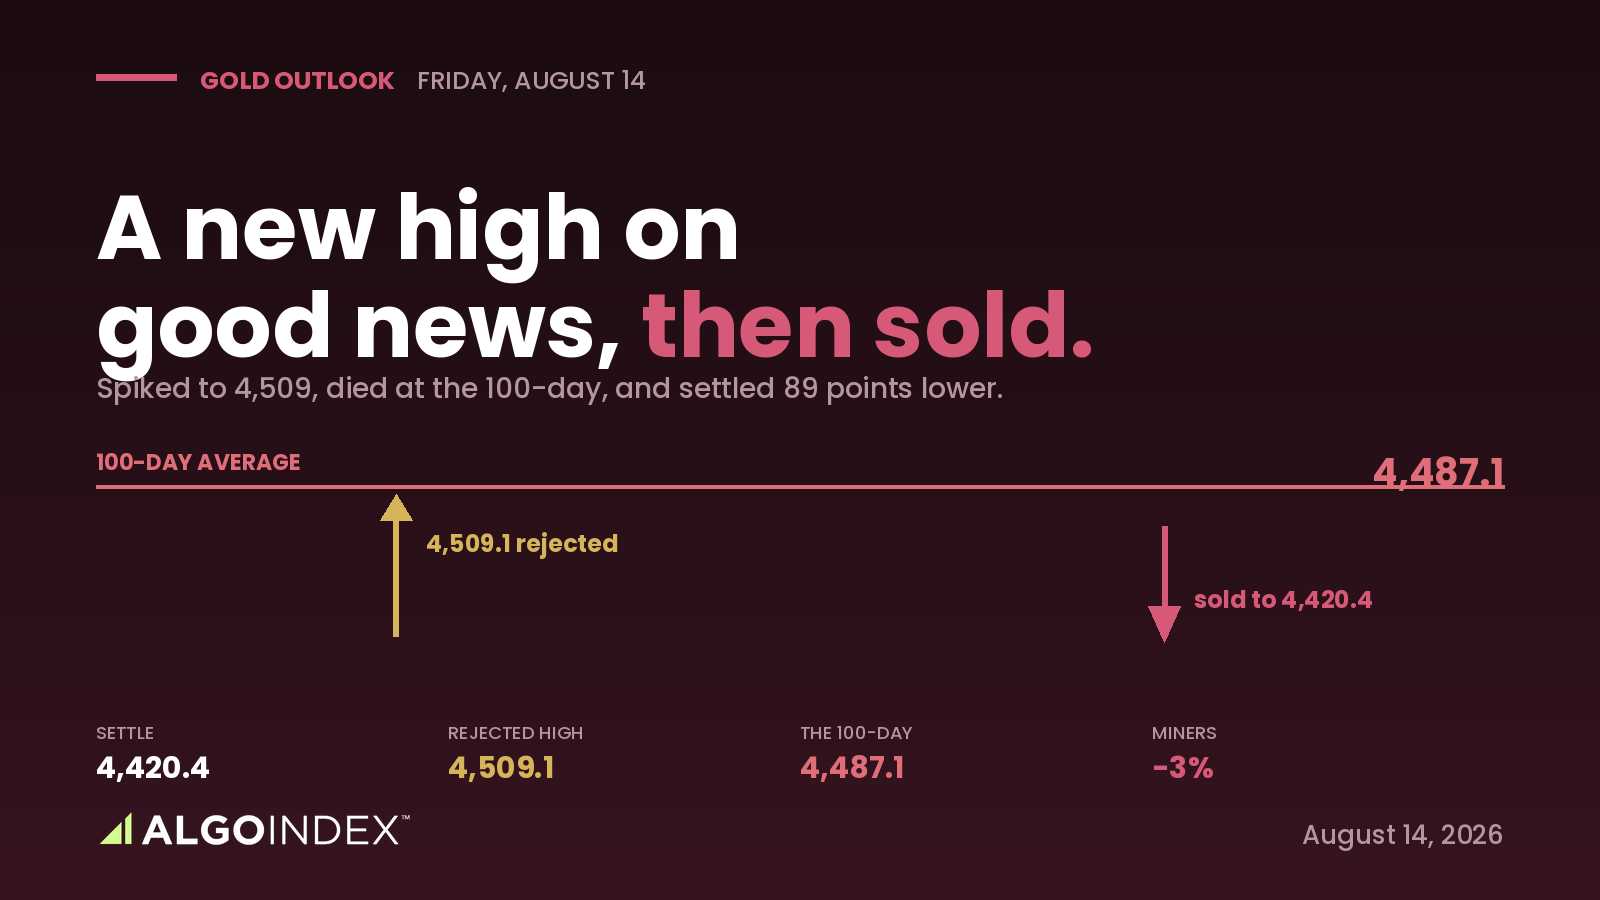
Gold: Made a New High on Good News, and Sold It
Gold spiked to a one-month high at 4,509, then sold back below its 100-day average for a second day to settle 4,420. Why the trade fades the 4,458 to 4,486 band into Friday.
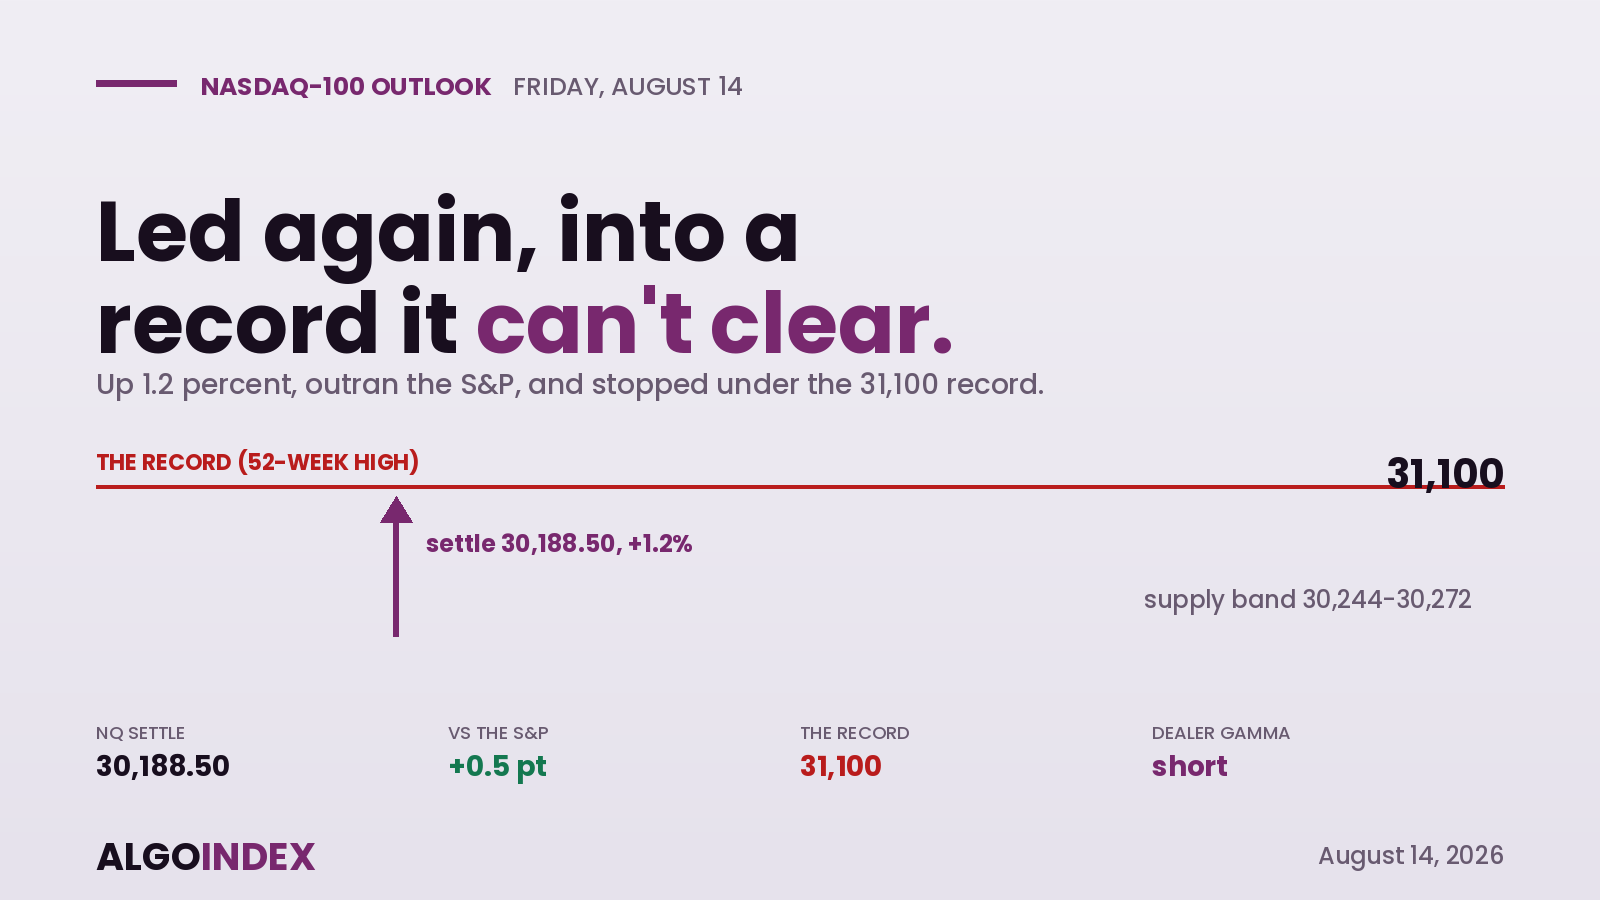
Nasdaq 100: Led Again, Into a Record It Can't Clear
NQ led the market up 1.2 percent to 30,188.50, then stopped under the dense supply band below its 31,100 record. Why the 29,900 shelf is the buy into Friday's data.
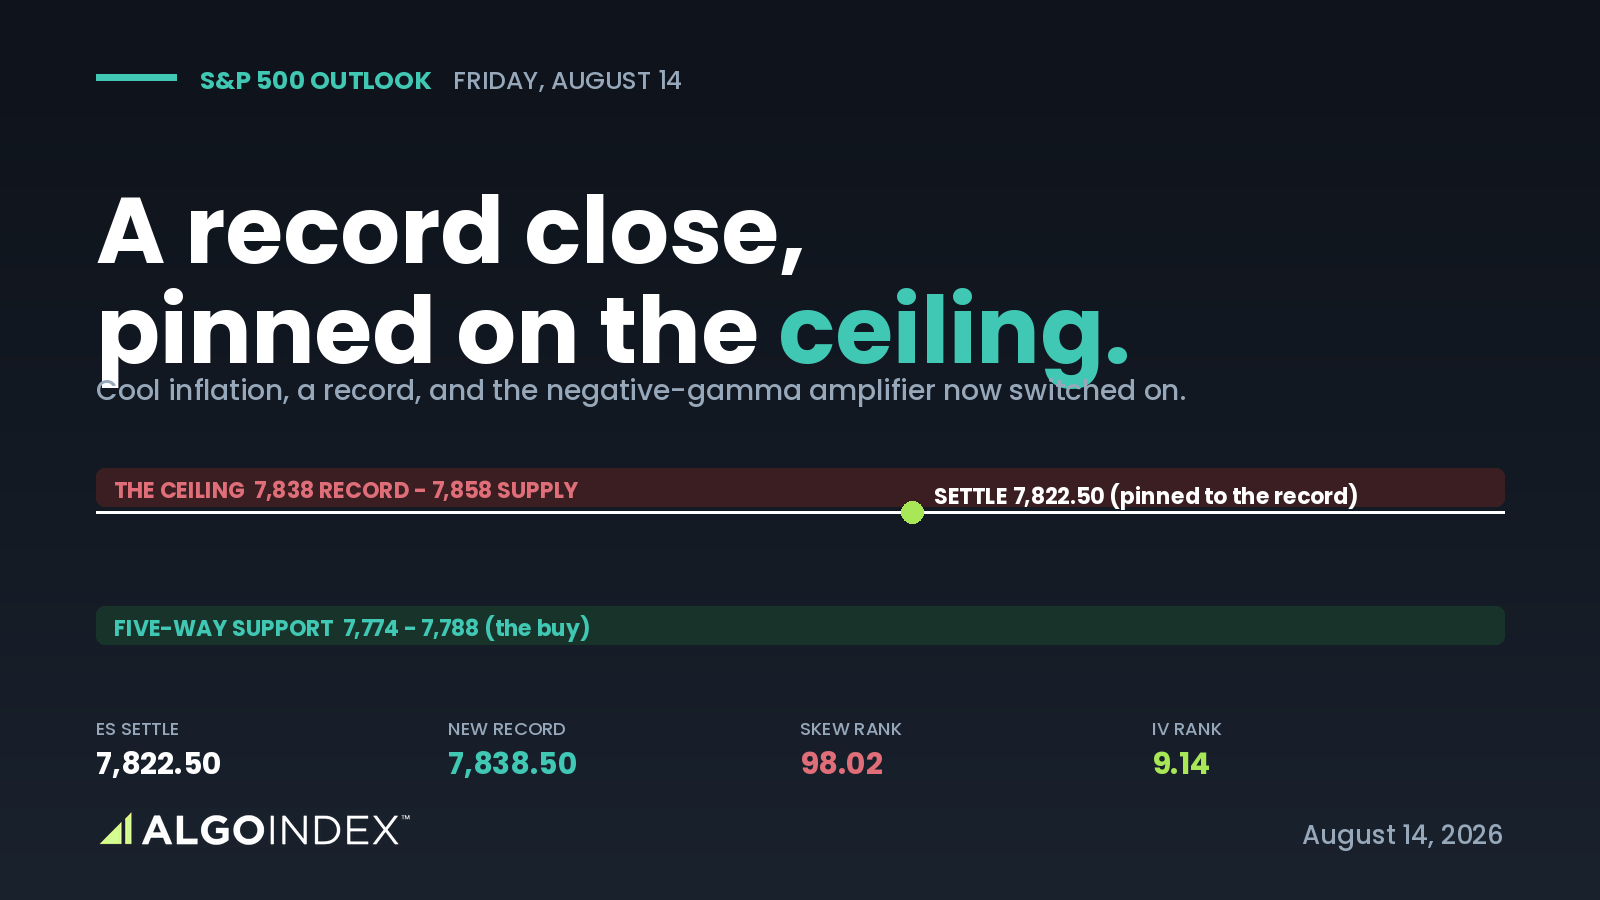
S&P 500: A Record Close Pinned on the Ceiling
The S&P closed at a record 7,822.50, pinned on its dealer ceiling in negative gamma. Why Friday's plan buys the 7,774 to 7,788 support, not a chase into the record.
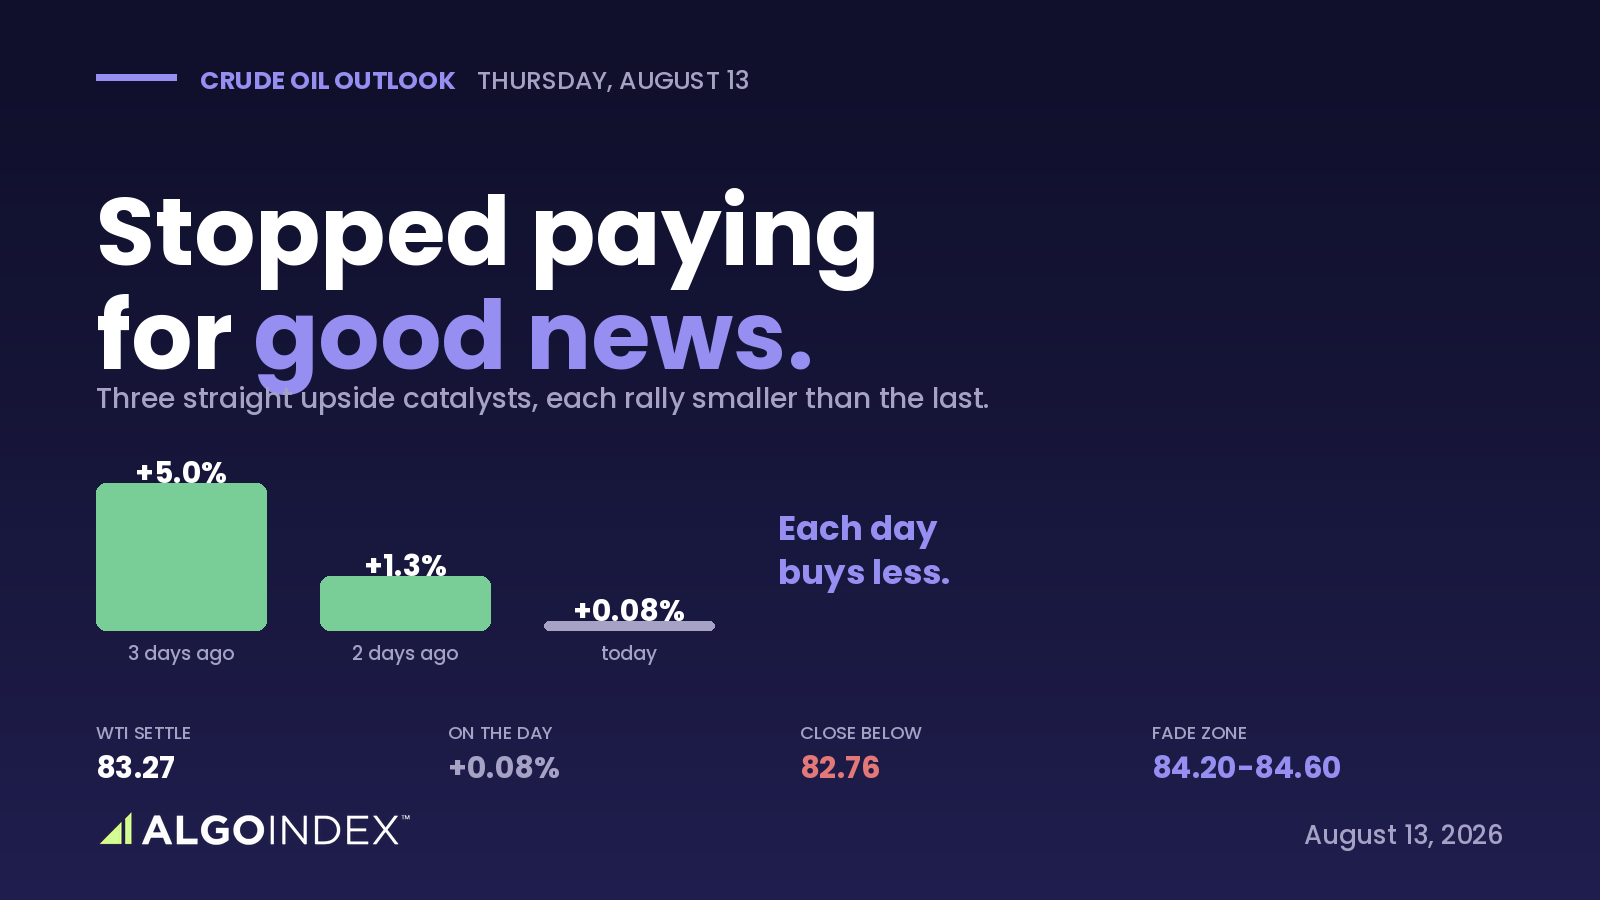
Crude Oil: Stopped Paying for Good News
Crude settled at 83.27 but its rally is fading, up 5 percent, then 1.3, then 0.08, and it closed below the settle. Why the trade sells the 84.20 to 84.60 zone into PPI.
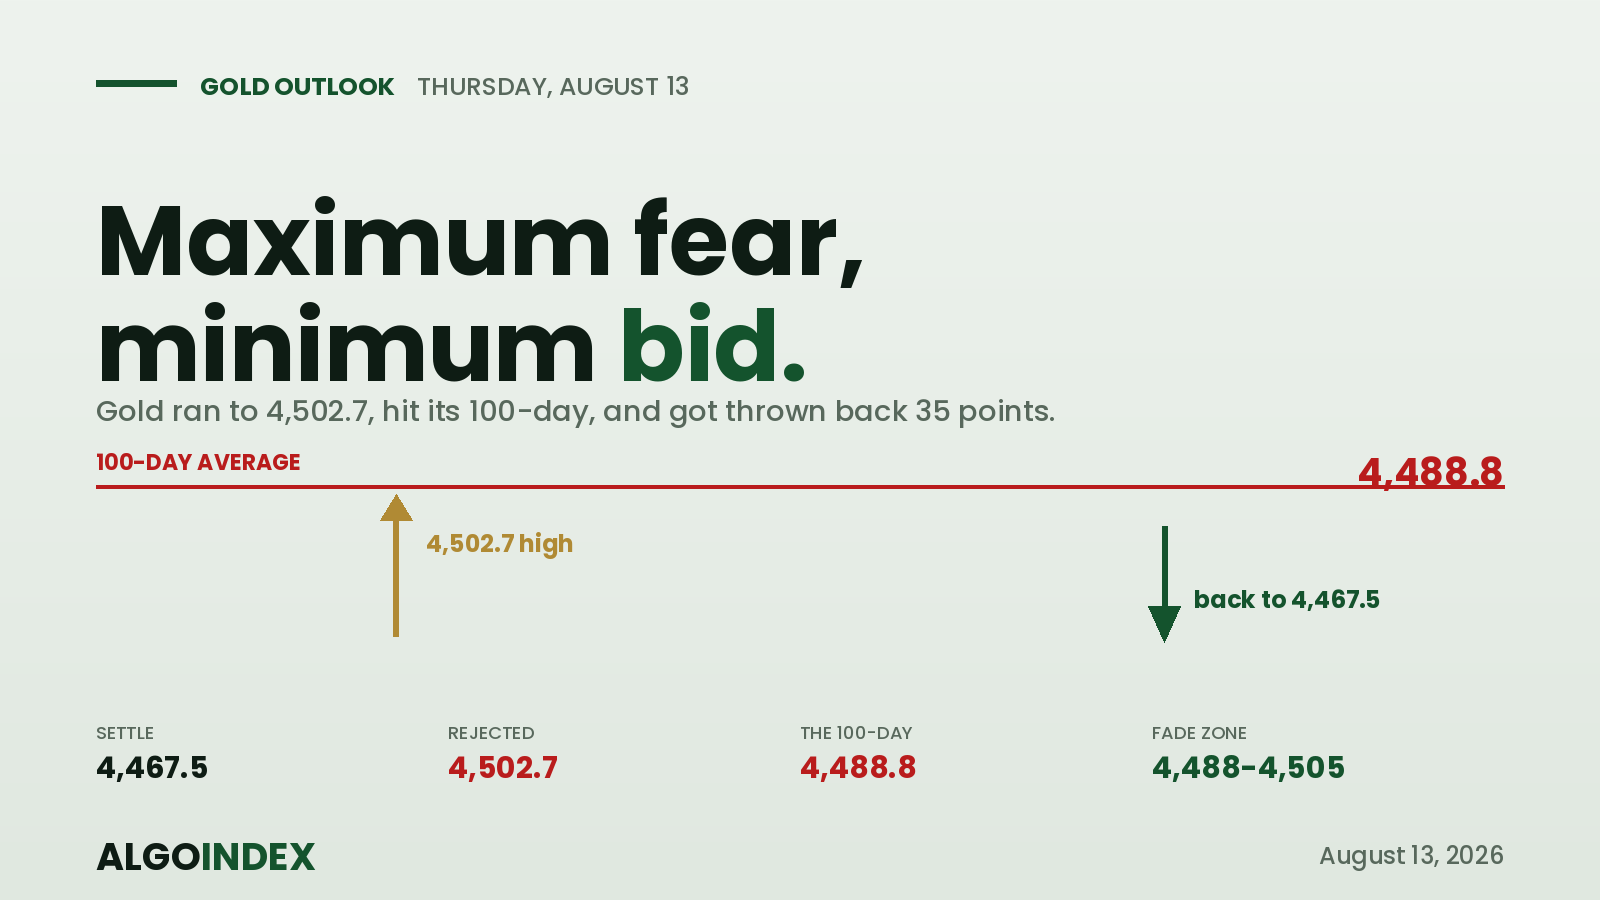
Gold: Maximum Fear, Minimum Bid
Gold ran to 4,502.7, got rejected at its 100-day average, and gave back 35 points to 4,467.5. Why the trade fades the 4,488 to 4,505 zone into Thursday's PPI.
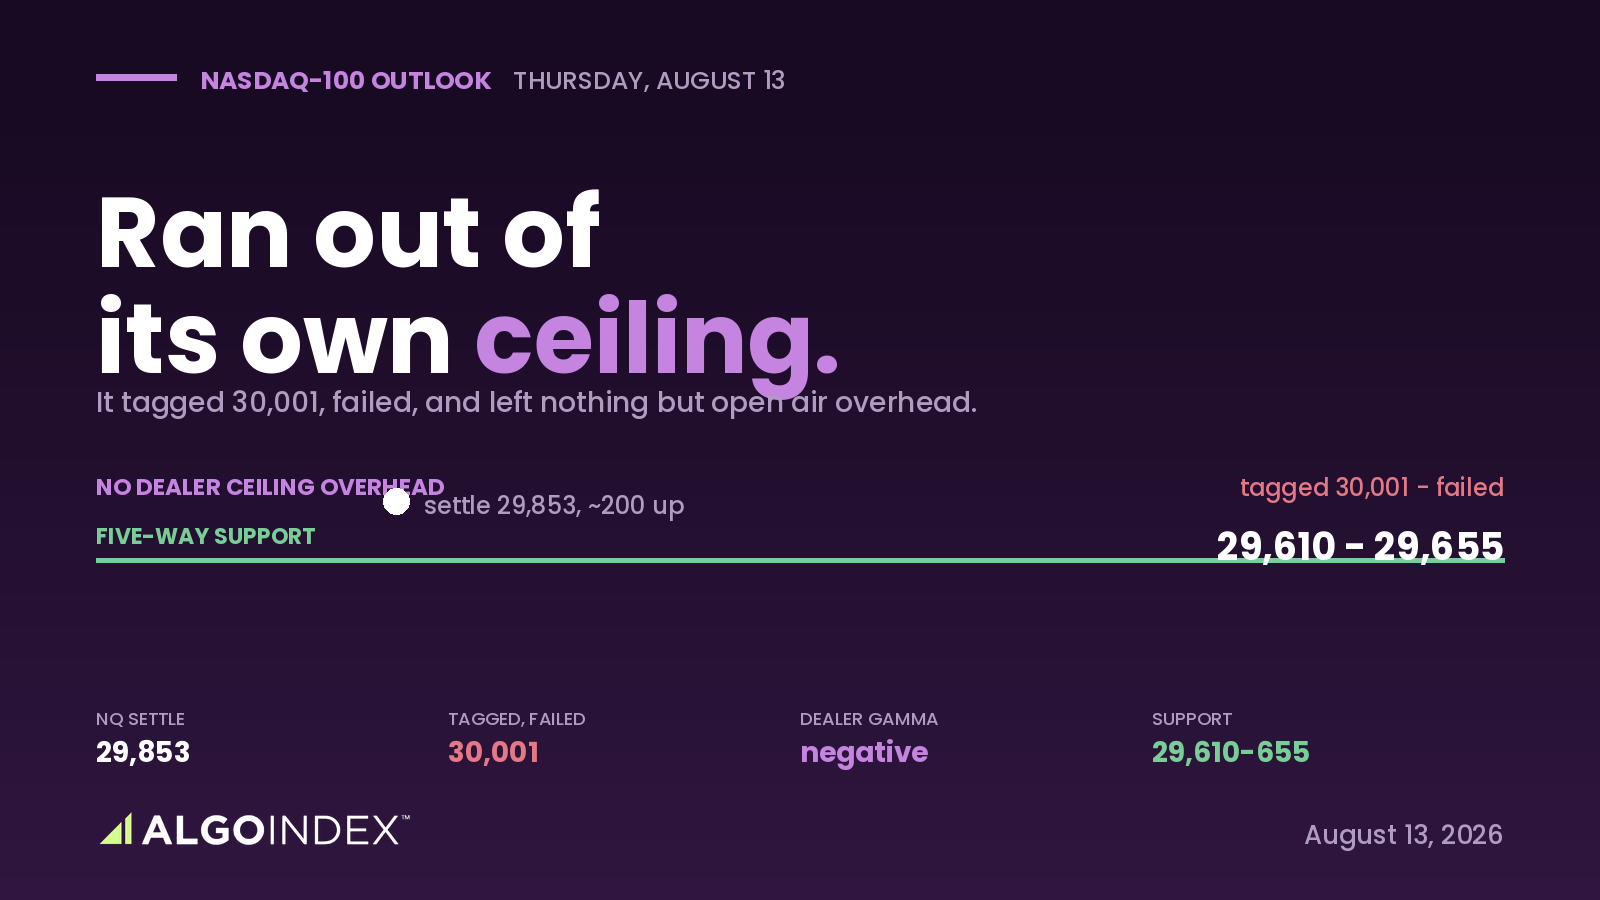
Nasdaq 100: Ran Out of Its Own Ceiling
NQ tagged 30,001, failed, and settled at 29,853 with negative gamma on both sides and no dealer ceiling overhead. Why the 29,610 support is the buy into Thursday's PPI.
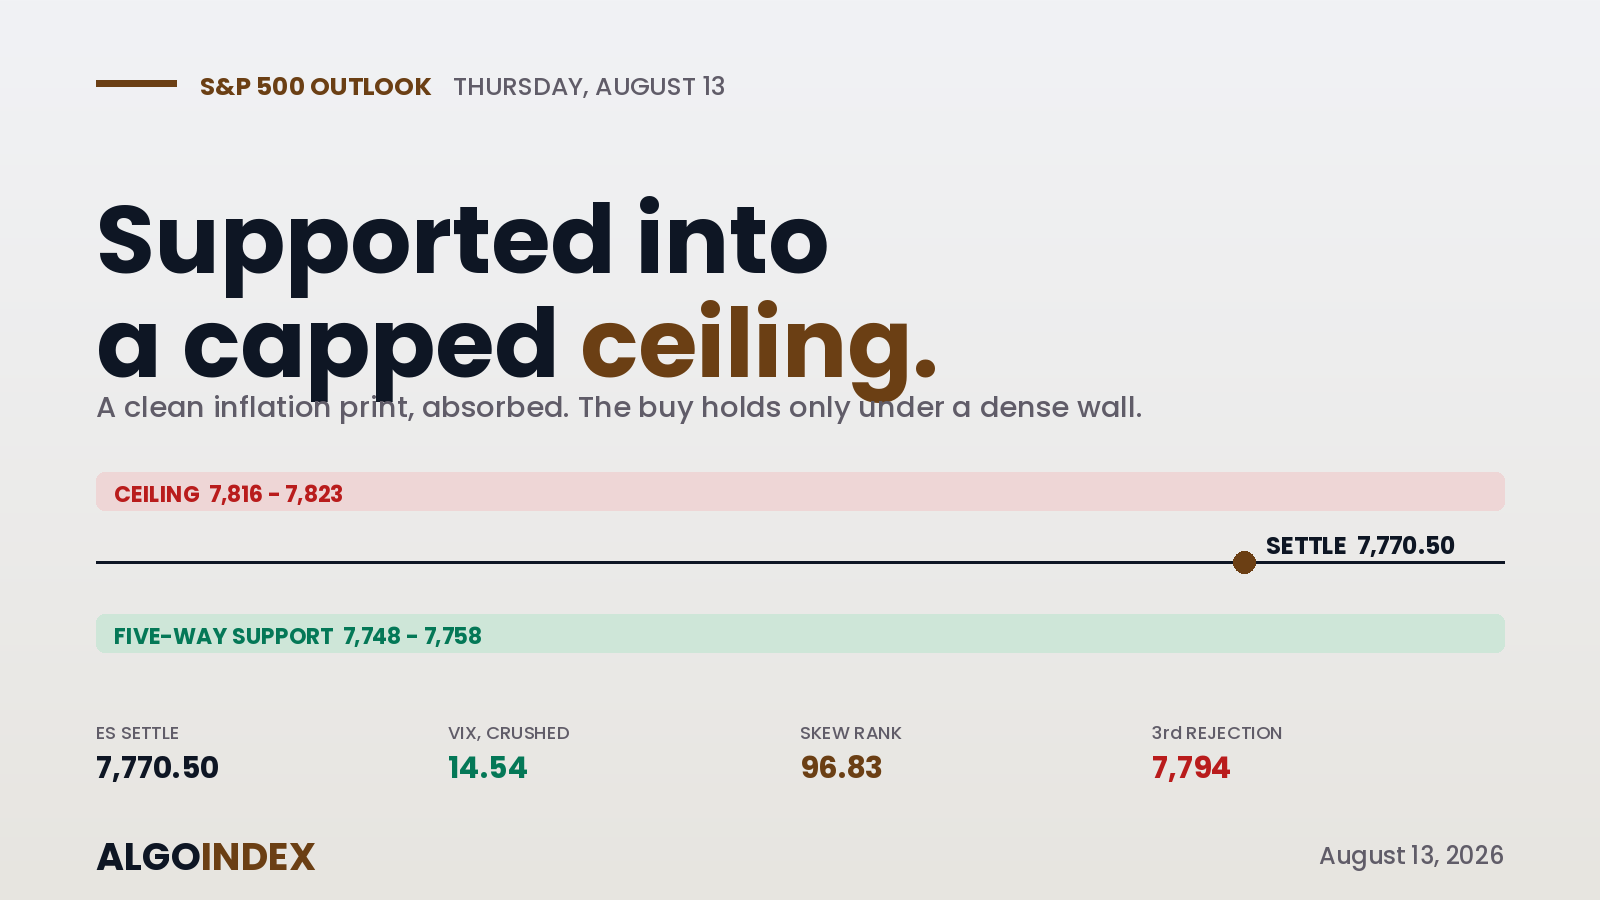
S&P 500: Supported Into a Capped Ceiling
The S&P absorbed an in-line CPI with positive gamma dampening. Why Thursday's PPI-day setup buys the 7,748 to 7,758 support beneath a capped 7,816 ceiling.
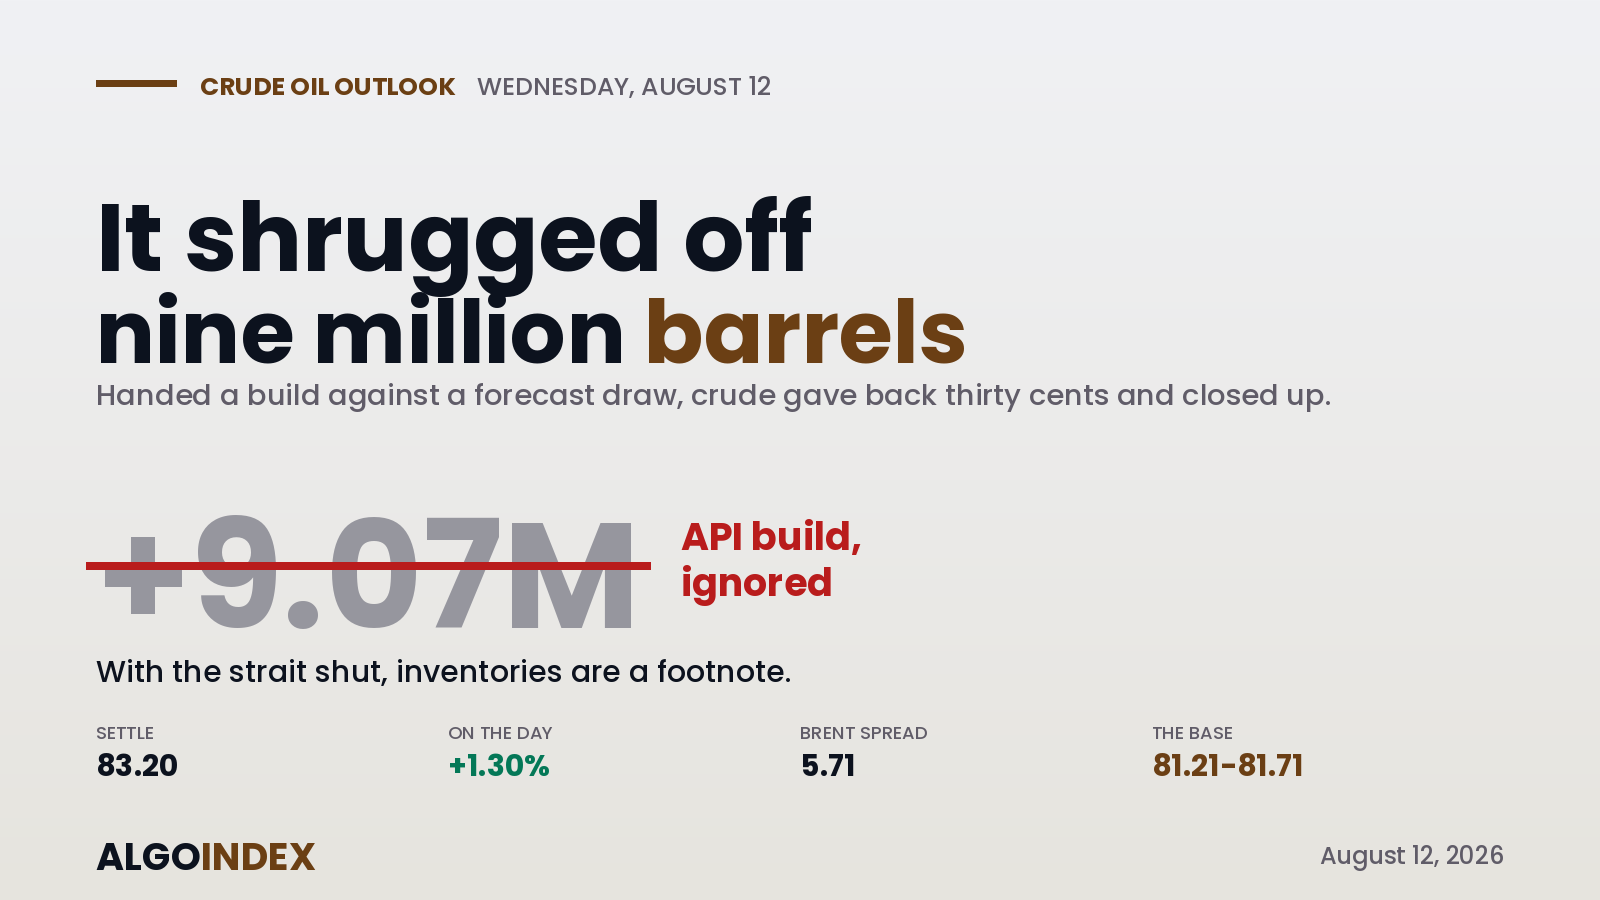
Crude Oil: Shrugging Off a Nine-Million-Barrel Build
Crude gave back thirty cents on a 9-million-barrel API build and closed up 1.3%. With the Strait of Hormuz shut, why the 81.21 base is the long into CPI.
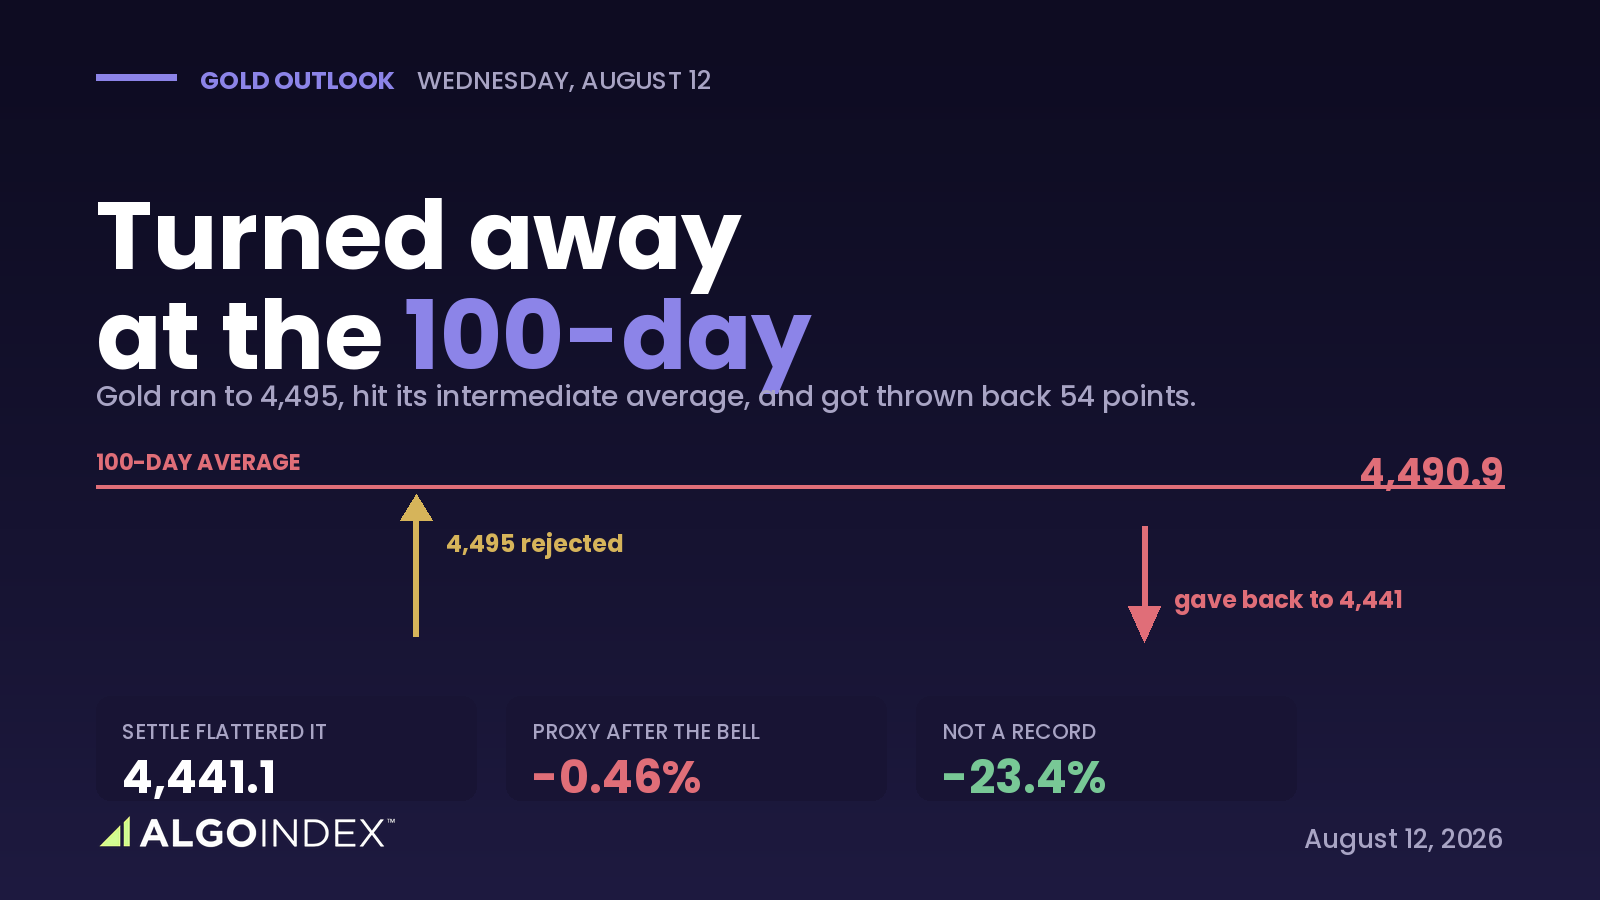
Gold: Turned Away at the 100-Day
Gold ran to 4,495, hit its 100-day average, and gave back 54 points while the settle flattered it. Why the trade is selling the 4,486 retest into CPI.
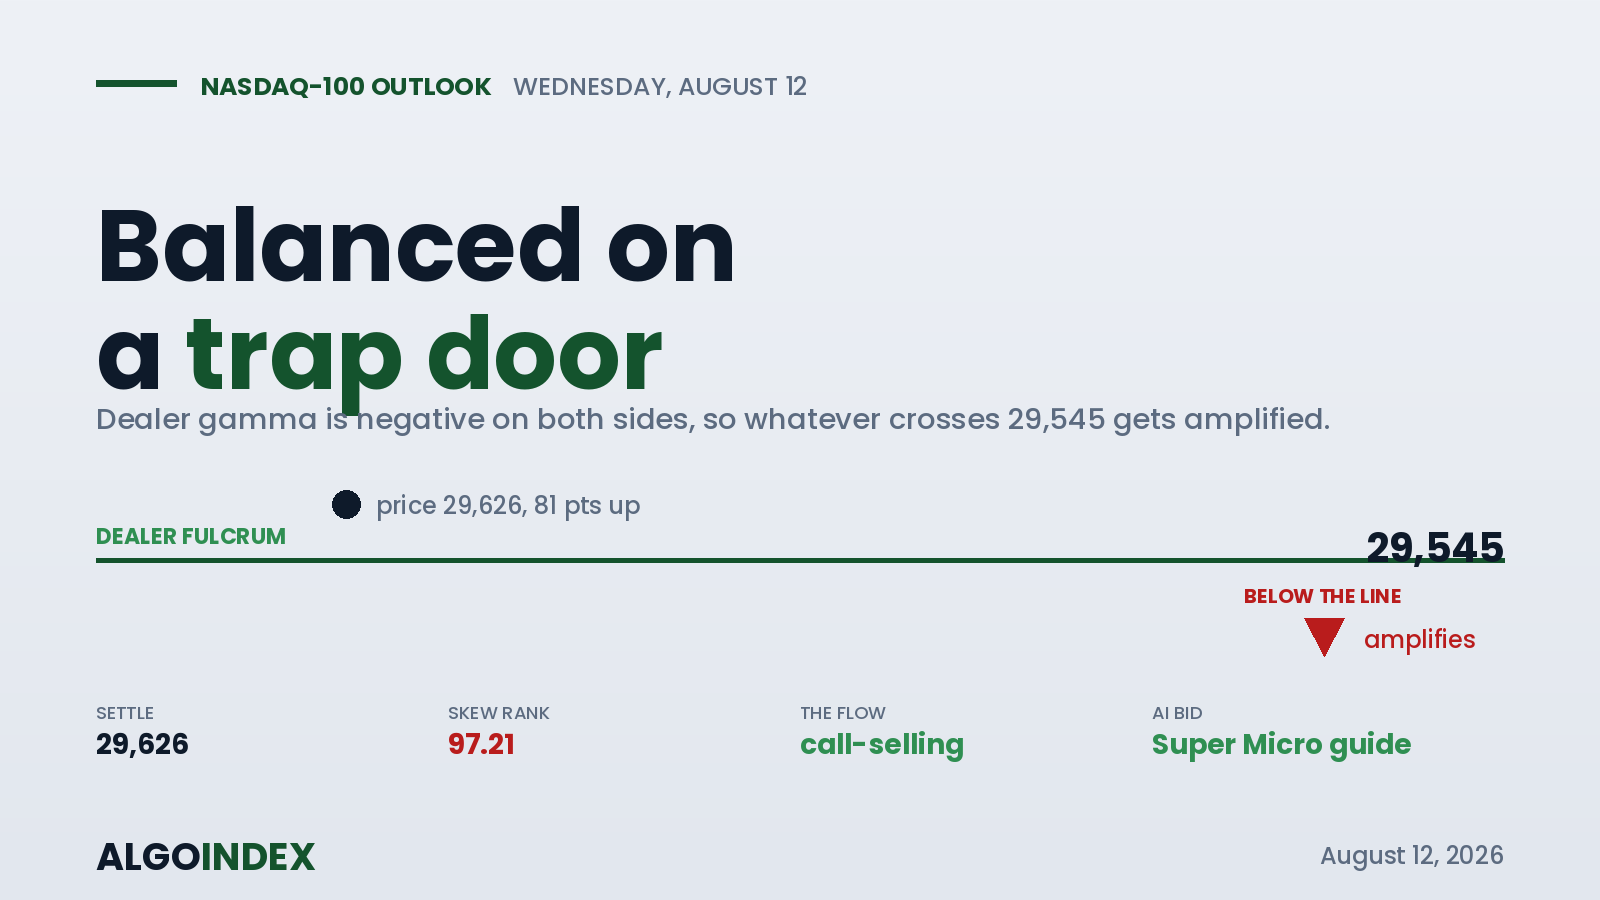
Nasdaq 100: Balanced on a Trap Door Into CPI
NQ closed on its dealer fulcrum at 29,545, where negative gamma amplifies any move. Why the fulcrum is the buy and a hot core print voids it.
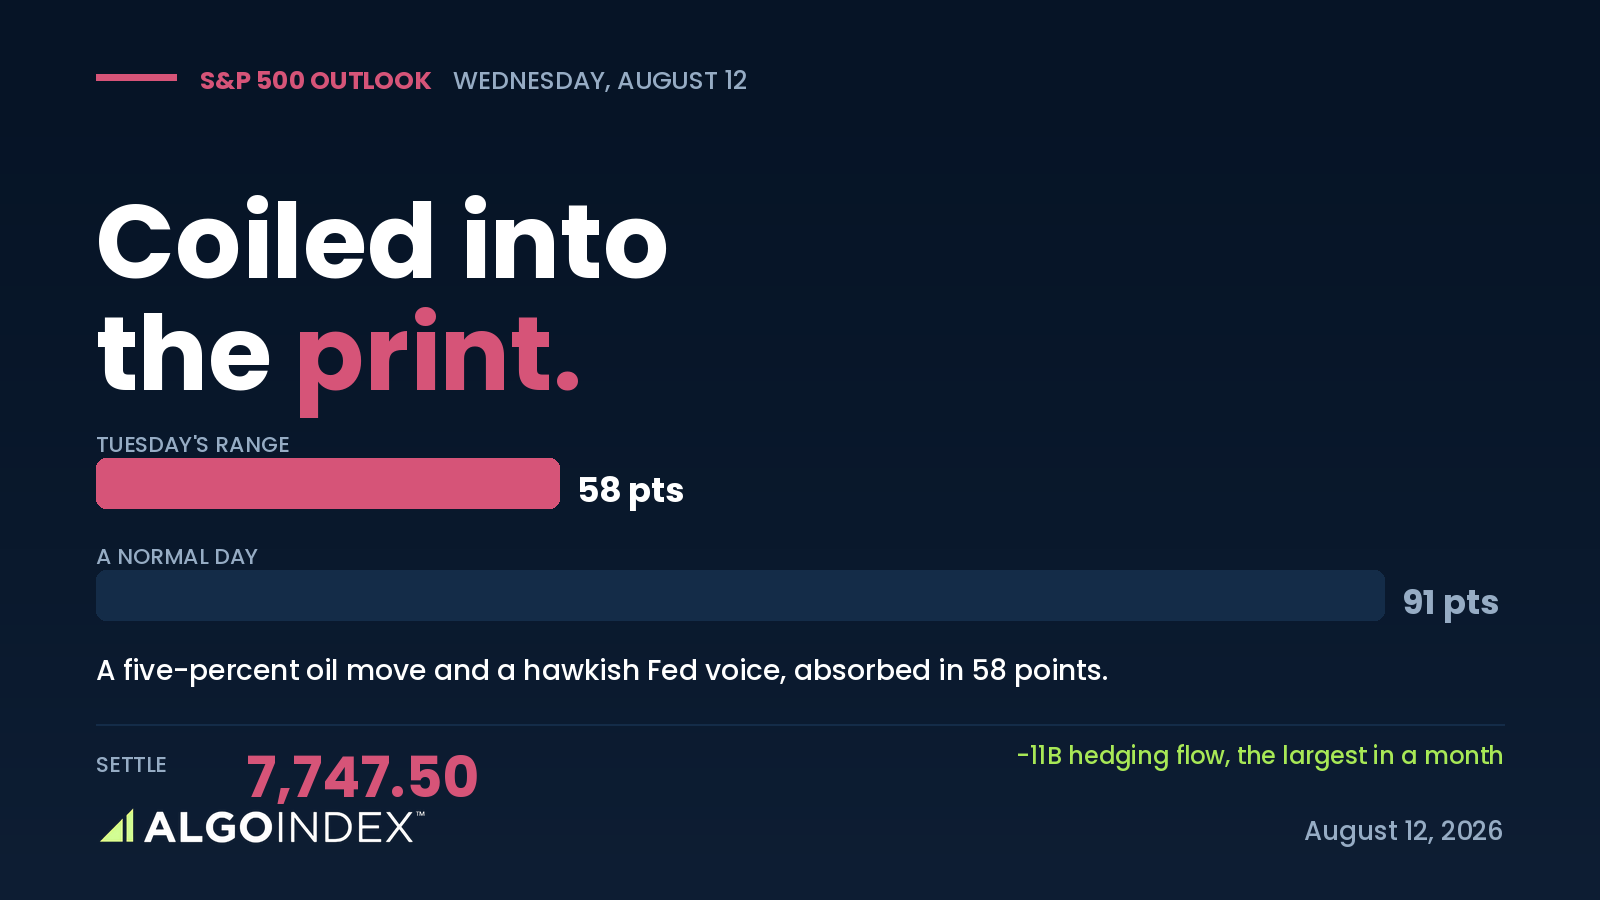
S&P 500: Compressed Into the CPI Print
The S&P absorbed its largest hedging outflow in a month in a 35-point range with hedges stripped. Why Wednesday's setup keys off the 7,743 inflection.
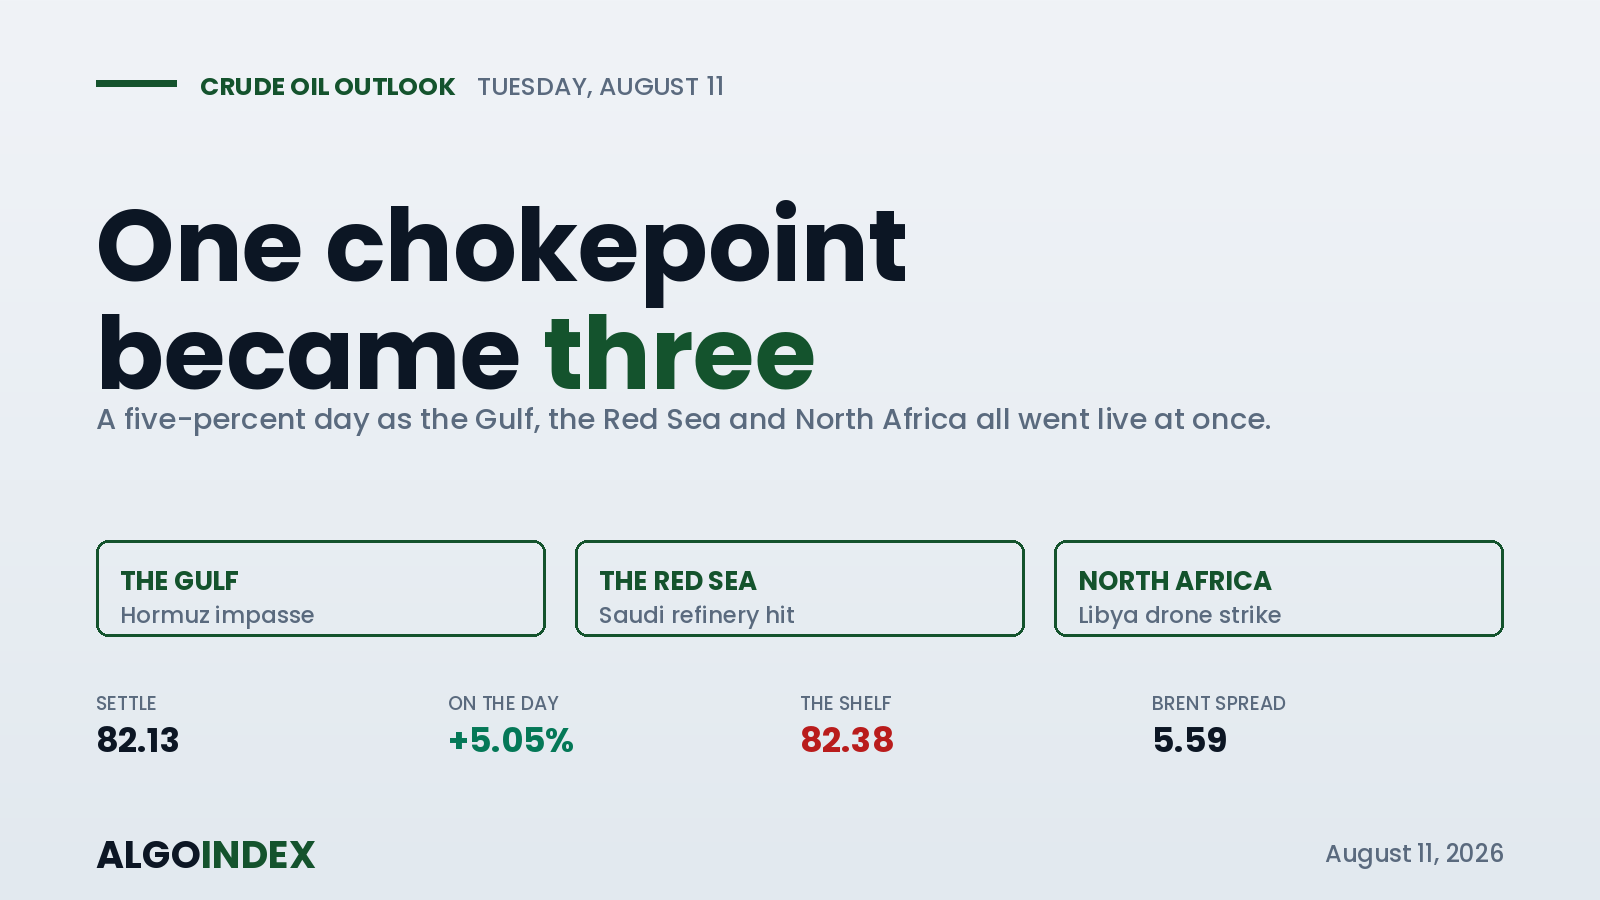
Crude Oil: One Chokepoint Became Three
WTI ran 5% as the Gulf, Red Sea and North African supply risks all went live. Why Tuesday's continuation long triggers only above the 82.38 shelf.
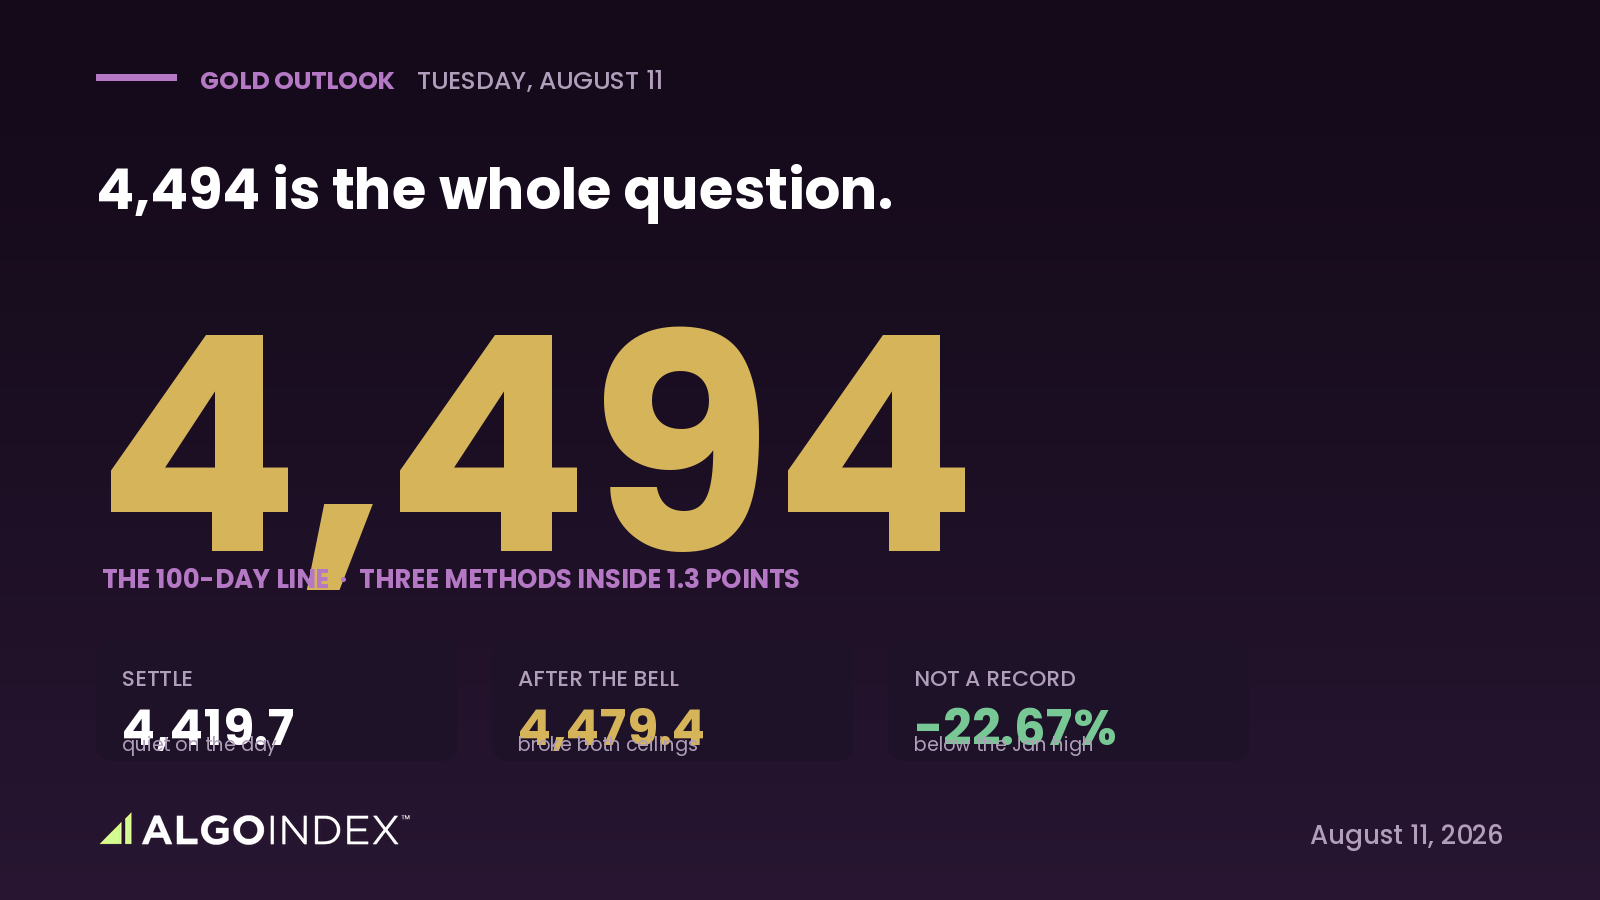
Gold: 4,494 Is the Whole Question
Gold's quiet settle hid an after-hours breakout to 4,479. Why the 100-day at 4,494 decides the trade, and why this is a recovery, not a record.
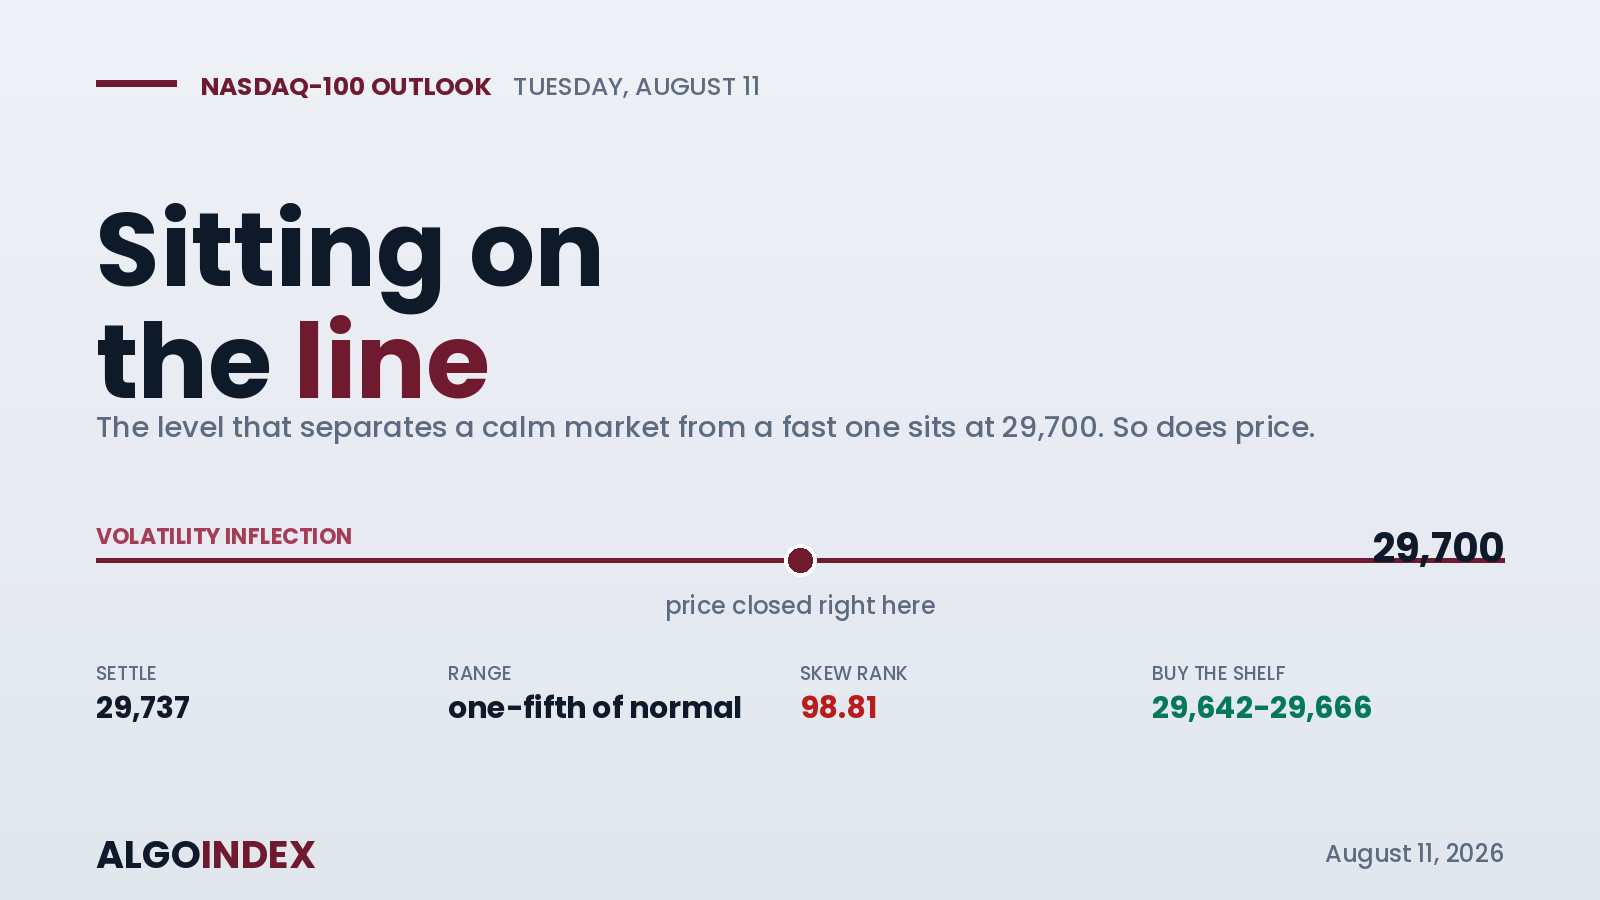
Nasdaq 100: Sitting on the Line Into CPI
NQ traded one-fifth of a normal range, parked on its volatility-inflection line at 29,700. Why the 29,642 shelf is the buy into Wednesday's CPI.
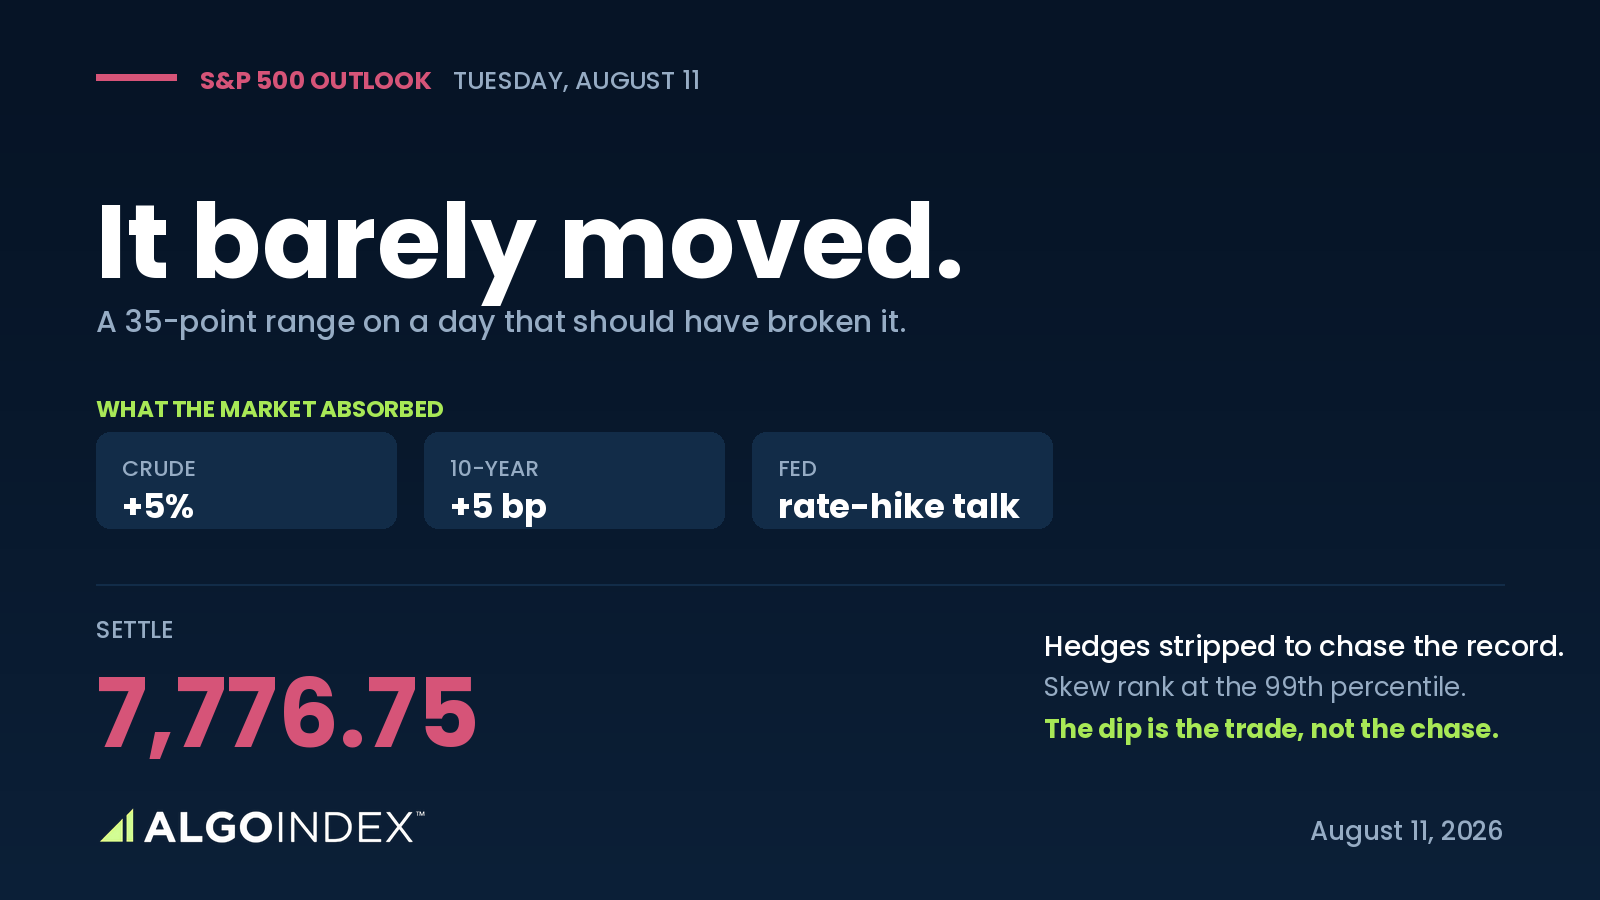
S&P 500: A 35-Point Day on a Five-Percent Oil Move
The S&P absorbed a 5% oil move in a 35-point range with its hedges stripped out. Why Tuesday's setup is a dip into the 7,756 shelf before CPI.
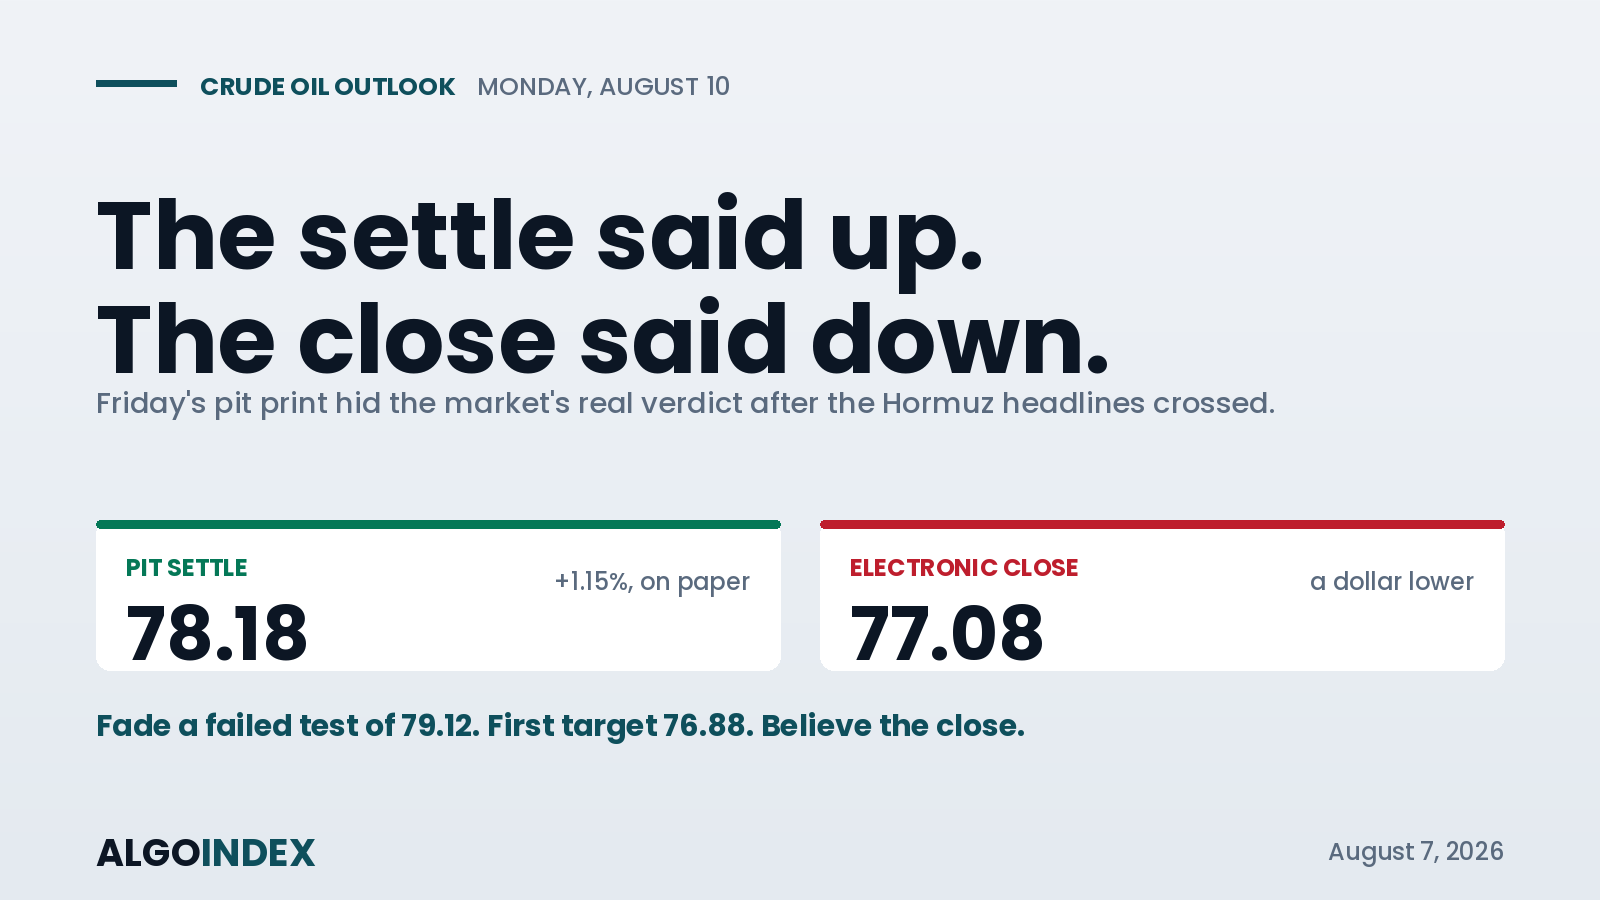
Crude Oil: The Settle Said Up, the Close Said Down
WTI settled up 1.15% but the electronic close was a dollar lower after the Hormuz headlines. Why Monday's plan fades a failed test of 79.12.
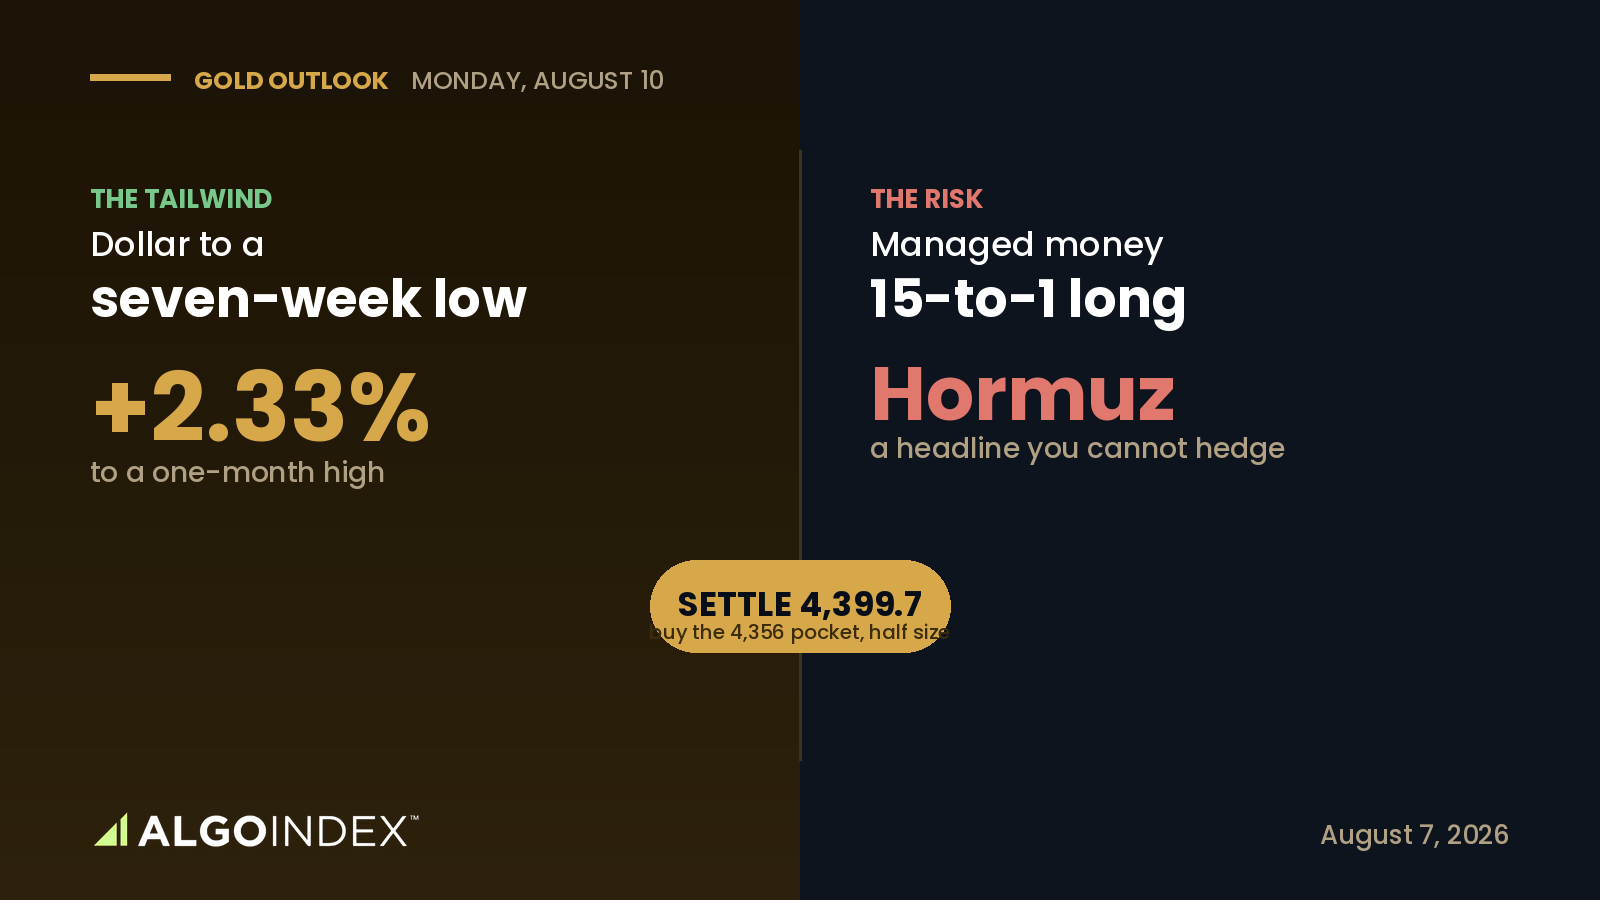
Gold: Fifteen-to-One Long, With a Hormuz Headline in the Way
Gold jumped 2.3% to a one-month high as the dollar hit a seven-week low. Why the setup is a pullback into 4,356, half size, not a chase of 4,432.
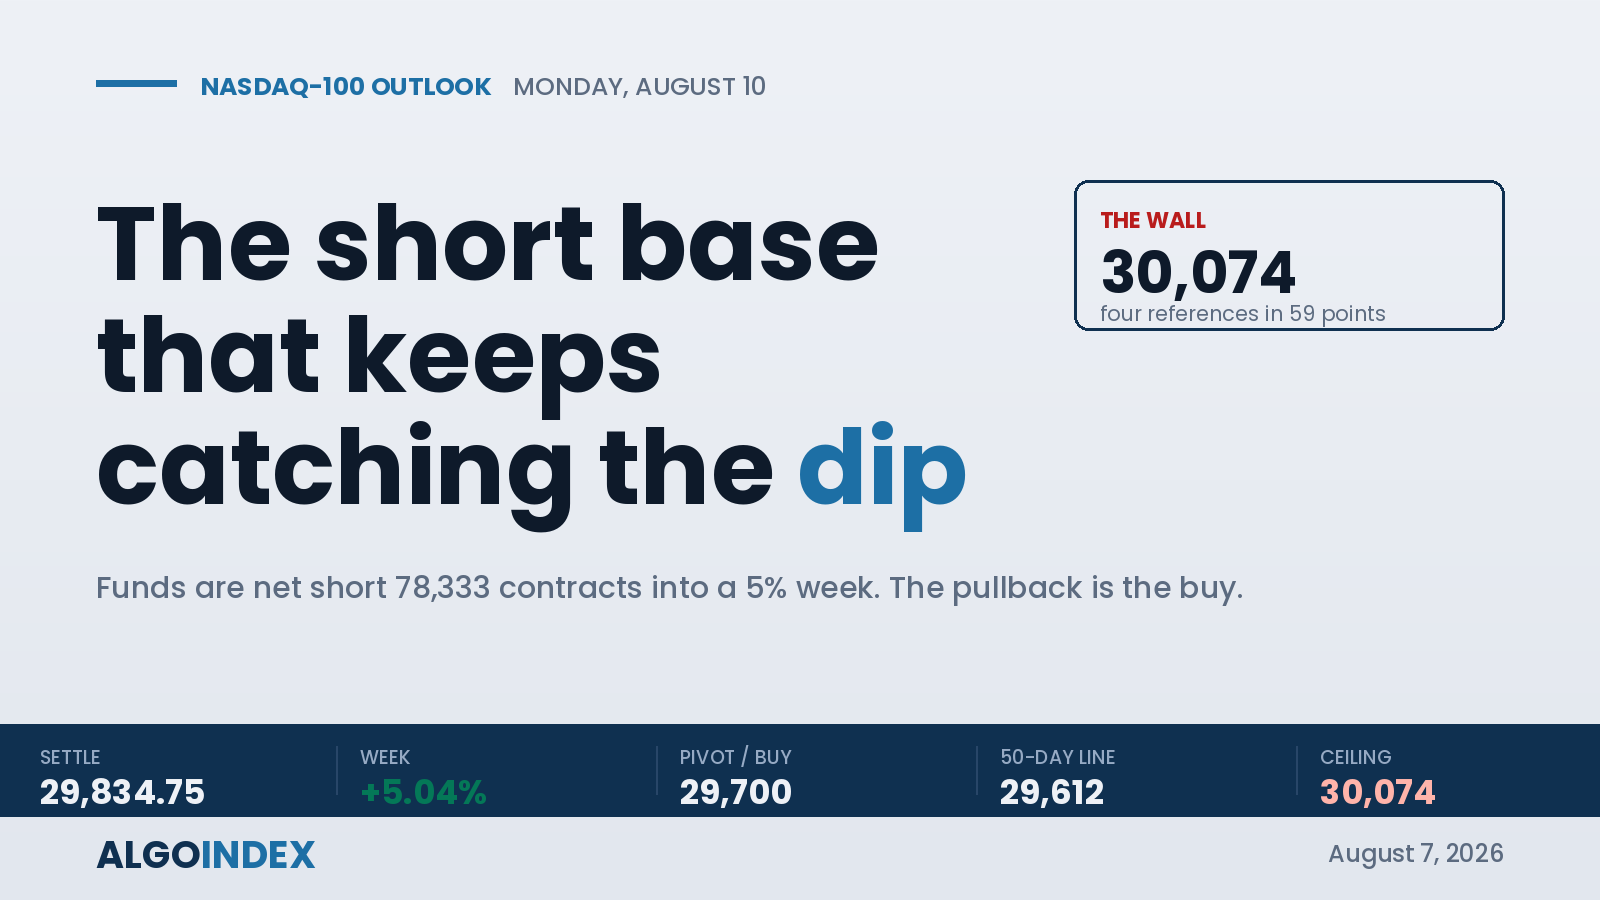
Nasdaq 100: The Short Base That Keeps Catching the Dip
NQ closed the week up 5% with leveraged funds still net short 78,333 contracts. Why the pullback into 29,700 is the buy and 30,074 is the wall.
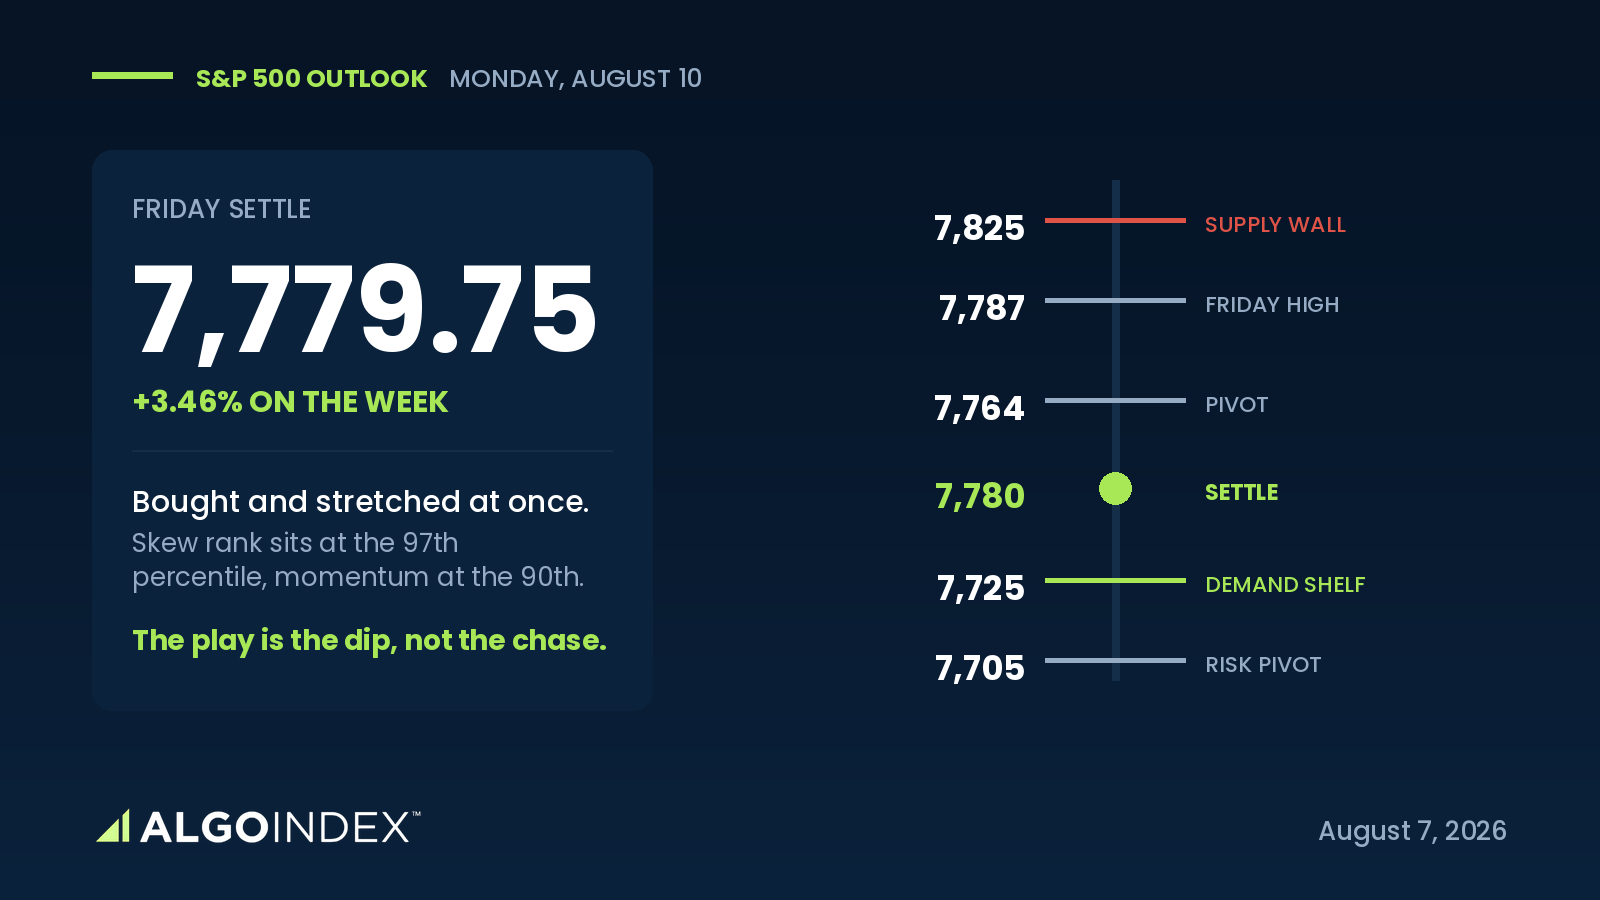
S&P 500 Bought and Stretched: The Shelf That Decides Monday
Friday's payrolls miss pushed the S&P to the edge of a record. Why Monday's setup is a dip into the 7,725 shelf, not a chase into 7,820 supply.
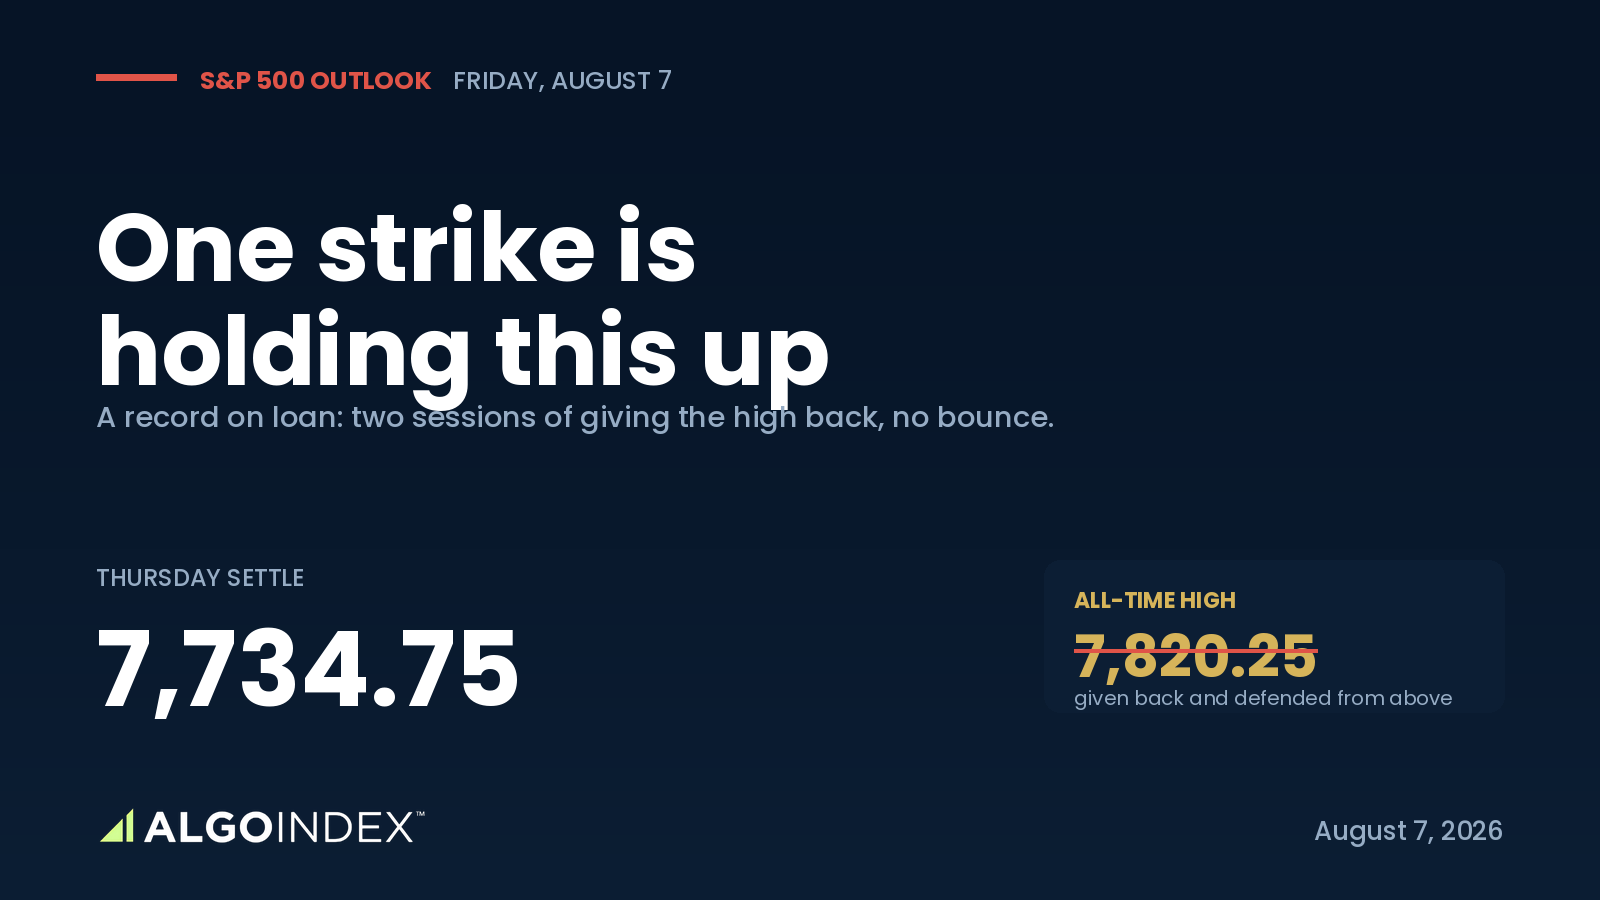
S&P 500 (ES): One Strike Is Holding This Up, August 7, 2026
The E-mini settled 7,734.75 in the bottom quartile of a compressed range, held up by roughly 9,000 lots of dealer short puts at one strike with 54 points of almost nothing beneath. Full level map, positioning and trade setups for Friday.
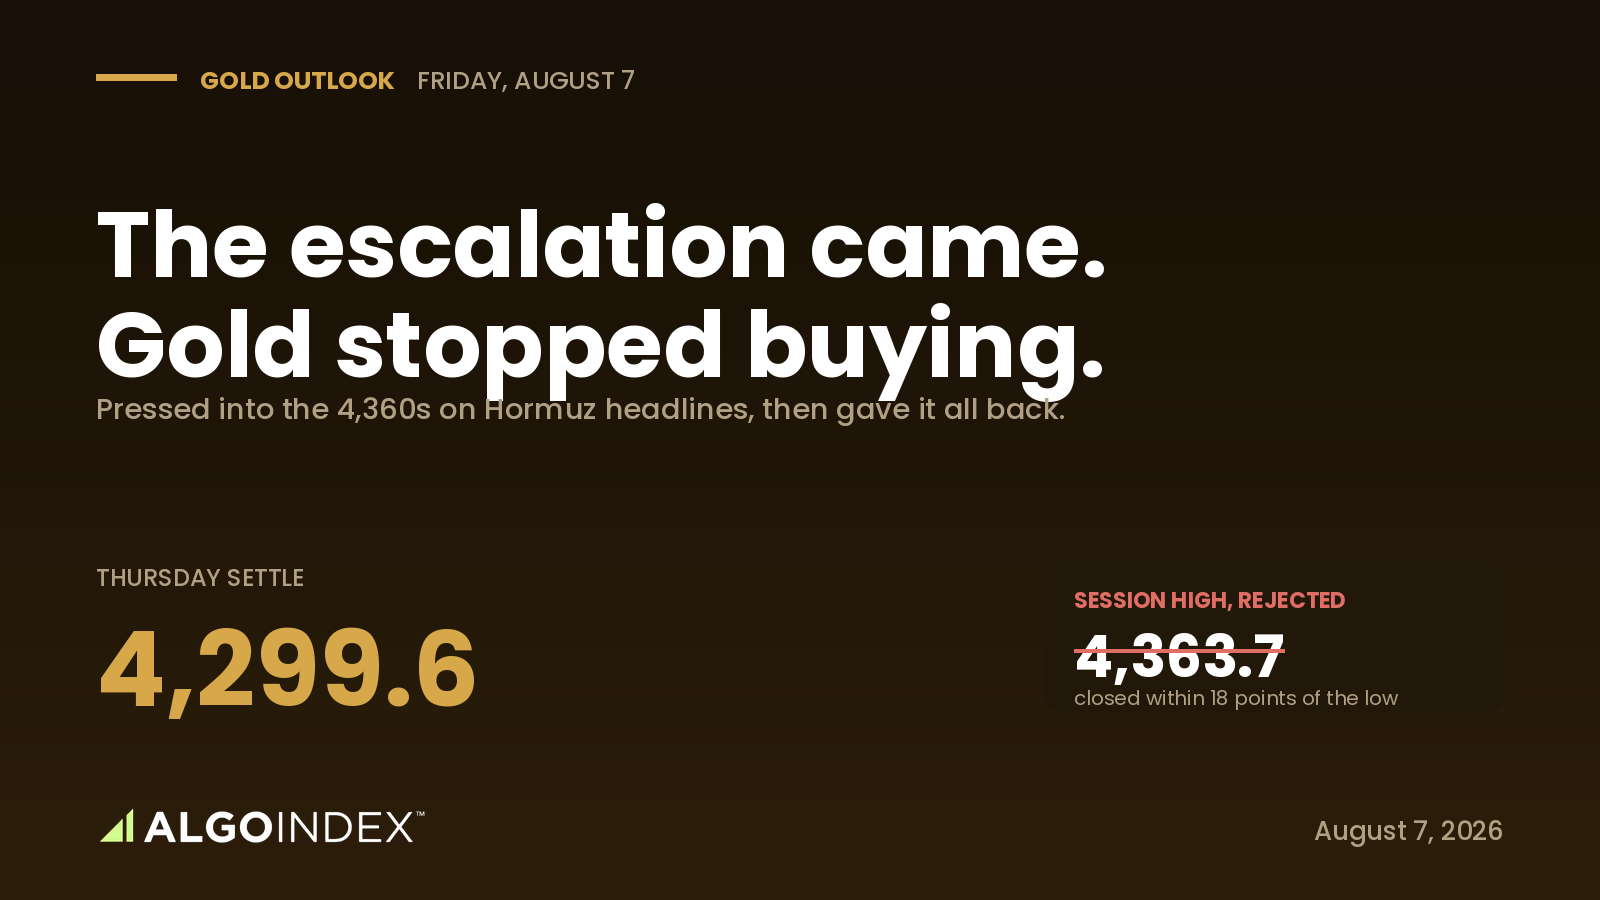
Gold (GC): The Escalation Came, Gold Stopped Buying, August 7, 2026
Gold ran to 4,363.7 as Iranian forces struck inside the Strait, then handed back 64 points to settle 4,299.6 near the low. Full level map, options positioning and trade setups for Friday.
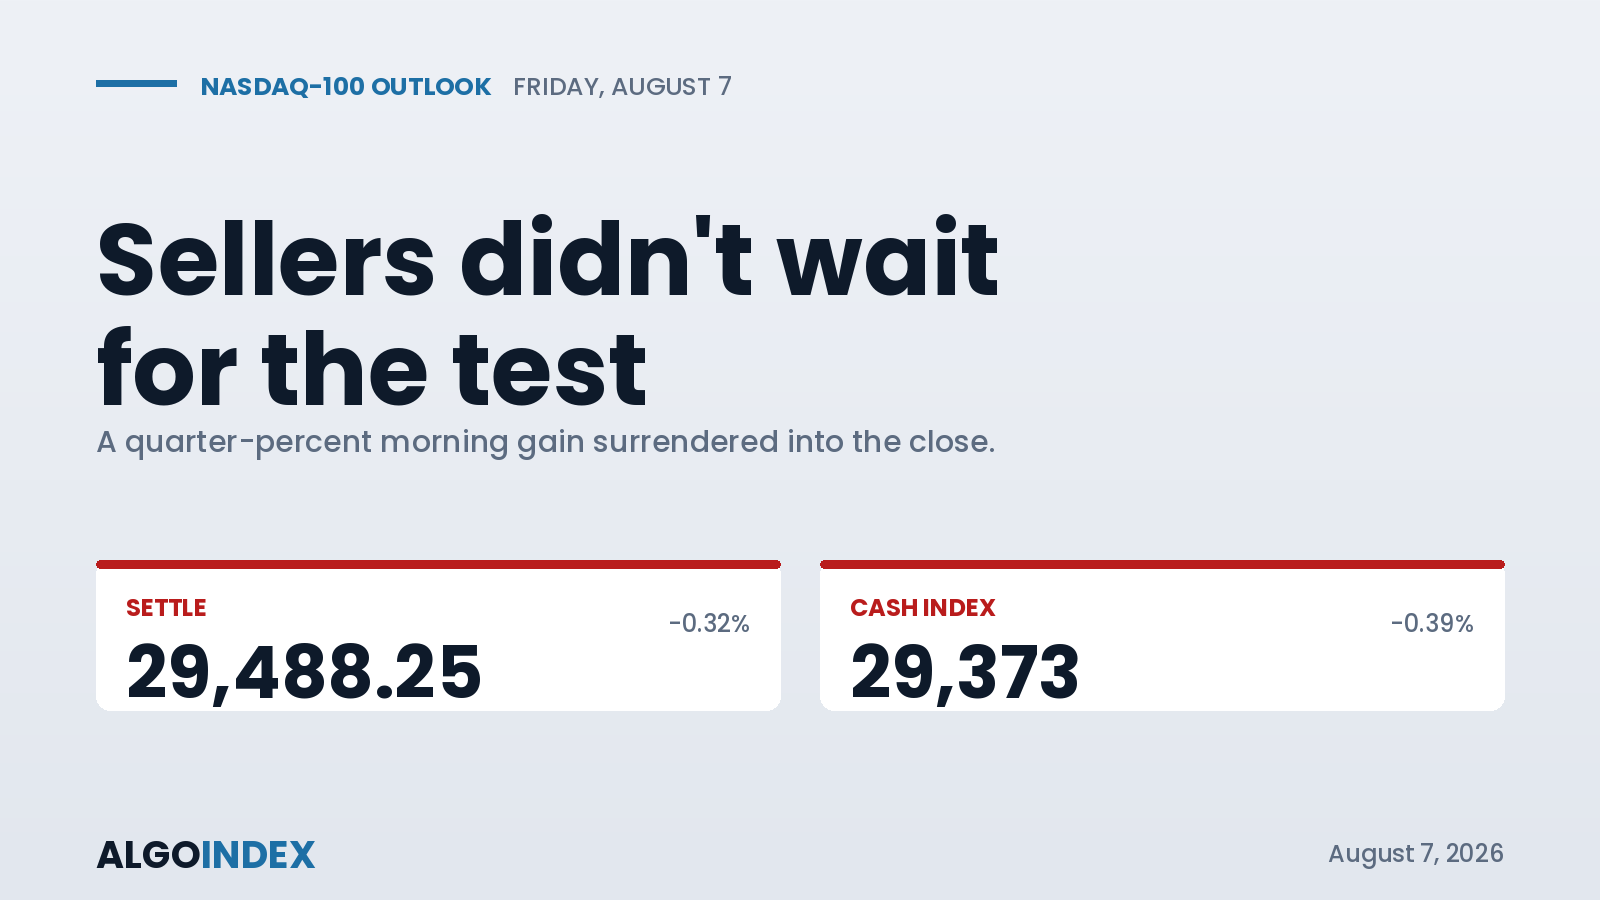
Nasdaq-100 (NQ): Sellers Didn't Wait For The Test, August 7, 2026
NQ settled 29,488.25 after giving back an early quarter-per-cent gain, with supply arriving 95 points beneath a 50-day average that never got tested. Full level map, positioning and trade setups for Friday.