
AlgoIndex Blog
Daily institutional reviews and longer-form market research. The same analysis that drives our automated trading strategies.
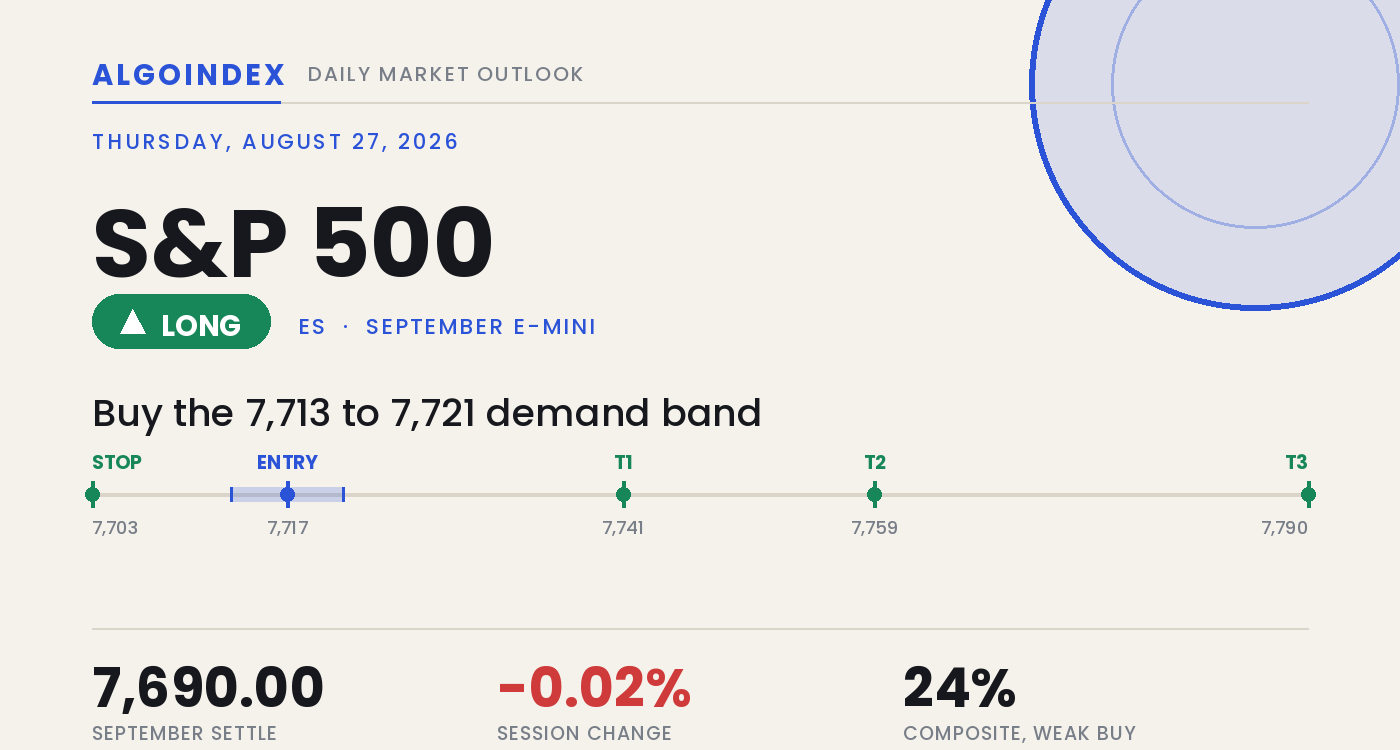
S&P 500: Buying the Retest After the Nvidia Gap
Nvidia's beat gapped the S&P futures to 7,741 overnight. Why Thursday's plan buys the 7,713 to 7,721 retest rather than chasing, with the pivot at ES 7,710.
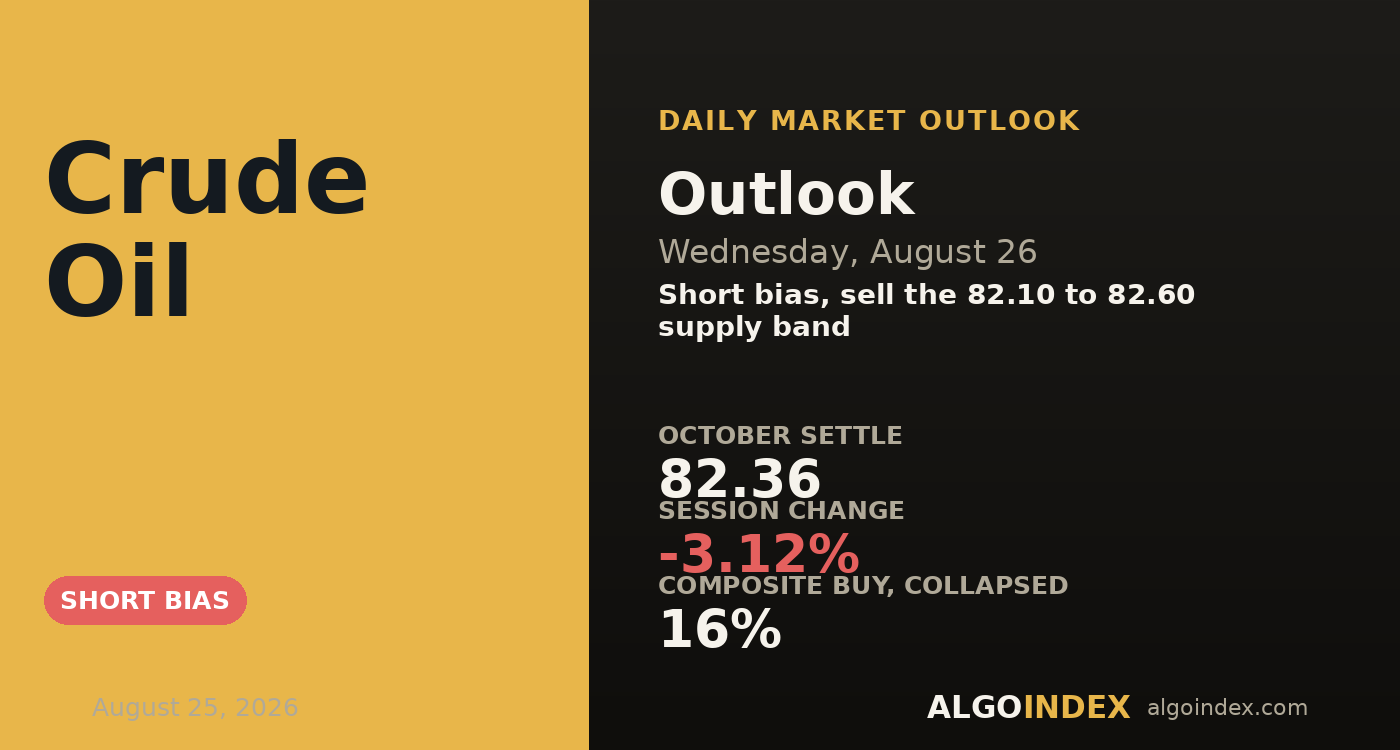
Crude Oil: Selling the Rally Into Inventories
Crude settled at 82.36 on a heavy session into Wednesday's inventory report. Why the plan sells the 82.10 to 82.60 rally, with 83.35 the stop.
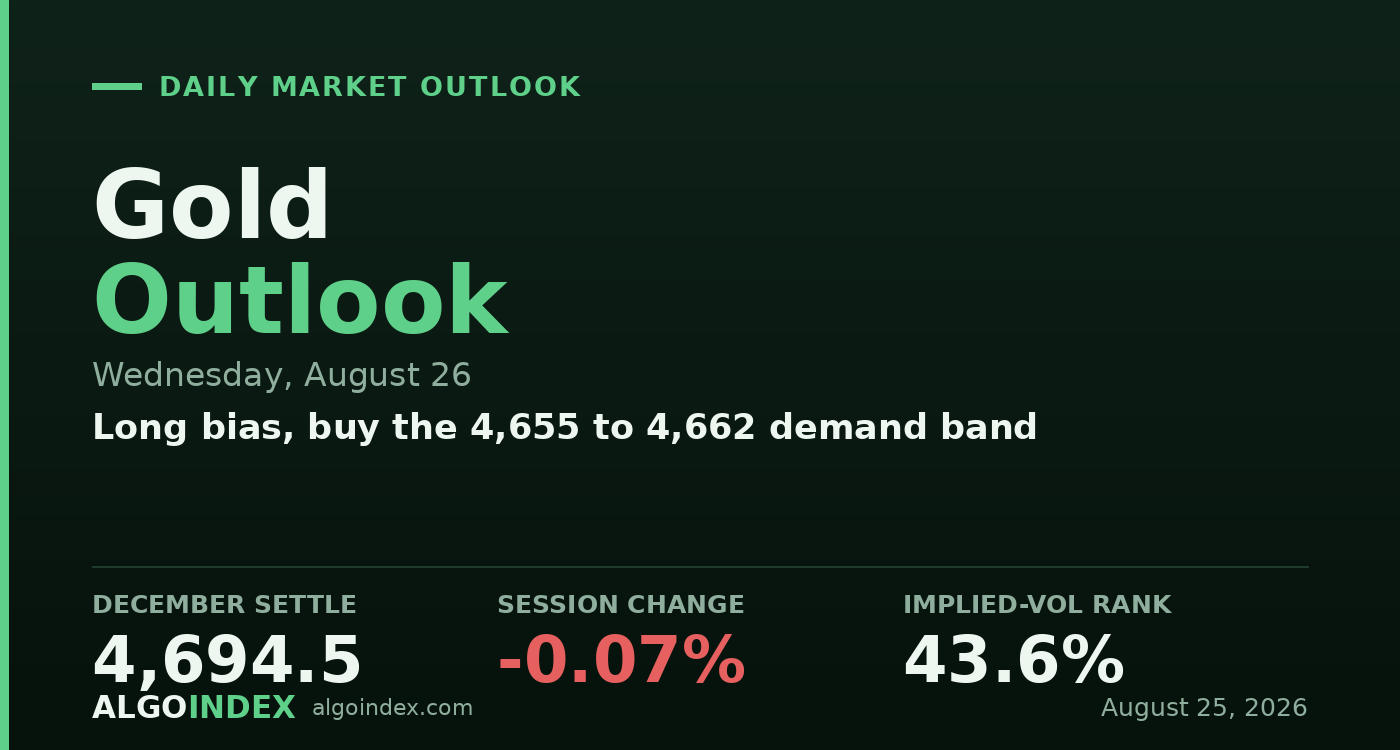
Gold: Holding the High Into the Inflation Print
Gold held near a high at 4,694 into Wednesday's inflation print. Why the plan dip-buys the 4,655 to 4,662 band, with 4,640 the line.
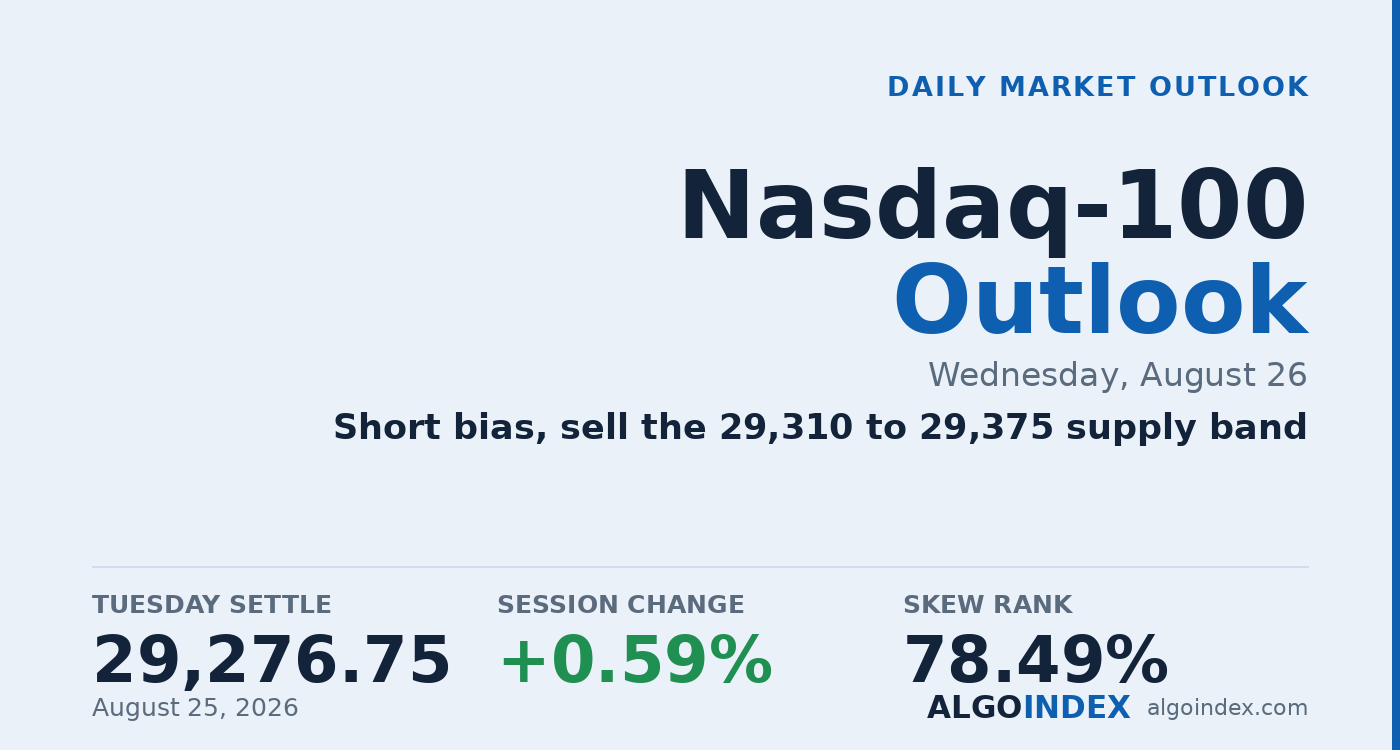
Nasdaq-100: Fading the Bounce Ahead of PCE
The Nasdaq rose 0.59 percent to 29,277 but the push stalled. Why Wednesday fades the 29,310 to 29,375 bounce ahead of PCE, with 29,435 the stop.
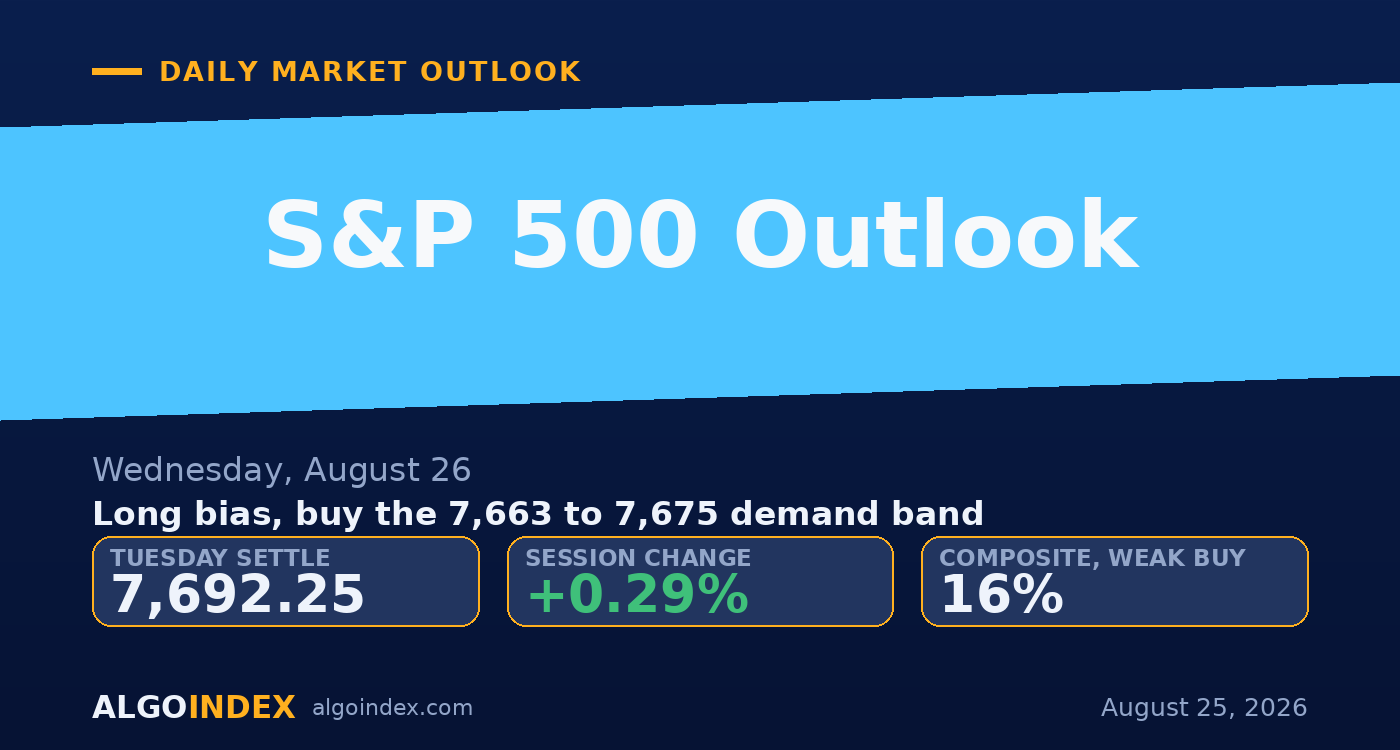
S&P 500: Buying the Dip Into the PCE Print
The S&P firmed to 7,692 before Wednesday's PCE print. Why the plan buys the 7,663 to 7,675 support band, with 7,651 the line.
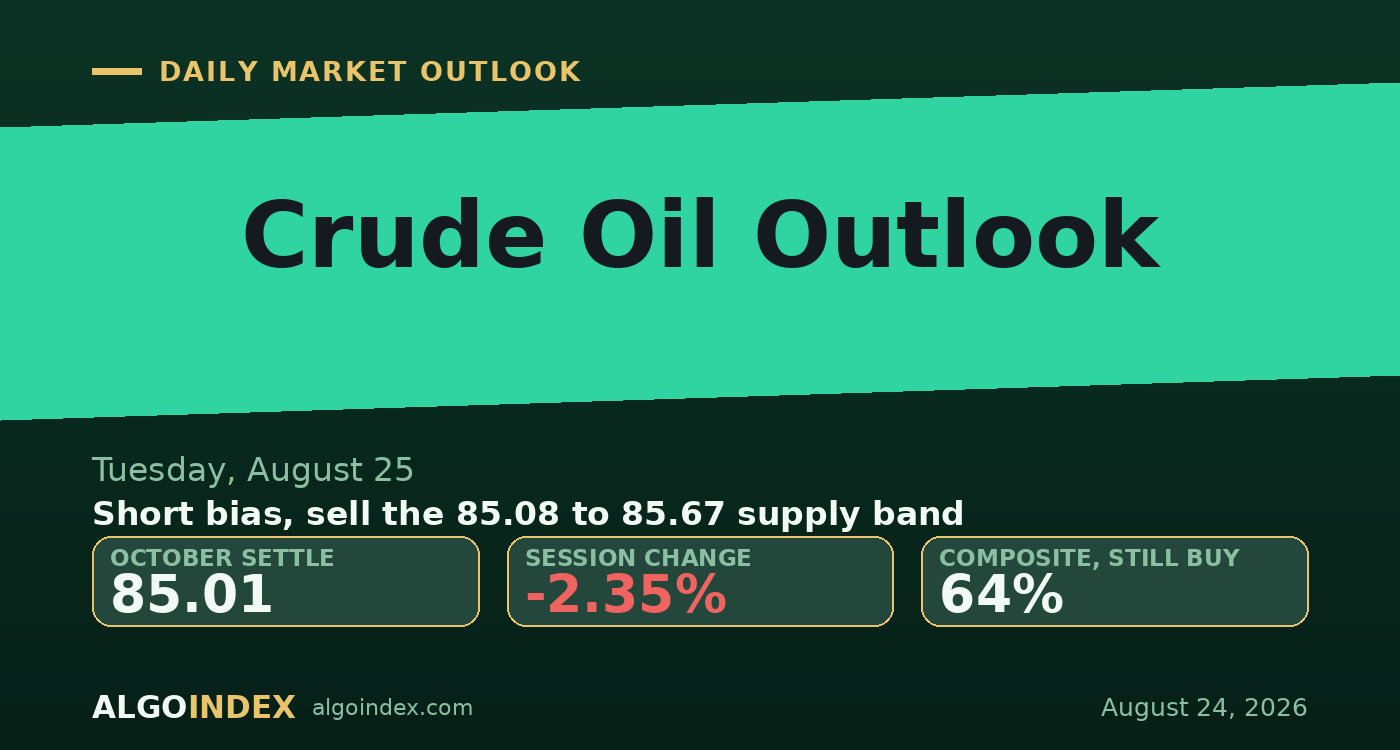
Crude Oil: A Risk Premium Bleeding Out
Crude fell 2.35 percent to an 85.01 October settle as a risk premium bled out. Why Tuesday sells rallies into 85.08 to 85.67, with 86.15 the stop.
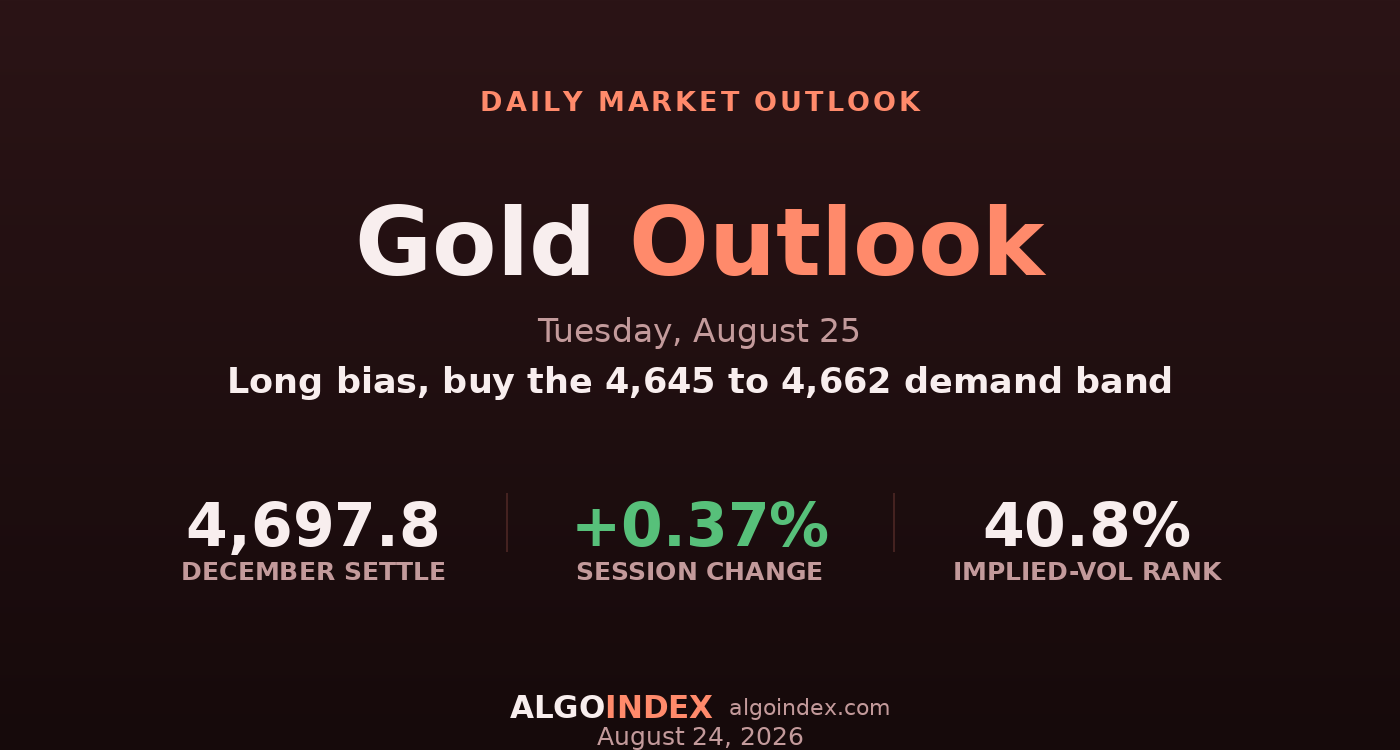
Gold: Grinding to New Highs, Buy the Dip
Gold pressed to another high near 4,698 on a soft dollar. Why Tuesday dip-buys the 4,645 to 4,662 pocket rather than chasing, with 4,600 the line.
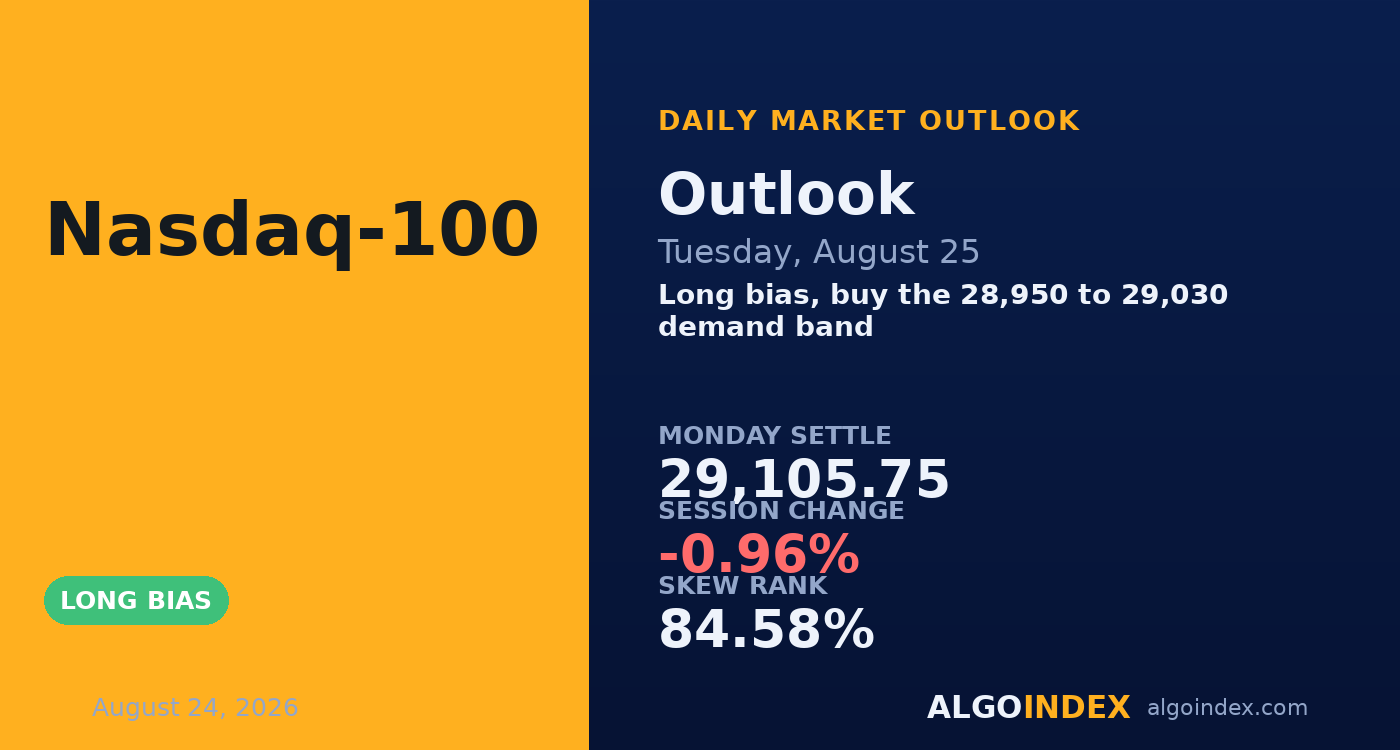
Nasdaq-100: A Sharp Drop, and a Bounce to Buy
The Nasdaq dropped 0.96 percent to 29,106. Why Tuesday buys the 28,950 to 29,030 support band on a bounce, with 28,860 the stop.
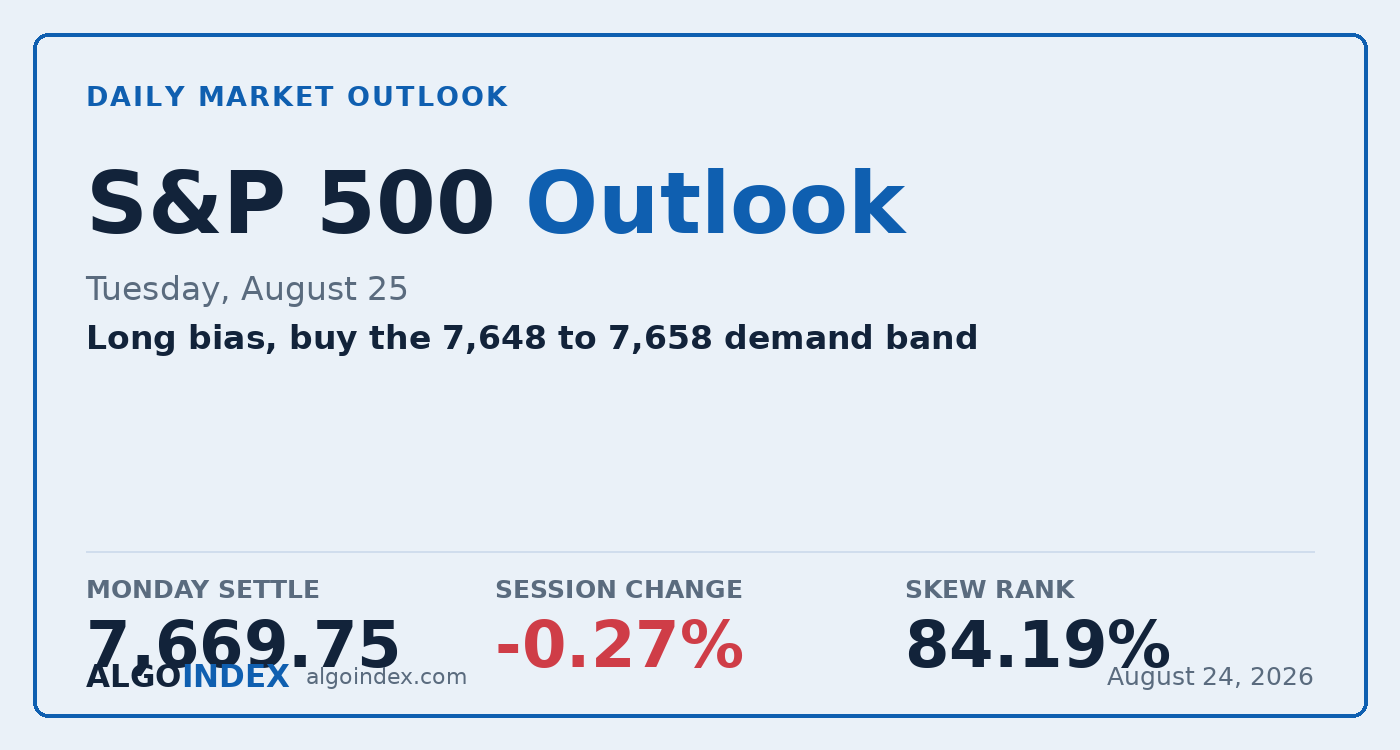
S&P 500: Buying the Dip Off a Dense Support Shelf
The S&P eased to 7,669 into a light Tuesday. Why the plan buys the 7,648 to 7,658 support shelf, with 7,634 the line.
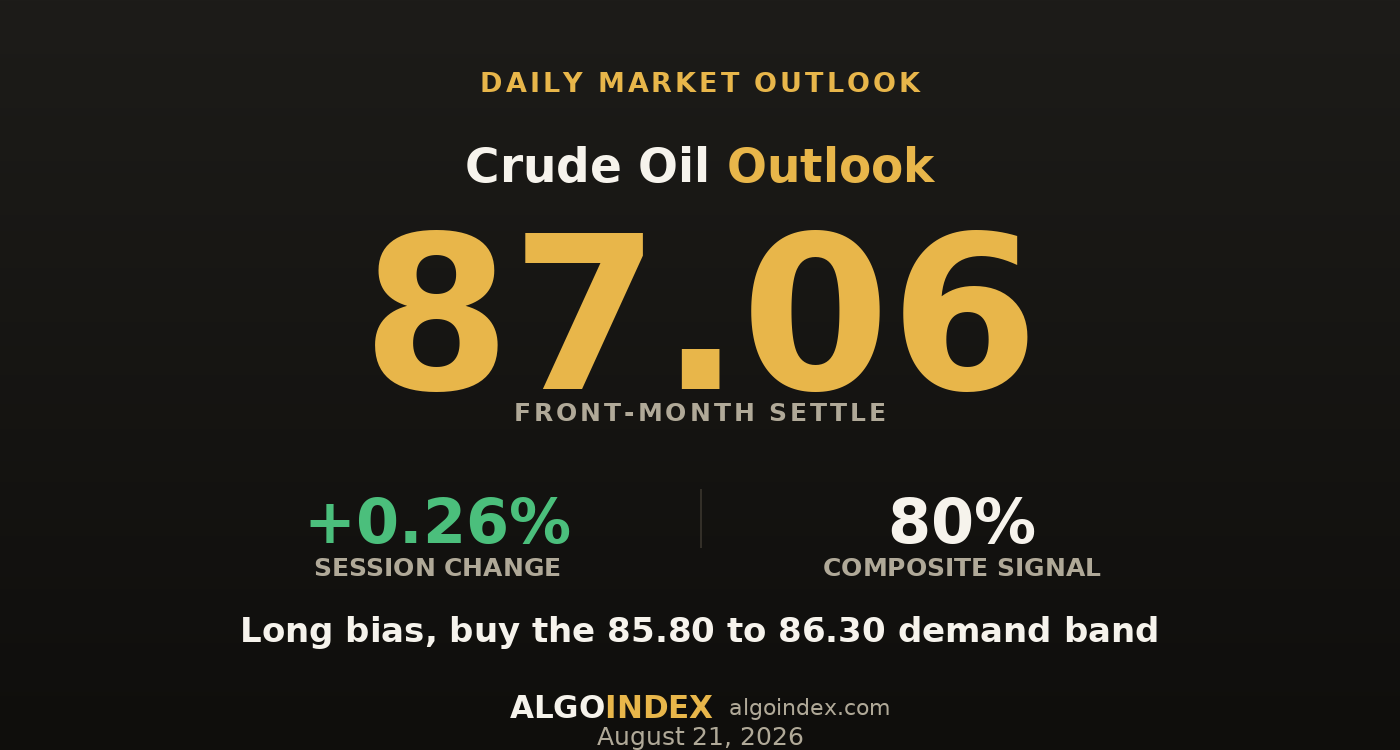
Crude Oil: A Firm Settle Ahead of a Monday Catalyst
Crude firmed to an 87.06 October settle before a tentative Monday catalyst. Why the plan buys the 85.80 to 86.30 band, with 85.20 the stop.
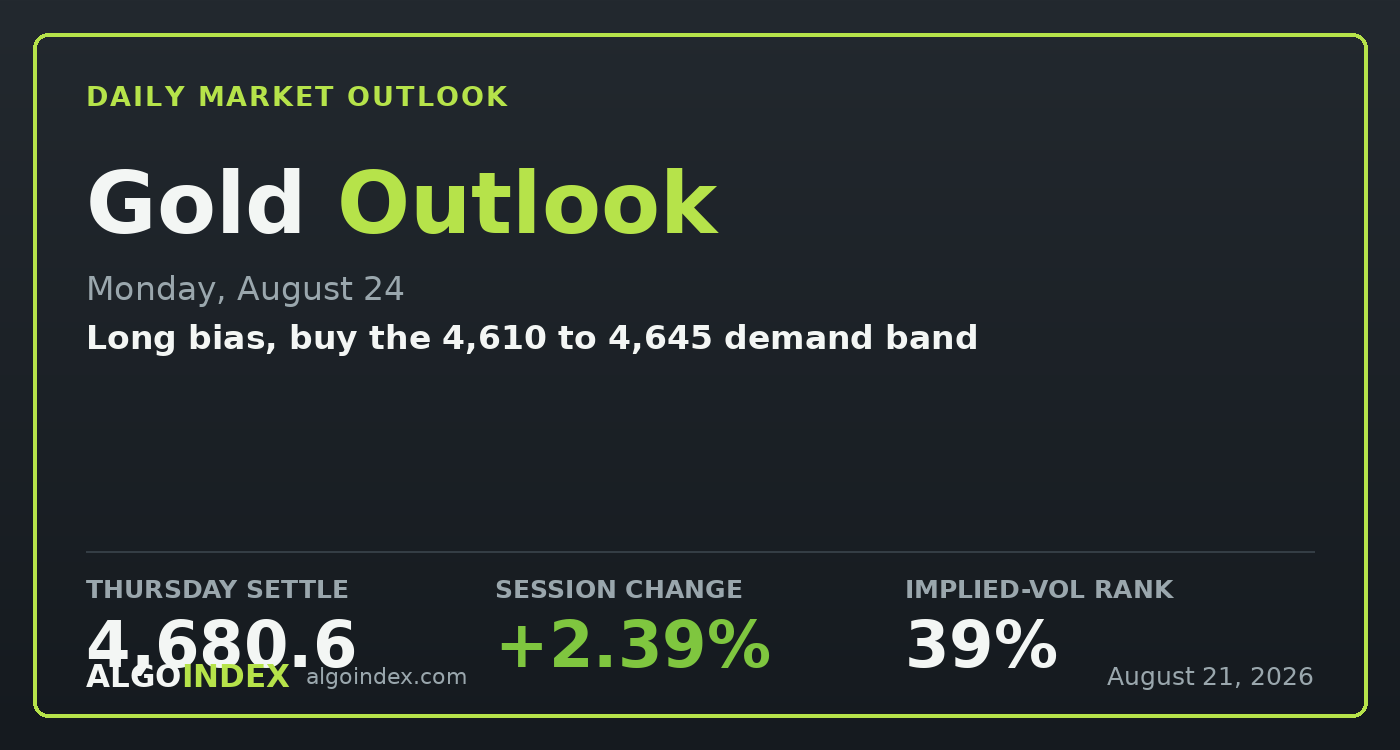
Gold: A Fresh High, and Where to Buy the Pullback
Gold jumped 2.39 percent to a fresh high near 4,681 on a weak dollar. Why Monday dip-buys the 4,610 to 4,645 band rather than chasing, with 4,558 the line.
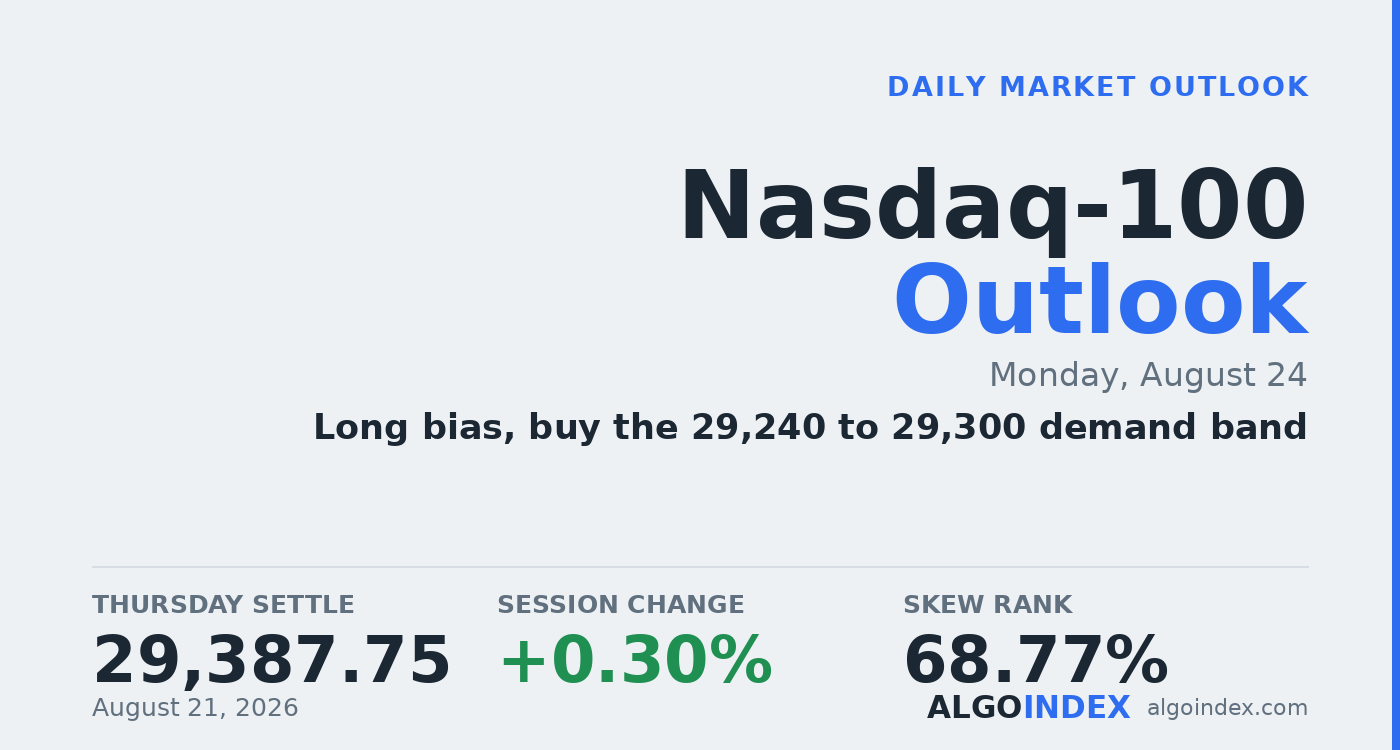
Nasdaq-100: A Bounce Off Support Worth Buying
The Nasdaq settled at 29,388 after a bounce off the 20-day. Why Monday buys the 29,240 to 29,300 support band, with 29,175 the stop.
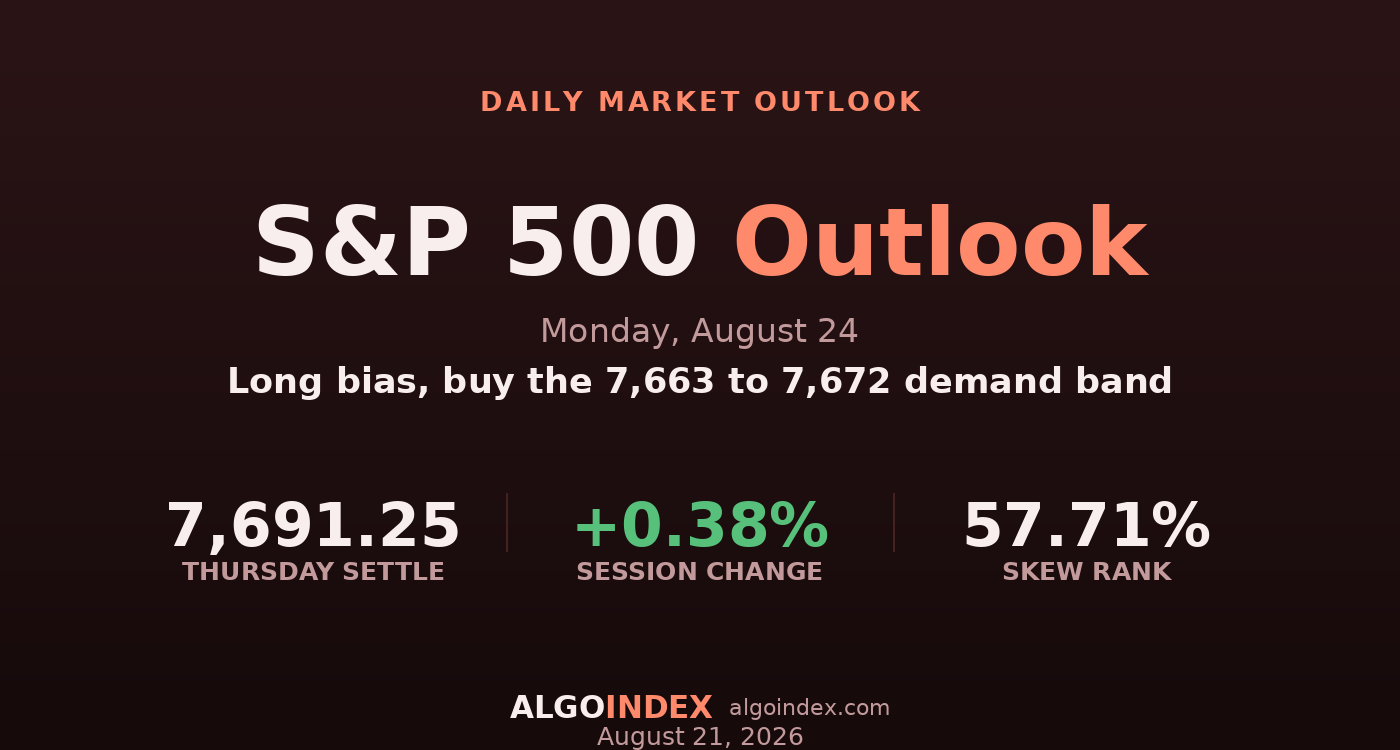
S&P 500: A Constructive Read Into a Light Monday
The S&P firmed to 7,691 into a light Monday calendar. Why the plan buys the 7,663 to 7,672 shelf above the gamma flip, with 7,646 the line.
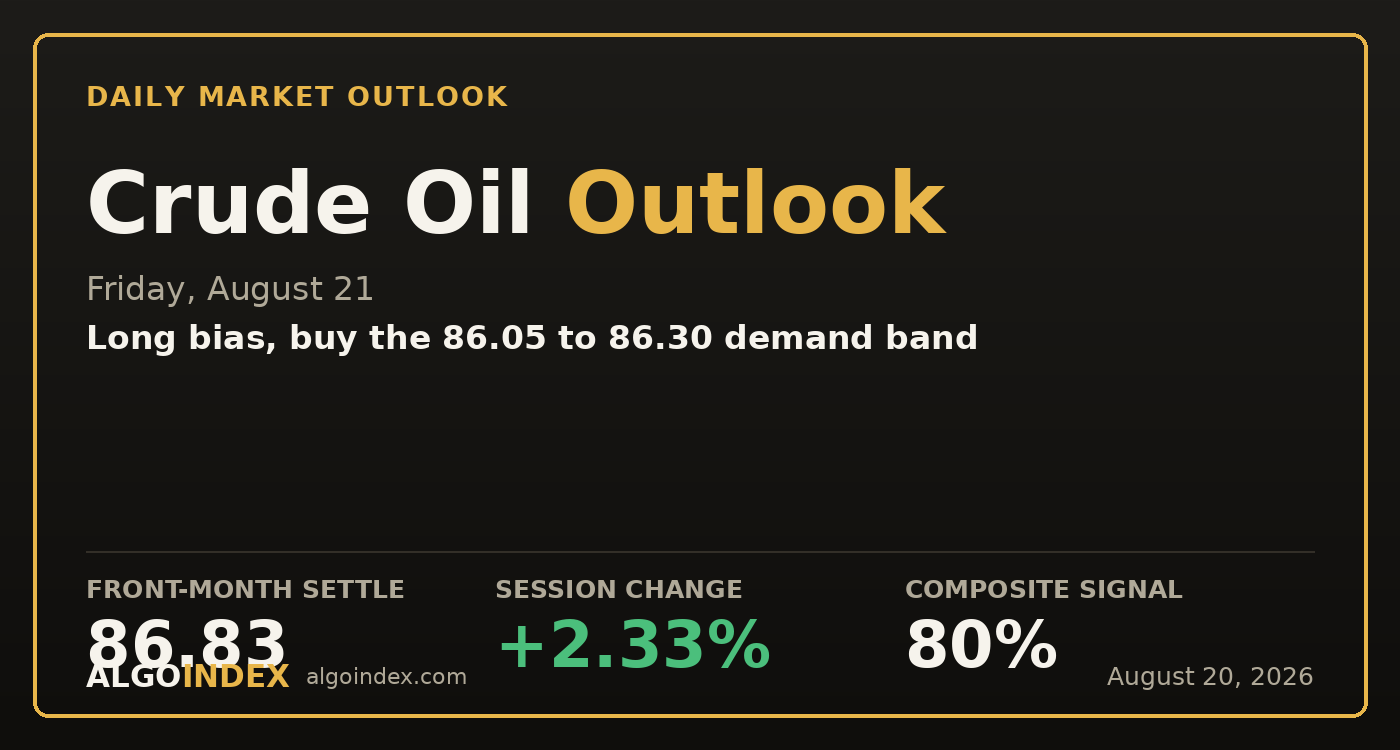
Crude Oil: A New Front Month and a Monday Catalyst
Crude rolled to October and firmed to 86.83 before a Monday isolation catalyst. Why Friday buys the 86.05 to 86.30 pullback, with 85.10 the stop.
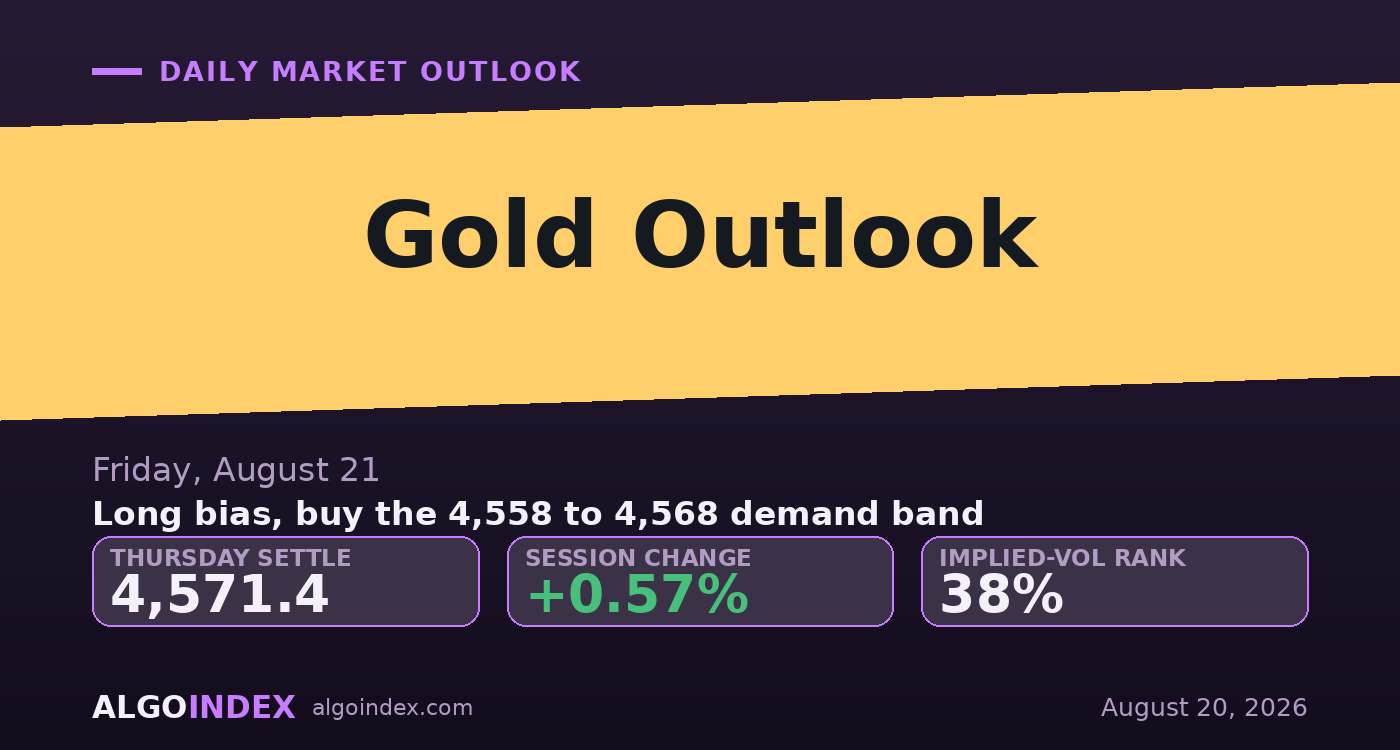
Gold: New Highs, and a Dip Worth Buying
Gold closed at a fresh high near 4,571 on a weak dollar and softer real yields. Why Friday dip-buys the 4,558 to 4,568 band, with 4,519 the line.
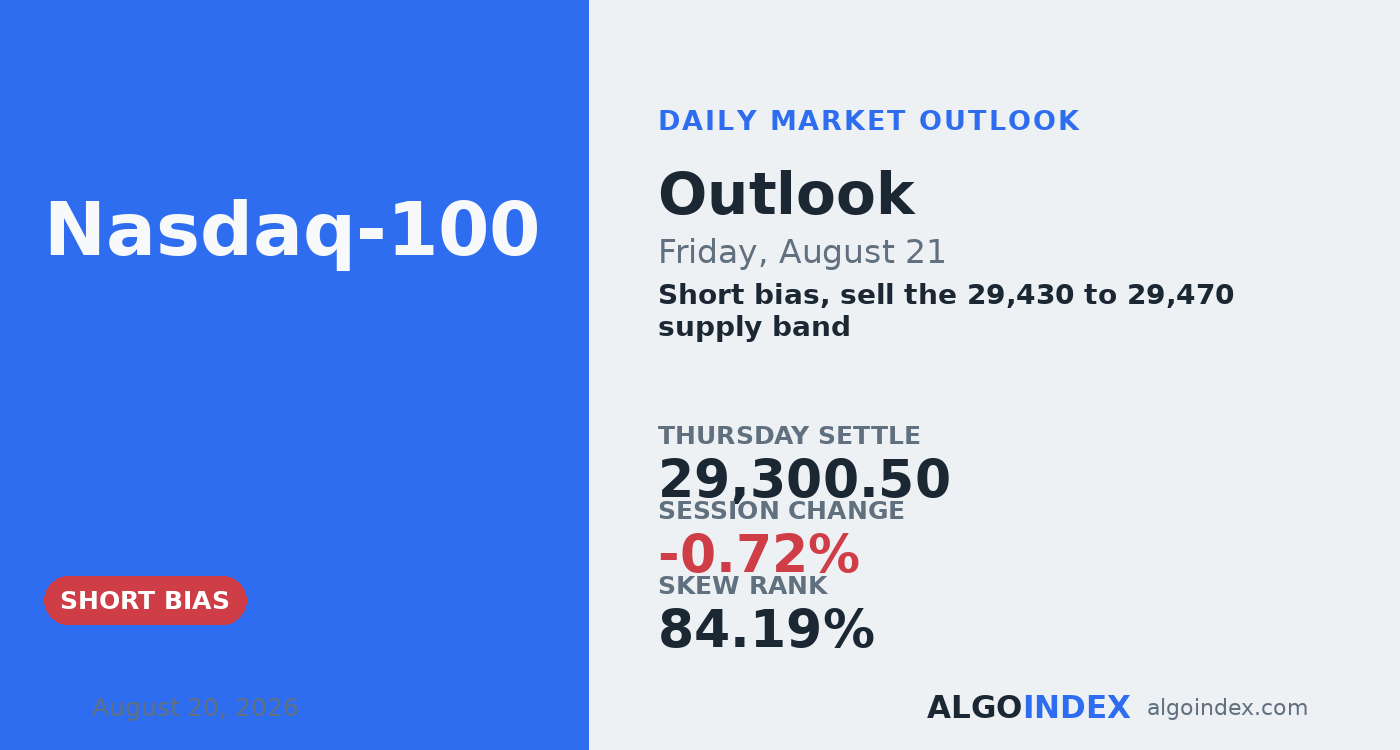
Nasdaq-100: Selling the Bounce After a Fourth Lower Close
The Nasdaq lost 0.72 percent to 29,300, a fourth straight lower close. Why Friday sells the 29,430 to 29,470 bounce while the 50-day caps near 29,535.
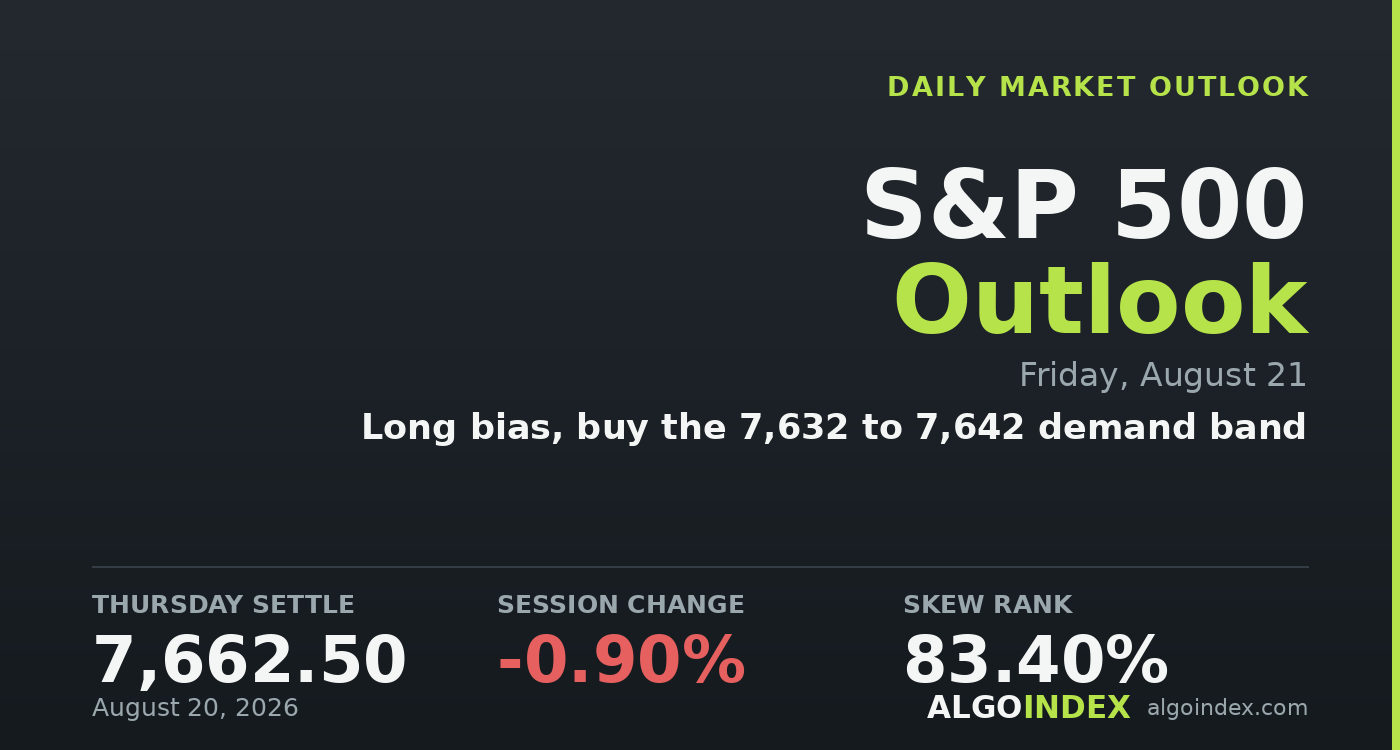
S&P 500: Half Size Into the Monthly Expiration
The S&P eased about 0.9 percent to 7,662 ahead of Friday's monthly expiration. Why the plan buys the 7,632 to 7,642 band at half size, with 7,617 the line.
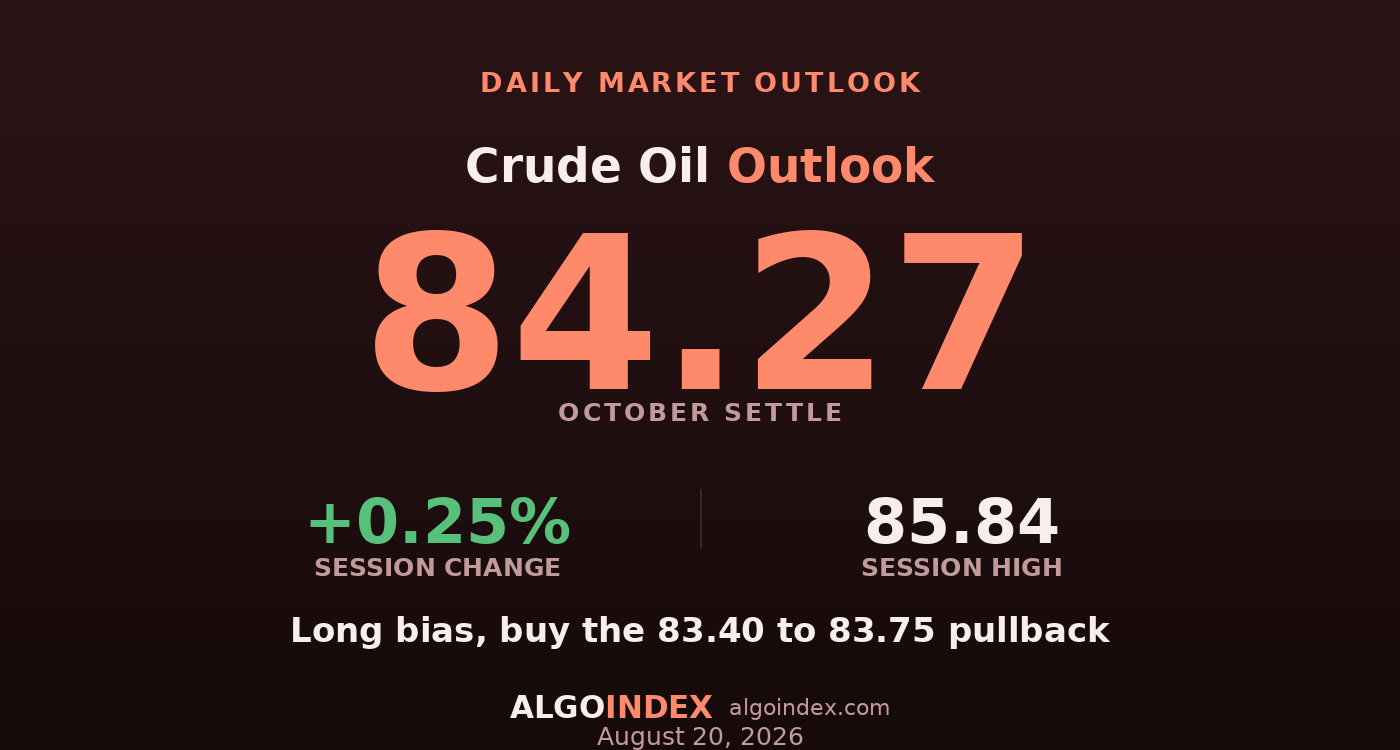
Crude Oil: Barrels That Cannot Move, and Barrels Piling Up
Crude gave back a 1.78 dollar gain to close on its pivot at 84.27 as a supply bid met a seller. Why Thursday buys the 83.40 to 83.75 pullback above 83.00.
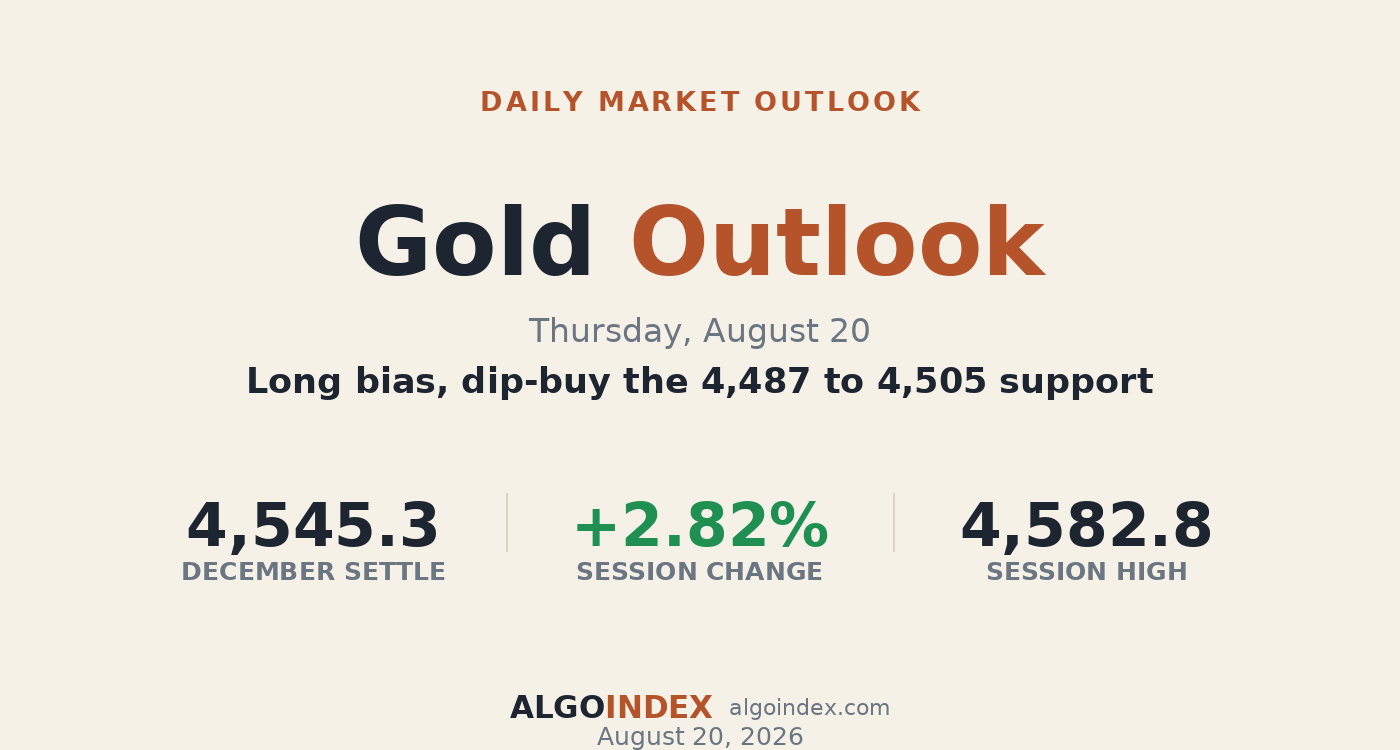
Gold: A Breakout That Closed on Its Highs
Gold surged 2.82 percent to a two-month high on a falling dollar and real yields, closing above the settle. Why Thursday dip-buys the 4,487 to 4,505 support.
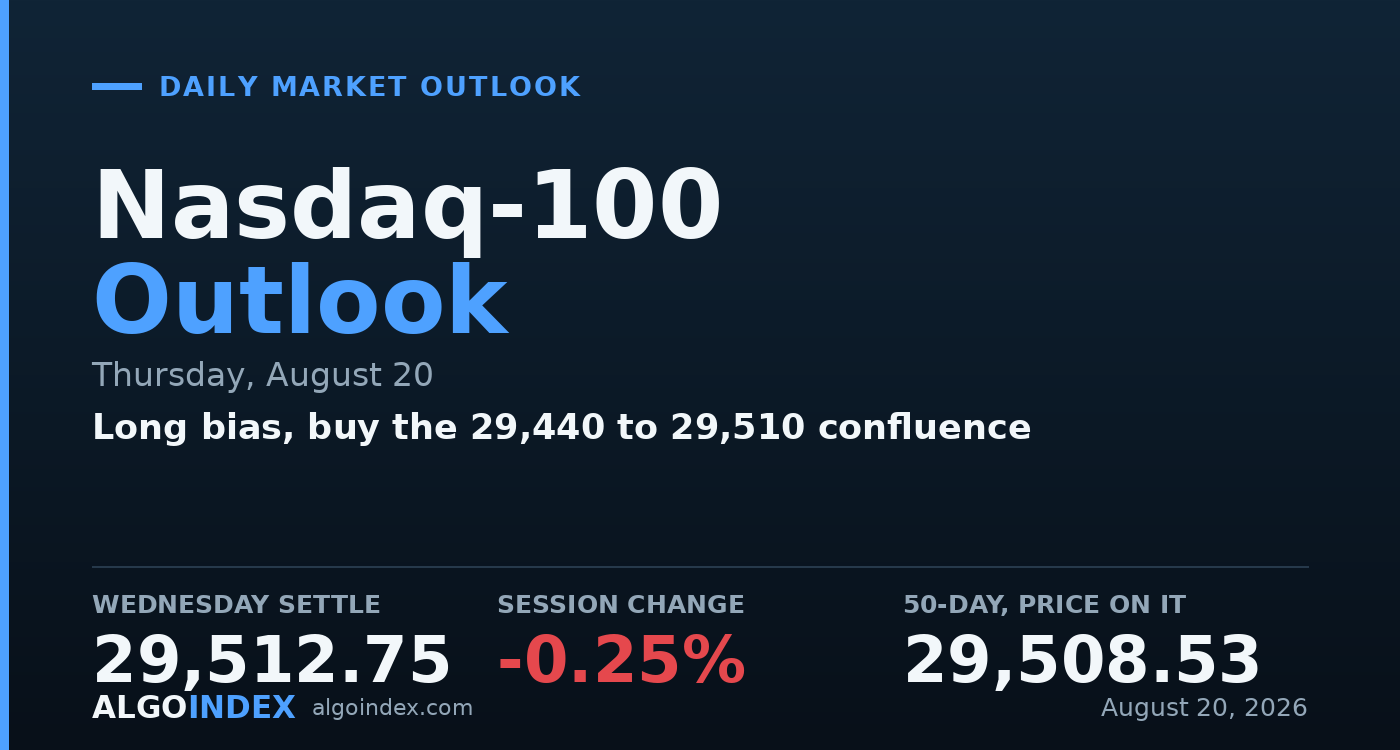
Nasdaq-100: Resting on the Line That Decides the Session
The Nasdaq settled on a three-line confluence, the 50-day and the gamma flip. Why Thursday buys the 29,440 to 29,510 band while it holds, with 29,375 the line.
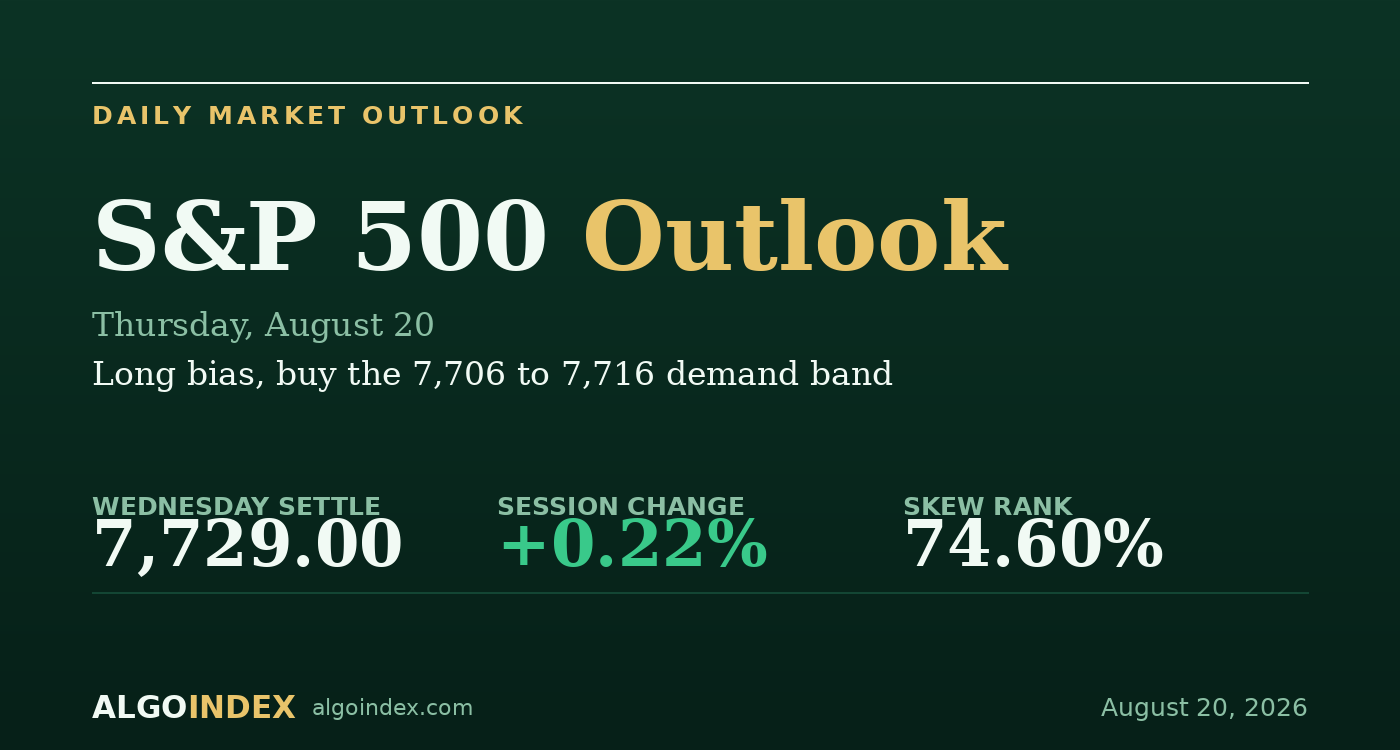
S&P 500: Calm on Top, Rotation Underneath
The S&P closed flat at 7,729 on a debasement-bid rotation, back on its inflection. Why Thursday buys the 7,706 to 7,716 demand band above the gamma flip.
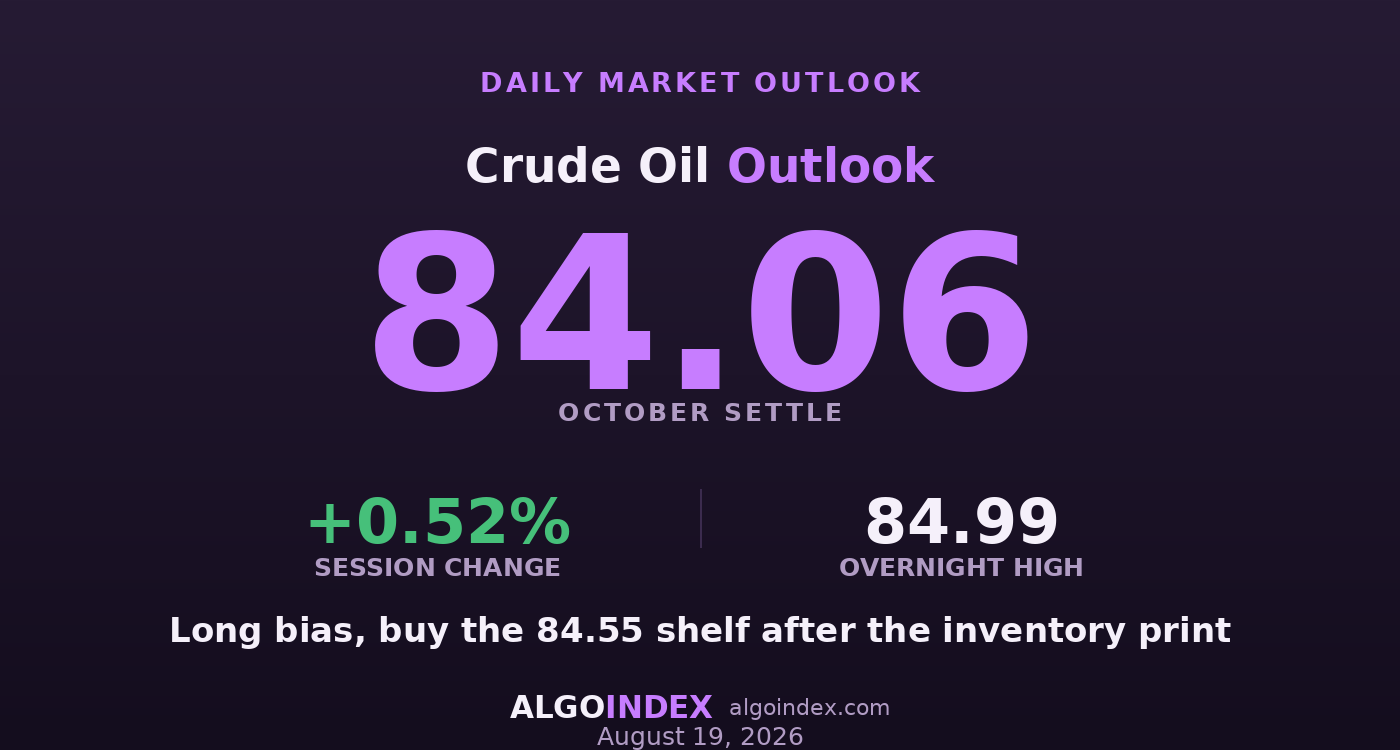
Crude Oil: Strong Structure, Spent Momentum, Thin Support
Crude settled at 84.06 and bid to 84.99 overnight on Hormuz escalation. Why Wednesday buys the 84.55 shelf after the inventory print, gated on the number.
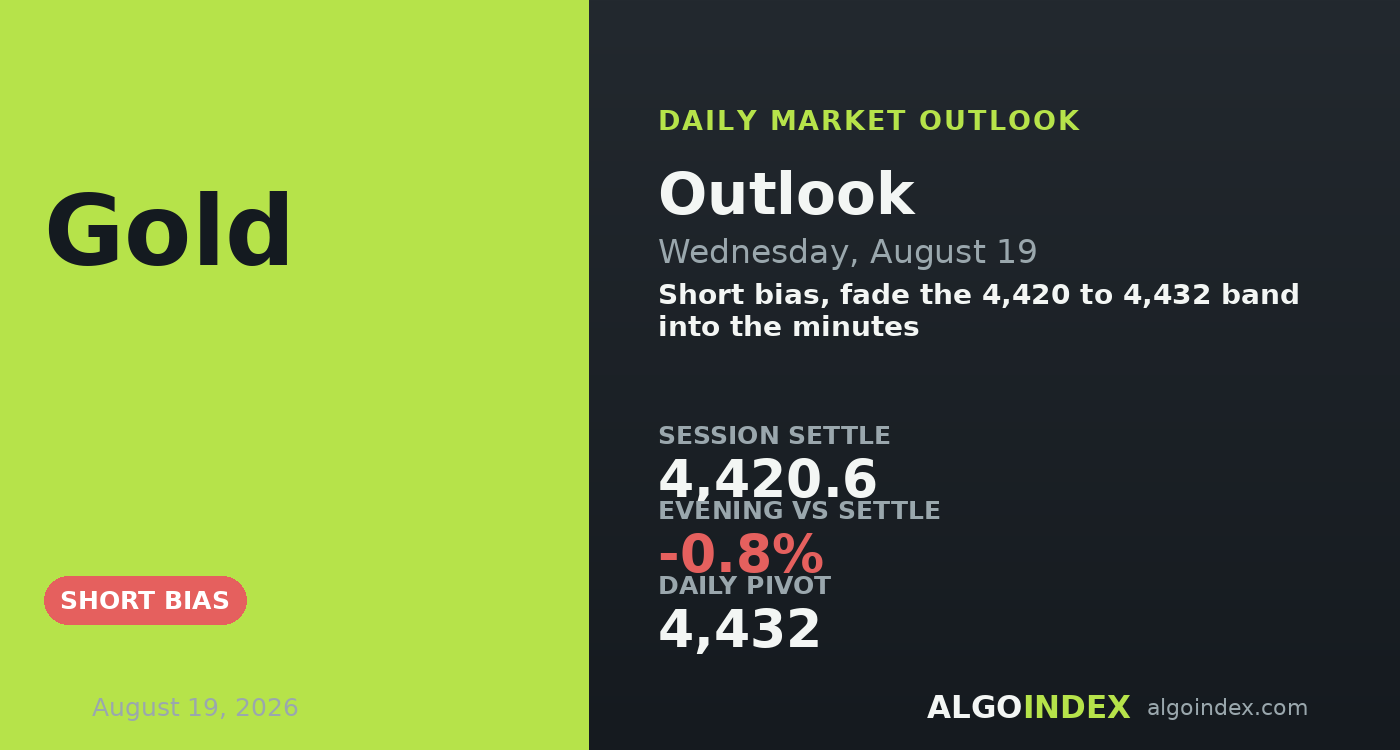
Gold: A Strong Run Pausing Under Resistance
Gold settled at 4,420.6 under the 4,432 pivot as long-end yields rose. Why Wednesday fades the 4,420 to 4,432 band, with the 2 o'clock minutes as the override.
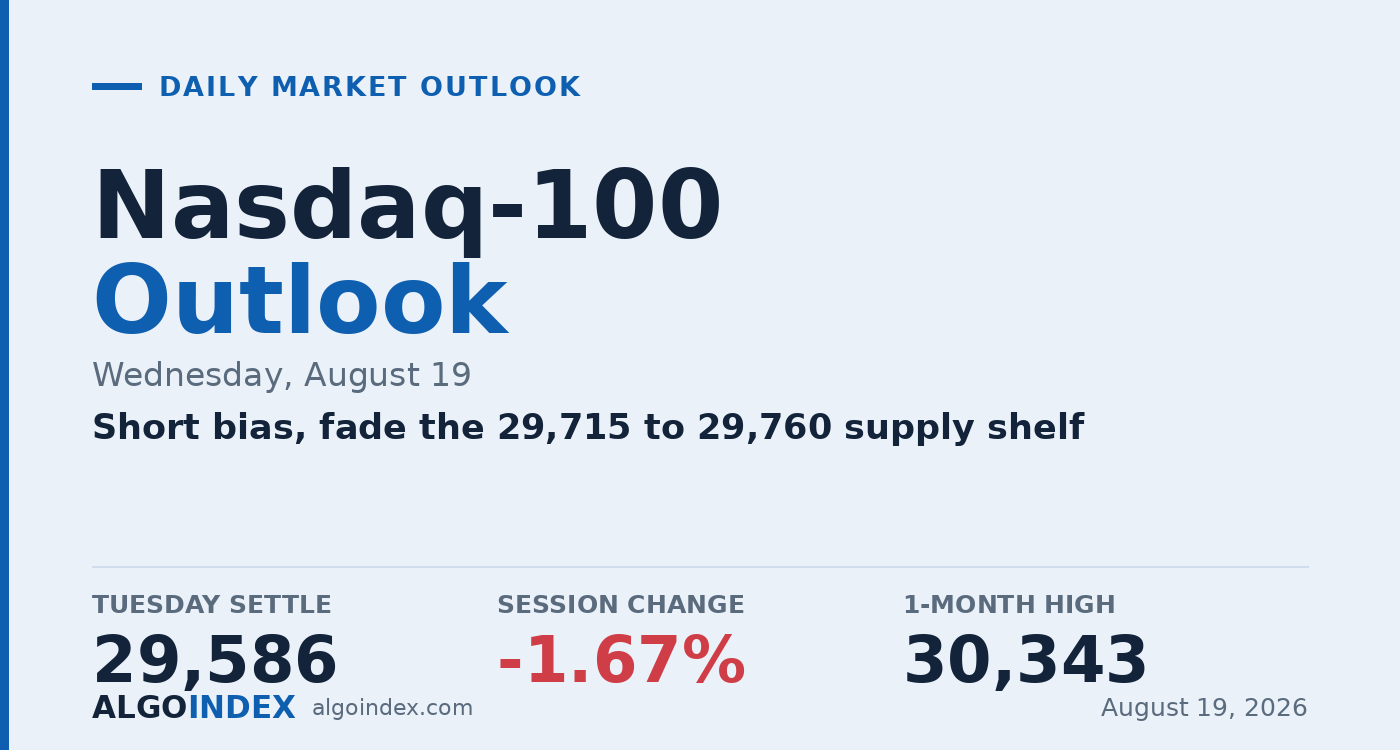
Nasdaq-100: Constructive Above, Broken Below
The Nasdaq fell 1.67 percent on a chip-led, rates-driven selloff and closed on its gamma flip. Why Wednesday fades the 29,715 to 29,760 shelf.